Week-11 Challenge: Braking
AIM : TO defined the braking energy :
Objective :
CASE-1:
1. for a defined driving cycle,calculate he energy required for braking .
as we know that the energy can never be created or neither destroyed with the today's developmen
we have been able to utilize the energy which is been wasted at the time of braking . the kinetic energy which assist the vehicle to also move geats dissipated while the braking is done . though it depending on multiple parameter on how efficient the braking would be it can depending upon.
number of braking pistons
duration and degree of brake pedal been pressed road condition
temperature
brake pad and disc condition
mass of the vehicle
still with a basic operation where the vehicle in motion and the brakes are applied the same efficiency could calculated by the eqn
BE=1/2mv^2
BE= mass of the vehicle
v= velocity
in this manner the same calculation is been carried output for calculate the brake efficiency that would be required at the peak point.it being a drive cycle with speed variation the braking power required would vary but still the highest braking power required is mentioned below
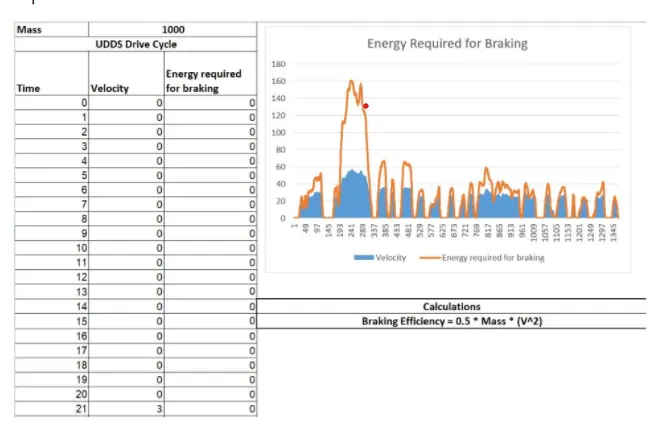
BRAKING ENERGY REQUIRED=160KJ FORR THE SPEED OF 57 KMPH.
Economic Commission for Europe Dynamometer Operating Cycles - Official guidance is found in the United Nations Economic Commission for Europe (UN/ECE) WP.29 1958 Agreement and its Addenda. Guidance is specifically found in Regulation 83 of the Regulations for the Construction of Vehicles.
|
The UN/ECE Elementary Urban Cycle is Part 1 of the ECE Type 1 Test. |
|
|
The UN/ECE Extra-Urban Driving Cycle is Part 2 of the ECE Type 1 Test. |
|
|
The UN/ECE Extra-Urban Driving Cycle (Low Powered Vehicles) is an alternative for Low-Powered Vehicles for Part 2 of the ECE Type 1 Test. |
|
Driving schedules specified in Japanese Technical Standards - Official guidance is found in the Japanese Industrial Safety and Health Association (JISHA) Technical Standards. The 11 Mode and 13 Mode driving schedules are not yet available for posting. Technical Guidances Include:
- Rev. 11-4-28 Technical Standard for 10¥15-Mode Exhaust Emission Measurement for Gasoline-Fueled Motor Vehicles (Jisha 899, 1983);
- Rev. 11-4-29 Technical Standard for 10-Mode and 11-Mode Exhaust Emission Measurement for Gasoline-Fueled Motor Vehicles (Jisha 899, 1983);
- Rev. 11-4-30 Technical Standard for 13-Mode Exhaust Emission Measurement for Gasoline-Fueled Motor Vehicles (Jisha 899, 1983);
- Rev. 11-4-31 Technical Standard for 10.15-Mode Exhaust Emission Measurement for Diesel-Powered Motor Vehicles (Jisha 899, 1983);
- Rev. 11-4-32 Technical Standard for 10-Mode Exhaust Emission Measurement for Diesel-Powered Motor Vehicles (Jisha 899, 1983);
- Rev. TRIAS 5-2-1990 10-Mode Fuel Economy Test Procedure for Gasoline-Fueled Motor Vehicles; and
- Rev. TRIAS 5-3-1991 Technical Standard for 10.15- Fuel Economy Test Procedure for Gasoline-Fueled Motor Vehicles.
|
The Japanese 10 Mode Cycle is used as a component of the total driving schedule for the 10.15 Mode Exhaust Measurement and Fuel Economy Test Procedures. |
|
|
The Japanese 15 Mode Cycle is used as a component of the total driving schedule for the 10.15 Mode Exhaust Measurement and Fuel Economy Test Procedures. |
|
|
The Japanese 10.15 Mode Driving Schedule for Exhaust Measurement and Fuel Economy Test Procedures are specified in Jisha Technical Standards (Jisha 899, 1983). |
|
2.Electic motor cant develop braking torque at high speed similar to starting and how electric and mechanical brakes are coordinated.
electric motor cant develop braking torque at high speed reason
characteristics of motor is shown below.
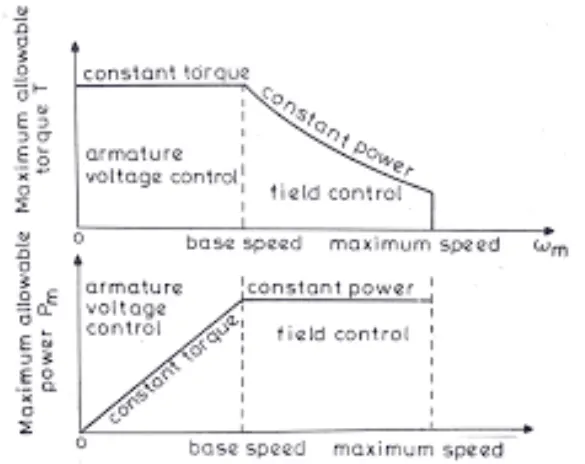
it is clearly show in the first graph that till the motor reaches the critical speed has constant torque and once it reaches the critical speed ,the curve is having a down slop which is a constant power region .and this graph denotes the accelerating operation of motor .for the deceleration pr braking operation of the motor .this graph is mirrored down which will be having the speed (+ve) and torque (-ve)
for example
we can say that an EV can achieve 0-100 kmph in 10sec .Acceleration operation goes this way ,with low speed and high torque region is achieved which has accelerating power and by reaching the critical speed it dhift to constant power region and thus it easy for an EV to reach 0-100 kmph.
electric and mechanical brakes are coordition:
there are two brake control strategies names SERIES&PARALLEL.
series:
brakes will beapplied one after the another so which they are connected in series .either one brake stragety at a time either regenerative braking or mechanical braking at a time .
parallel:
in case of parallel both the brakes are applied simultaneously ,both at a time
eclectic driven intelligent brake:
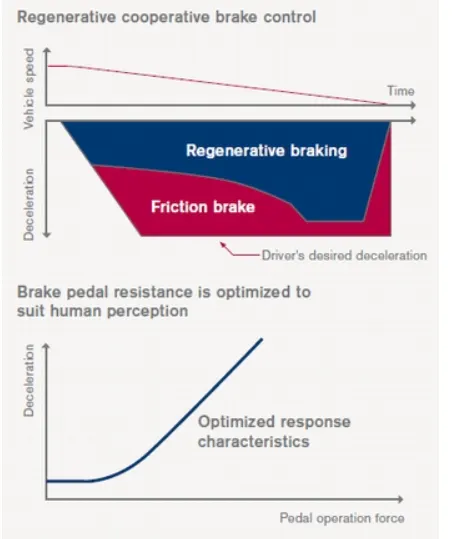
and Nissan has developed a practical brake strategy called ELECTRIC DRIVEN INTELLIGENT
brake developed by Nissan leaf.
technology functionality:
after stepping on the brake pedal ,the system produced natural and adequate braking force that corresponds to the operation .the amount of energy regeneration also needs to be increaseseed as much as possible .EDIB control the regenerative brake and friction brake to support both of these requirement .further it also controls the reactive force from the pedal in order to unity the feeling when stepping down on the pedal and the sense of deceleration.
3. MATLAB program .
clear all
close all
clc
x=1inspace (1,1000,250);%speed in red /sec
y=1inspace (1,250,250); % torque in NM
% motor loss constants
KC=0.2;%copper loss constant
Ki= 0.008;%Iron loss constant
KW=0.00001; %Windage loss contant
const loss =20; %constsnt motor loss
[X,Y] =mesh grid (X,Y); % converter to 2D
output power =(X,*Y) ; %power =torque X speed
B= (Y,^2)*Kc ;% copper loss
c=X.*Ki;%Iron loss
D= (X.^3)*KW;%windage loss
Input power =output power +B+C+D+const loss
Efficiency =output power ./Input power ;%Eff of the motor
V={0.70.0.80,0.90,91,0.925,0.93];% Efficiencies to box off
grid off
contourf (X,Y,Efficiency ,v);
contourcbar
title('speed torque efficiency characteristics of motor');
x label ('speed (rad/sec);
ylable ('torque (NM)');
program description
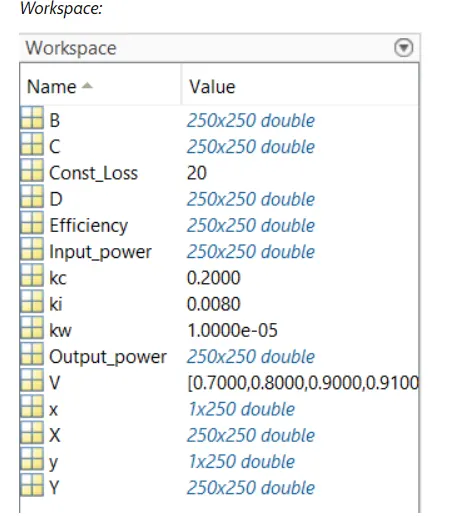
in this program first two inputs were give .they are speed & torque using linspace command
then the motor constant motor values are assigned namely copper loss iron loss winding loss and constant motor .
then mesh grid is used to evaluate function of two variable and three dimensional mesh /surface plots
output power is calculated by multiply ing speed and torque
then all loss were efficiency were calculated .and control graph is plotted between speed torque and efficiency
title were given and labels were given .
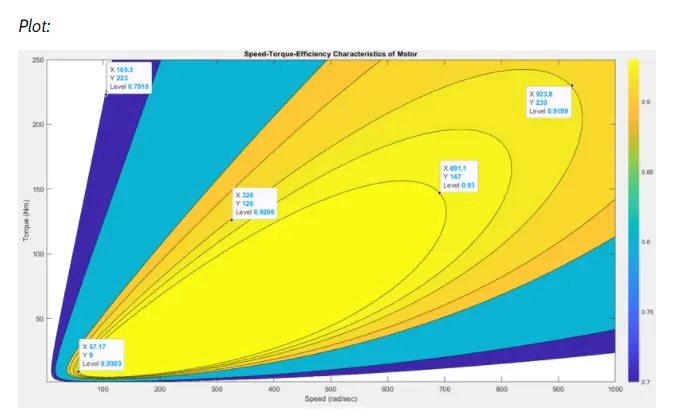
this clearly show that maximum efficiency of 93% is achieved 691.1rad/sec and at 147NM. the lowest efficiency is achieved at 223 rad/sec and at torque of 105.3Nm .and contour plot clearly given the ideal on speed ,torque and efficiency denoted in the right side with he colorbar.
.MATLAB fille
clear all
close all
clc

x=linspace(1,1000,250); %Speed in rad/sec
y=linspace(1,250,250); %Torque in Nm

%Motor loss constants
kc=0.2;  %Copper loss constant
ki=0.008;  %Iron loss constant
kw=0.00001;  %Windage loss constant
Const_Loss=20;  %Constant motor loss

[X,Y]=meshgrid(x,y); %Converting to 2D
Output_power=(X.*Y); %Power = Torque x Speed

B= (Y.^2)*kc; %Copper loss
C= X.*ki; %Iron loss
D= (X.^3)*kw; %Windage loss
Input_power = Output_power + B + C + D + Const_Loss;
Efficiency= Output_power./Input_power; %Eff of the motor
V = [0.70,0.80,0.90,0.91,0.92,0.925,0.93]; %Efficiencies to be plotted
box off
grid off
contourf(X,Y,Efficiency,V);
contourcbar
title('Speed-Torque-Efficiency Characteristics of Motor');
xlabel('Speed (rad/sec)');
ylabel('Torque (Nm)');
conclusion:
for a defined driving cycle, the energy required for braking is calculated .
why electric motor cant develop braking torque at high speed similar to starting and how electric and mechanical brakes are coordinates were discussed
a matlab program which plots contour of given motor speed torque and efficiency values is coded.