Week-11 Challenge: Braking
1. For a defined driving cycle, calculate the energy required for braking.
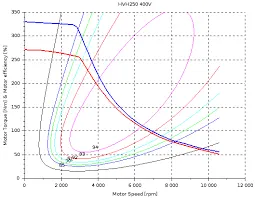
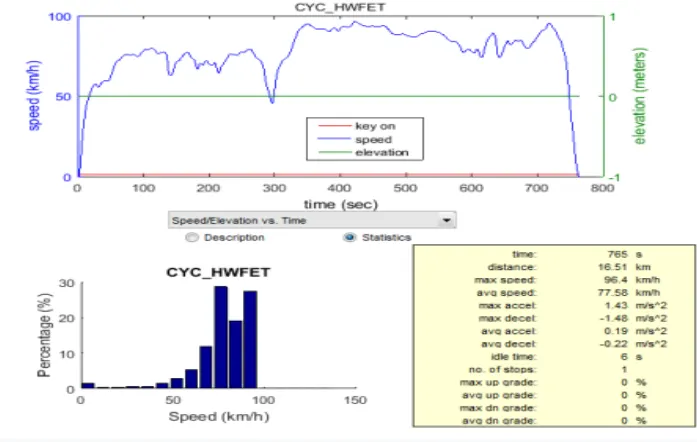
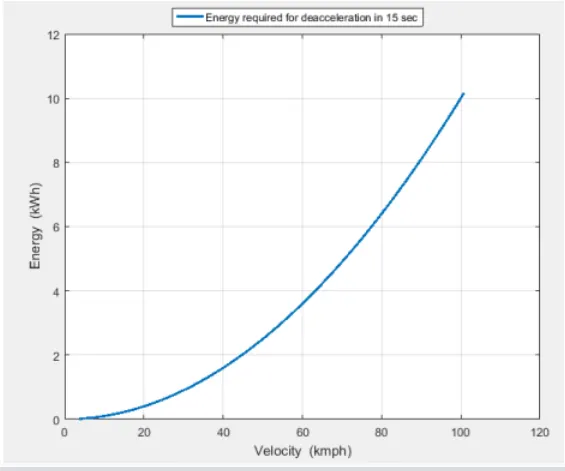
Here Advisor tool is used to get some standard datas like, vehicle mass, max.speed, motor characteristics, energy distrubution, and driving cycle. The vehicle used as Toyoto prius which has mass of 1196 kgs, the max speed of this vehicle is 96.4 kmph. The driving cycle used as HWFET (Highway Fuel Economy Test). Energy require d for deacceleration from 96.4 to 0 kmph is calculated by,
where,
m = Mass of the vehicle (kg)
Vi = max Speed (kmph)
Vf = min Speed (kmph)
E = Energy required (kJ)
PROGRAM:
clear all;
close all ;
clc;
% Mass of the vehicle
m = 1400;
% Time for deacceleration
t = 15;
% Final Speed, the vehicle in rest position
V_f = 0;
% Initial Speed, Top speed of the vehicle
V_i = [1:1:28];
% Energy calculation for deacceleration in kJ
E1 = 0.5 * (m/t) * (V_i - V_f).^2;
% Converting Speed in kmph
V = V_i * 3.6;
% Converting Energy to kWh
E = E1 * 2.777e-4;
% Plotting Energy required for deacceleration in 15 secs
plot(V,E,'LineWidth',2)
xlabel('Velocity (kmph)')
ylabel('Energy (kWh)')
legend('Energy required for deacceleration in 15 sec')
grid on
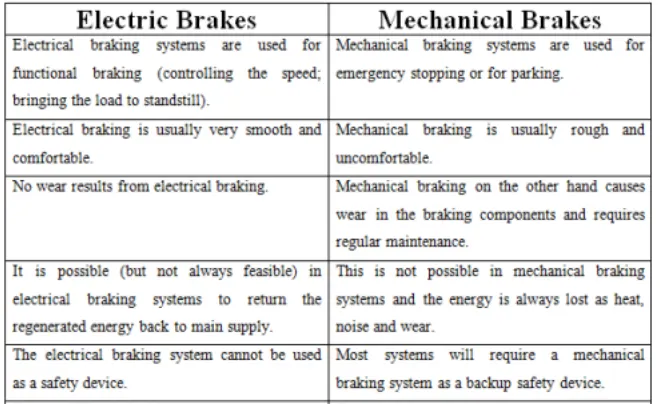
2. Why electric motor can’t develop braking torque at high speed similar to starting? How electric and mechanical brakes are coordinated?
Electric motor can’t develop braking torque at high speed similar to starting
This situation does not occur at the beginning of an acceleration because most of the torque is used to increase the kinetical energy of the load (and motor). But whe n the speed is already high and no extra load is applied it is not possible to increase the torque. Sometimes after accelerating you can't reach the maximum torque. Th e reason is that no matter how much the current loop wants to increase current (proportional to torque) by increasing the PWM duty cycle of the power stage, the Vm otor is too close to Vbemf and therefore current can't increase more. Which means, the back emf is more than the motor voltage it maintains constant power and decr eases the torque action.
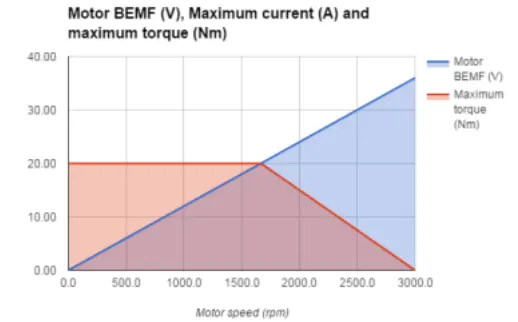
To prevent this,
Increase DC bus voltage.
Unlimit system acceleration.
Use a motor with less resistance and lower back EMF proportion.
3. Make a MATLAB program which plots contour of given motor speed, torque and efficiency values. Attach the code as a .m file attach a screenshot of all the plots
PROGRAM:
% A program for plotting efficiency contours for electric motors.
x=linspace(1,1000);% speed, N.B. rad/s NOT rpm
y=linspace(1,250); % 0 to 250 N.m
% Allocate motor loss constants.
kc=0.2; % For copper losses
ki=0.008; % For iron losses
kw=0.00001; % For windage losses
ConL=400; % For constant motor losses
% Now make mesh
[X,Y] = meshgrid(x,y)
Outputpower = (X.*Y); % Torque x speed = power
B=(Y.^2)*kc; % Copper losses
C=X*ki; % Iron losses
D=(X.^3)*kw; % Windage losses
Inputpower = Outputpower + B + C + D + ConL
Z = Outputpower./Inputpower
% We now set the efficiencies for which a contour will be plotted. V=[0.7,0.8,0.85,0.9,0.91,0.92,0.925,0.93];
box off
grid off
contour(X,Y,Z,V);
xlabel('Speed/rad.s^-^1'), ylabel('Torque/N.m');
hold on
% Now plot a contour of the power output
% The array Output Power has already been calculated. We draw contours % at 8 and 10 kW.
V=[8000,10000];
contour(X,Y,Outputpower,V);
OUTPUT:
STUDY 1:
STUDY 3: