Week-11 Challenge: Braking
Week-11 Challenge: Braking
Calculate the energy required for braking, for a defined driving cycle
We have taken a vehicle of 1000kg mass. For this vehicle the brake energy has to be calculated when it deaccelatate for 20 sec. to come to 0 speed from 108kmph.
- Traction on wheels = all Drag forces + braking forces.
- At every instant the braking power increases to some extent, therefore Braking energy increases by those factors.
- Cumulative energy is a significant percentage of total traction power.
Brake energy`= 0.5*mass*(Vi-Vf)^2`
Vi=initial velocity
Vf= final velocity
MATLAB script:-
clear all
close all
clc
% Given data
M = 1000; %vehicle mass kg
Vf = 0;  %vehicle final speed
Vi = [0:5:30]; %vehicle initial speed


Er=0.5*(M)*(Vi-Vf).^2; %Deacceleration Energy calculation(kJ)
V =Vi*3.6;%Speed in kmph
Er=Er*2.77e-4;%Energy in kwh

% Plotting Energy required for deacceleration in 15 secs
plot(V, Er,'linewidth',2)
xlabel('Velocity (kmph)')
ylabel('Brake Energy (kwh)')
legend('Deacceleration in 20 Seconds')
grid on
Result:-
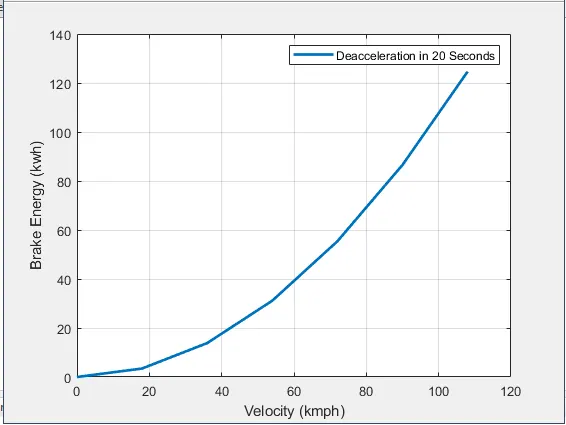
From this curve we can say that, the required brake energy in 20 seconds from above speed is 125kwh (approx).
2.
Why electric motor can’t develop braking torque at high speed similar to starting?
- During deacceleration the motor runs in constant power region which provides high speed and low torque to motor. This results in low deacceleration torque from motor while braking and high torque in acceleration due to constant torque operating region.
- Peak torque during acceleration is not equal to torque generated during deacceleration.
- The deacceleration torque is less then acceleration torque of motor as per motor speed torque characteristics
How electric and mechanical brakes are coordinated?
EV/HEV Braking is of 2 types:
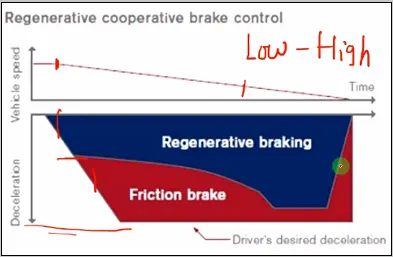
- Series: - In this system both regenerative and mechanical brakes are applied one after another.
- Parallel: - Combined or both regenerative and mechanical brakes are applied at one time
At high speed both brakes applied combined whereas, at lower speed we get higher braking torque or percentage sharing of regenerative brakes increases at lower speed.
The control signals go to regenerative system and from there to power converter.
Nissan Leaf braking
3.
Make a MATLAB program which plots contour of given motor speed, torque and efficiency values. Attach the code as a .m file attach a screenshot of all the plots
Contour: -
- A 3-d surface where, 3 parameters (motor speed, torque and motor efficiency ) plotted as a height.
- It is a line that has all the lines of same height.
Here we are plotting a contour plot of an induction motor having 300nm torque. We calculated the efficiency of motor by considering the input and output power of motor.
Several losses e.g. iron, copper, winding and motor losses are taken into consideration for input power calculation.
Code:-
%3-phase INDUCTION Motor
clear all
close all
clc

% rated speed(rpm)
w_r =linspace(0,1500);
% torque range
T=linspace(0,300);
%meshgrid
[w_r,T] =meshgrid(w_r,T);

%iron losses
L_i=0.006;
%copper losses
L_c=0.3;
%windage loss
L_w= 0.00005;
%motor loss
L_m= 15;

%iron losses
iron_L = L_i.*w_r ;
%copper losses
cu_L= L_c*(T.^2);
%winding losses
winding_L= (w_r.^3)*L_w;

 %MOTOR output power
 Motor_out= (w_r.*T);
 % Motor input power(kw)
 M_ip= iron_L+ cu_L+winding_L+L_m+Motor_out;

%MOTOR effeciency
M_e=(Motor_out./M_ip);

V=[0.5,0.55,0.6,0.65,0.7,0.75,0.8,0.85,0.9,0.95];
box off
grid off
contourf(w_r,T,M_e,V);
colorbar
xlabel('Motor speed RPM');
ylabel('TORQUE N-m');
zlabel('Efficiency');
title('Induction motor contour') 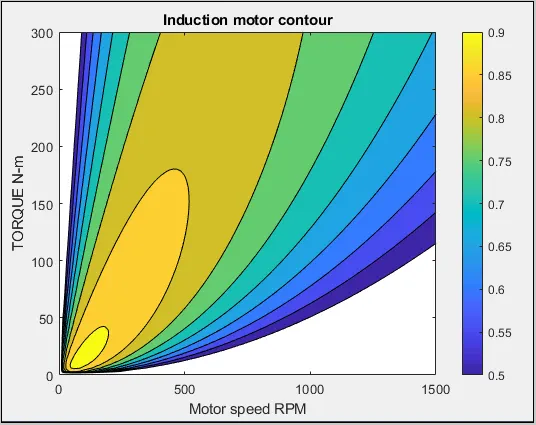
To read this plot we take help of the color bar at right side of it. That informs about the efficiency of motor based on the color shades and the number on this bar shows range of efficiency from 0.5 to 0.95.
The 0.95 efficiency can be seen in the 0 to 50 torque regions, which states that the efficiency is higher at low torque and speed. After that the efficiency decreases.