Week 11 Car Crash simulation

Introduction
In automobile design, crash and structural analysis are the two most important engineering processes in developing a high quality vehicle. Computer simulation technologies have greatly enhanced the safety, reliability, and comfort, environmental and manufacturing efficiency of today's automobiles. This significant achievement was realized with the advanced software and powerful computers that have been available in the last twenty years. The primary concern for drivers and passengers is safety. Governments have responded to this key concern and expectation with an increasing number of regulations. Although the details may vary slightly from country to country, the fundamental requirements are almost similar. A vehicle is expected to provide adequate protection to drivers and passengers in a not so serious accident. To protect the occupants of a car, there are many new tangible safety features such as airbags; ABS control brakes, traction International Journal of Engineering Research & Technology. A less tangible feature that cannot easily be seen by drivers and passengers is the crash response behavior. In a well designed automobile, the car body and various components are the protective layer for the occupants of the vehicle. They serve as the crumpling zone to absorb the energy of impact. The traditional approach involves multiple iterations of design, prototype and crash tests. The process is time consuming and expensive. The availability of high performance computers and crash simulation software has revolutionized the process. Instead of relying on experimental validations, the safety design process is supplemented with computer simulation to evaluate the design. Since the inception of crash simulation, the product cycle of a new automobile has been reduced by half and the resultant vehicle is safer, better and more comfortable.
CRASHWORTHINESS TESTS CRITERIA AND MODEL REQUIREMENT
In the automotive industry, crashworthiness connotes a measure of the vehicle's structural ability to plastically deform and yet maintain a sufficient survival space for its occupants in crashes involving reasonable deceleration loads. Restraint systems and occupant packaging can provide additional protection to reduce severe injuries and fatalities. Crashworthiness evaluation is ascertained by a combination of tests and analytical methods. Currently vehicle crashworthiness is evaluated in four distinct modes:
- Frontal
- Side
- Rear
- Rollover crashes
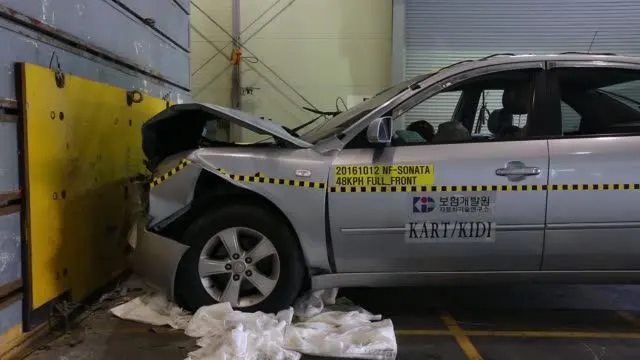
Frontal Crash:
_________________________________________________________________________________________________________
Analysis:
Vehicle crash is a highly nonlinear transient dynamics phenomenon. The purpose of a crash analysis is to see how the car will behave in a frontal or sideways collision. Crashworthiness simulation is one typical area of application of Finite-Element Analysis (FEA). This is an area in which non-linear Finite Element simulations are particularly effective.
Frontal or Bumper portion of the car is very important for crash safety in any car.
So, here we will see the Frontal Crash Analysis for the Car body.
We will perform the Analysis of the Car for the Frontal Crash for different thickness of the shell body of the Car.
We will do it with help of parametric study for the Thickness as a Input parameter and the solutions as Output parameters.
Different Cases based on the thickness of the Car Body will be as given below:
CASE_1: Thickness 0.3 mm
CASE_2: Thickness 2 mm
CASE_3: Thickness 5 mm
_________________________________________________________________________________________________________
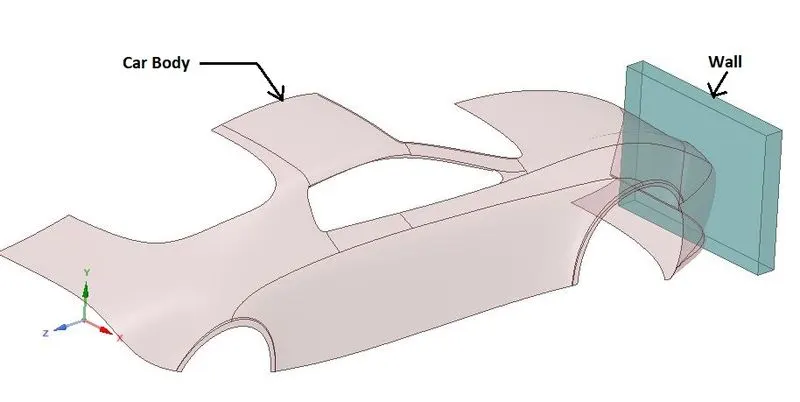
Geometry & Material Specifications:
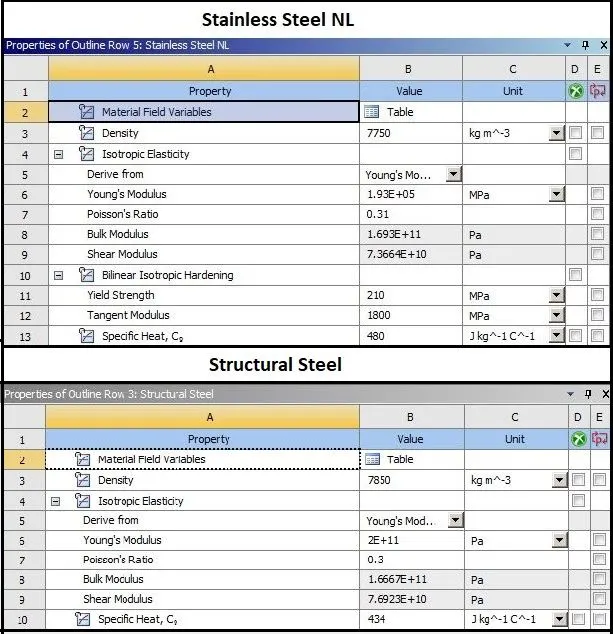
Material:
_________________________________________________________________________________________________________
Mesh:
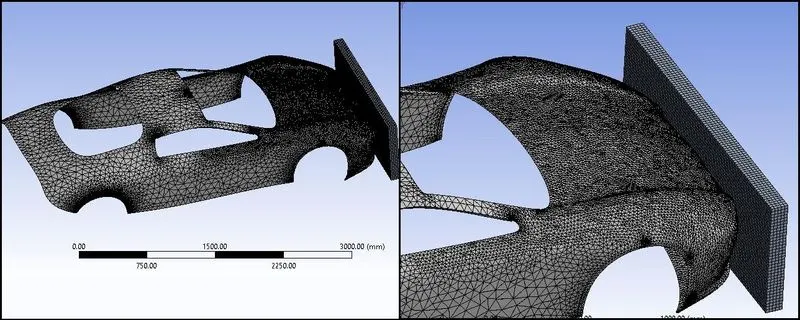
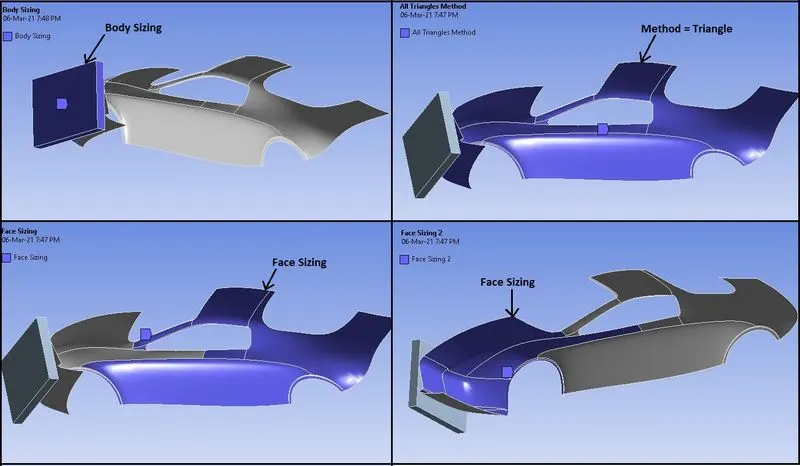
Mesh Details:
Meshing parameters for Tension as well as Torsion test are as given below:
- Patch Conforming Method: Car Body
- Method: Triangles
- Face Sizing: Car Body Rear faces
- Element Size: 80 mm
- Face Sizing: Car Body Front Faces
- Element Size: 20 mm
- Body Sizing: Wall
- Element Size: 20 mm
- Quality: Smoothing = Low
- Statistics:
- No.of Nodes: 19645
- No.of Elements: 26068
_________________________________________________________________________________________________________
Procedure:
- Import model in Explicit Dynamics in Geometry section.
- Then go to Mechanical model section.
- Check or Rename the Part of the setup as “Car Body” & “Wall” as shown in above geometry image.
Symmetry:
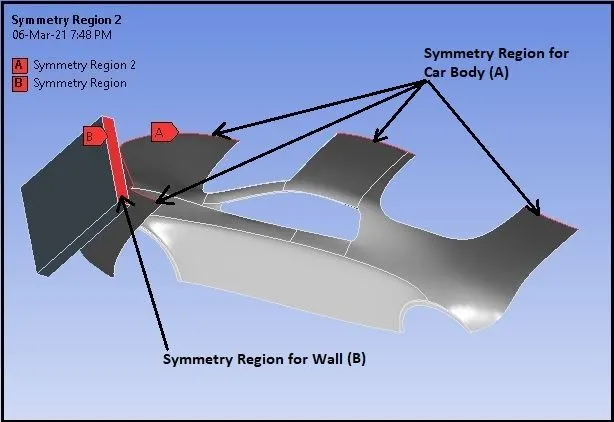
- As shown in above image, Create Symmetry Region for side edges of the faces of the Car Body which are symmetric in Plane and give Symmetry Normal to Global X—Axis.
- Also Create Symmetry Region for side face of the Wall which is symmetric in Plane and give Symmetry Normal to Global X—Axis.
Boundary Conditions:
- After meshing as described above, create Boundary Conditions as given below:
Analysis Settings:
- No.of Steps: 1
- End Time: 0.001 s
- Maximum Number of Cycles:1e+07
- Maximum Energy Error: 5
- Initial Time Step: Program Controlled
- Minimum Time Step: Program Controlled
- Maximum Time Step: Program Controlled
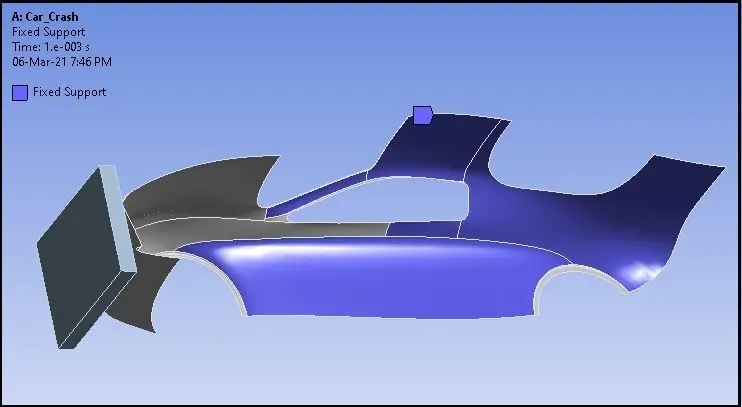
Fix Support (For CASE_1, 2, & 3):
- Keep Rear faces of the Car Body as a fixed to hold it while the Wall is impacting on the Frontal portion of the Car Body.
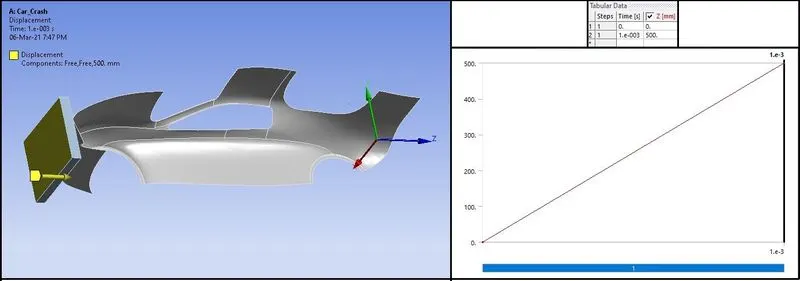
Displacement (For CASE_1, 2, & 3):
- Apply Displacement to the Rear face of the Wall in the positive Z-Direction as given below:
Solution:
- After giving proper boundary conditions, create desired solutions for output results.
- Create Solutions for :
- Total Deformation
- Equivalent Stress
Parametric Study:
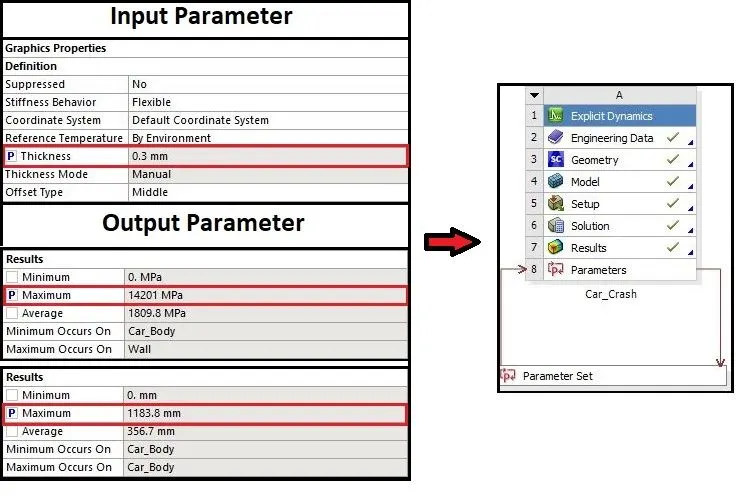
For Parametric study of the Cash behavior of the Car Body on different thickness, assign parameter to the following parameters for Input as well as Output.
Input Parameter: Thickness
Output Parameter = Total Deformation & Max. Equivalent Stress
_________________________________________________________________________________________________________
Results:
Now we will see all the results for CASE_1, CASE_2 & CASE_3.
On updating all the Design Points, we can get all the Output results in Parameter set as given below:
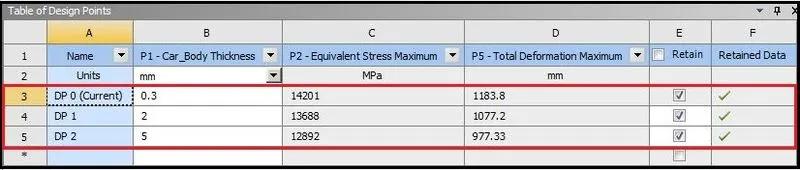
- By giving “Set as Current”, we can see all the results in details as given below:
CASE_1 (Thickness = 0.3 mm)
Stress Contours:
Stress Plot & Data:
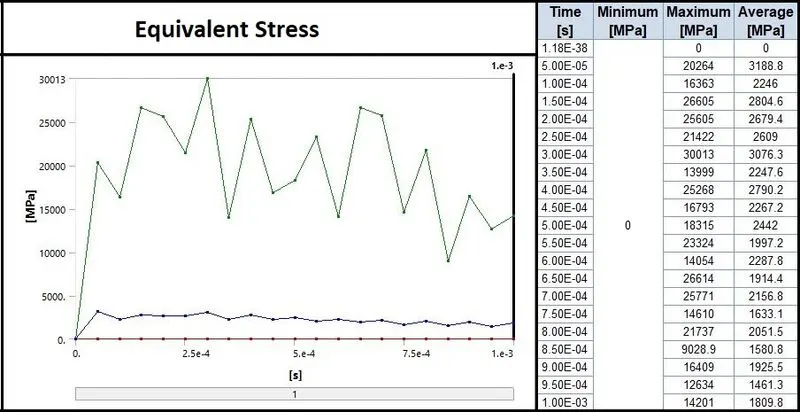
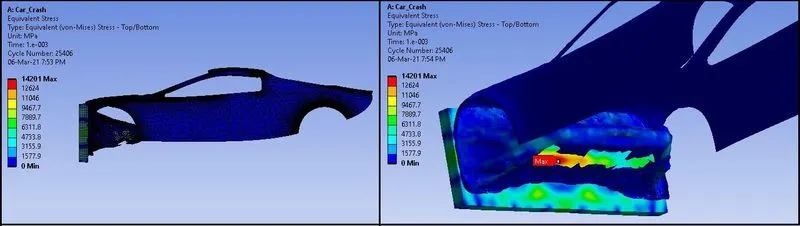
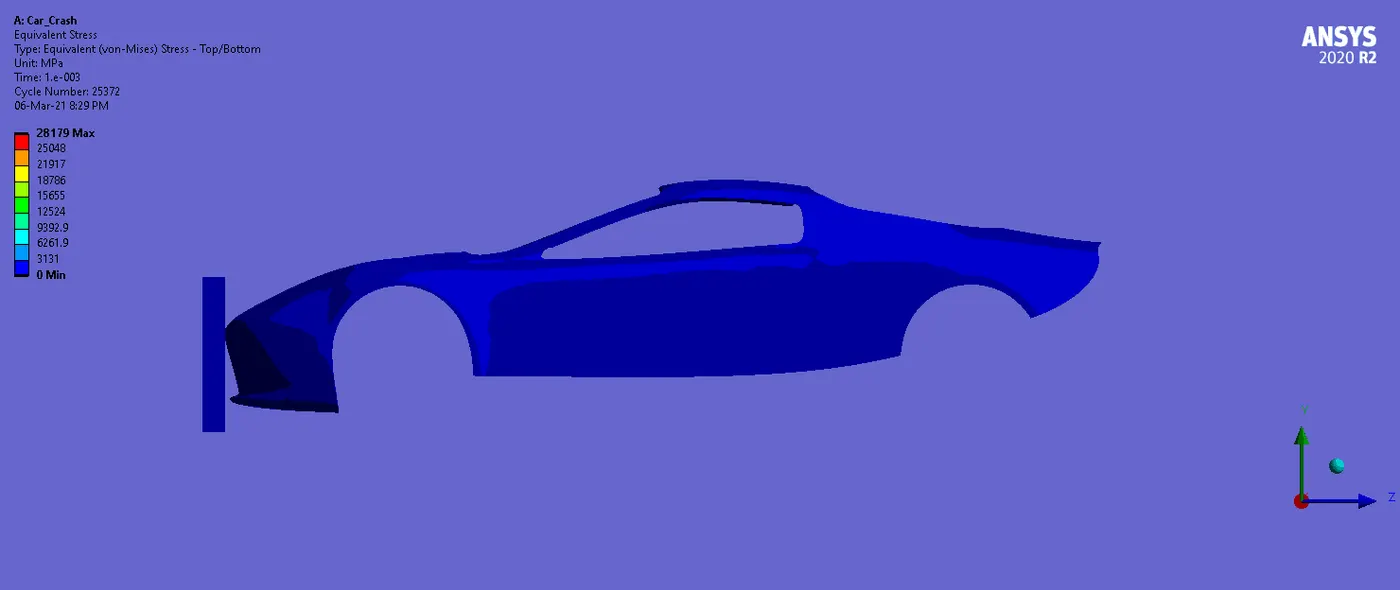
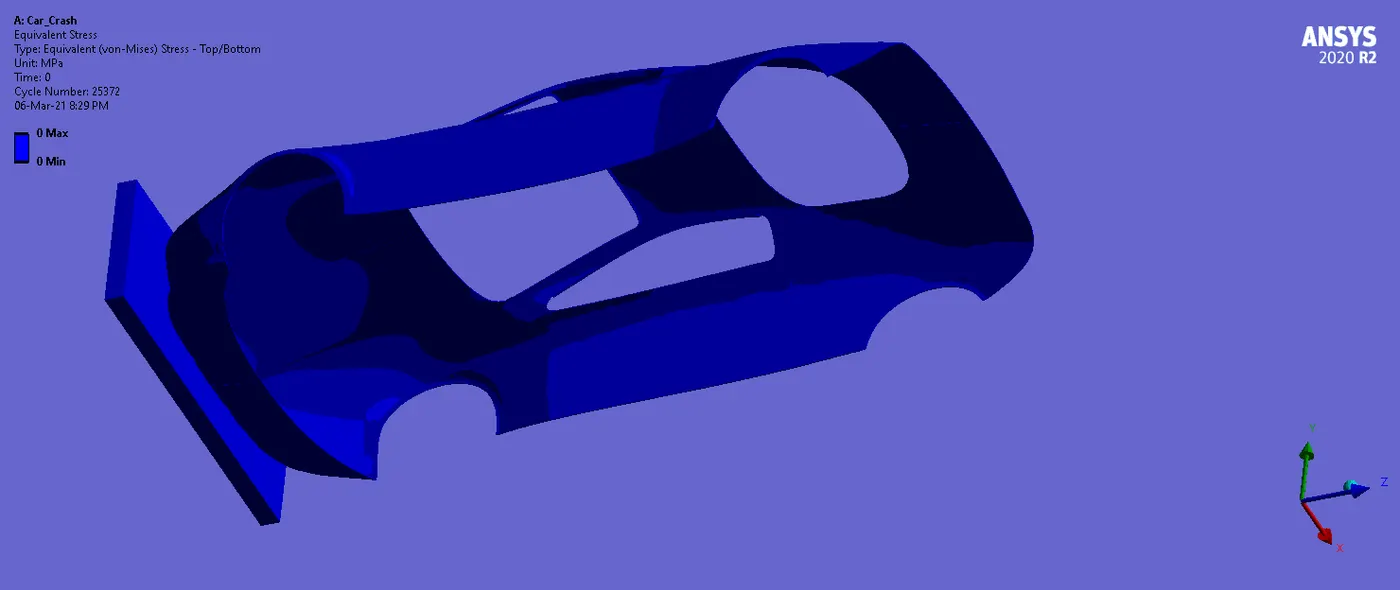
- Here maximum stress is 14201 Mpa.
- Due to collision of the Car Body to the Wall, we can see the maximum stress is occurring at the Wall.
Total Deformation Contours:
Total Deformation Plot & Data:
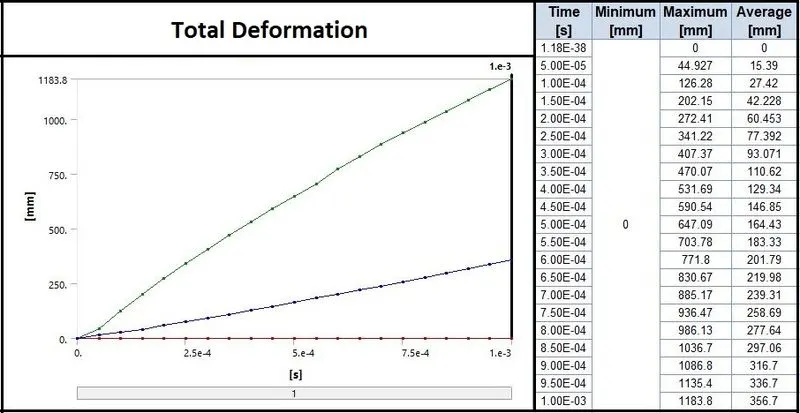
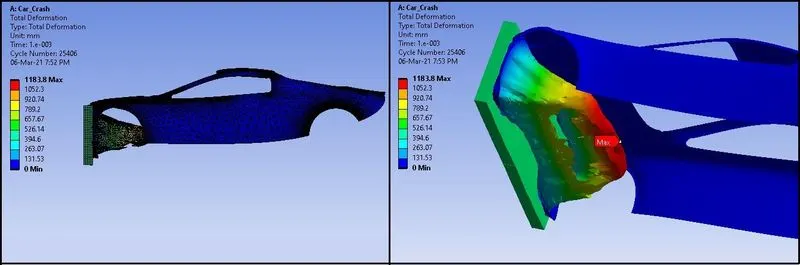
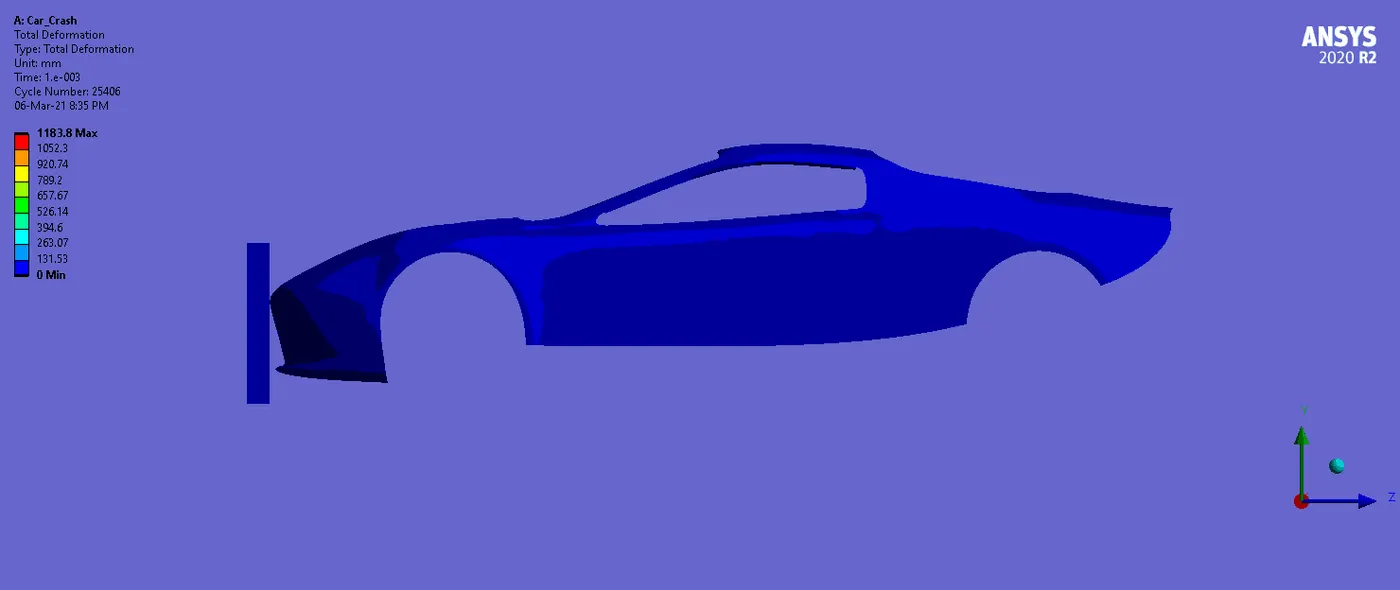
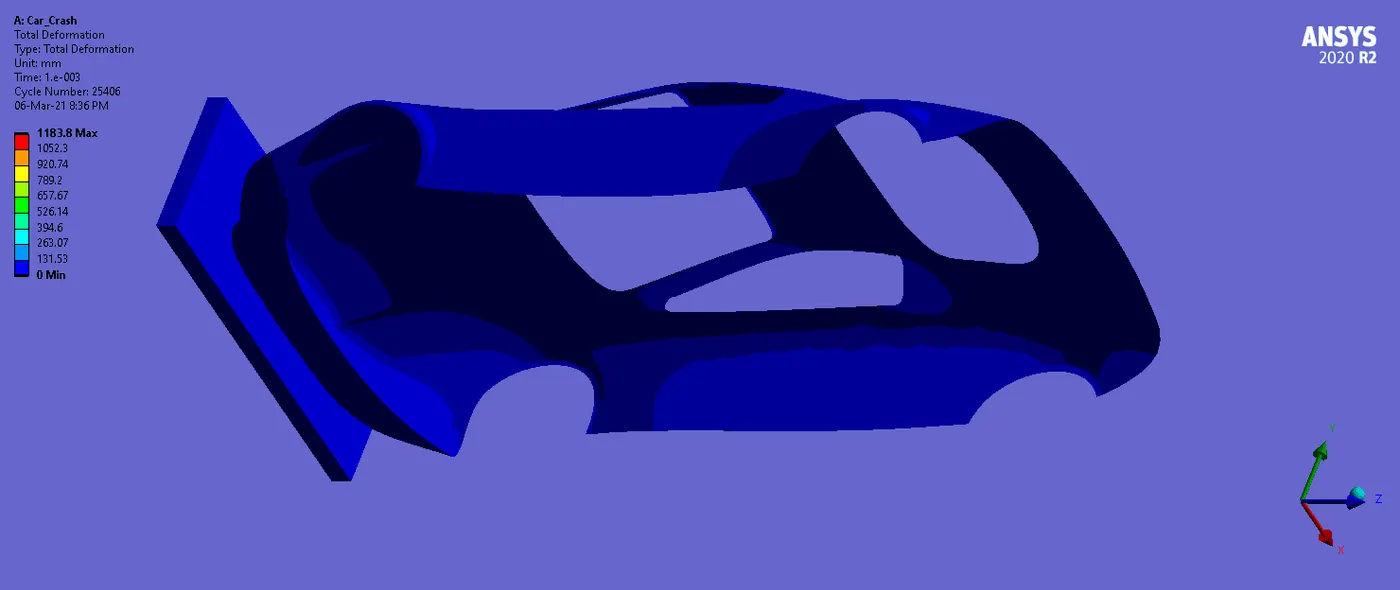
- Here the Maximum deformation is 1183.8 mm.
- We Though we have given the displacement to the Wall up to 500 mm, we can see the deformation is occurring up to 1183 mm.
- Due to collision, bumper portion is experiencing the maximum deformation; this is because it is in the initial contact to the Wall.
- Due to impact of the Wall, frontal portion is facing the plastic deformation an we can observe the tearing of the frontal surface due to deformation.
_ _ _ _ _ _ _ _ _ _ _ _ _ _ _ _ _ _ _ _ _ _ _ _ _ _ _ _ _ _ _ _ _ _ _ _ _ _ _ _ _ _ _ _ _ _ _ _ _ _ _ _ _ _ _ _ _ _ _ _ _ _ _ _ _ _ _ _ _ _ _ _ _ _ _
CASE_2 (Thickness = 2 mm)
Stress Contours:
Stress Plot & Data:
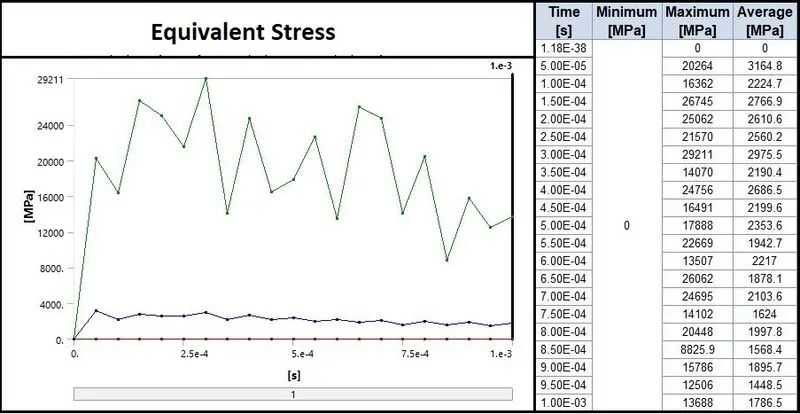
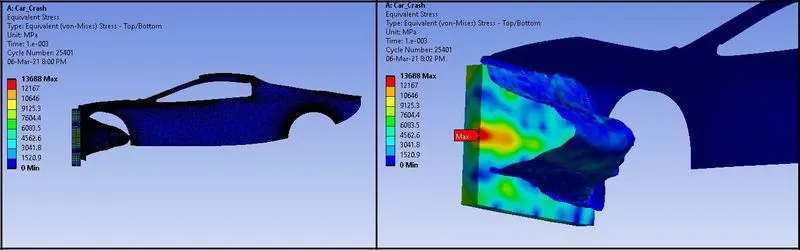
- Here maximum stress is 13688 Mpa.
- Due to collision of the Car Body to the Wall, we can see the maximum stress is occurring at the Wall.
- Here, the thickness of the Car Body is increased up to 2 mm, so the location of the maximum stress is different but also on the Wall.
Total Deformation Contours:
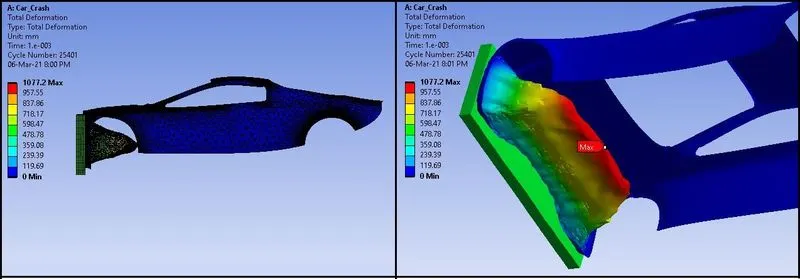
Total Deformation Plot & Data:
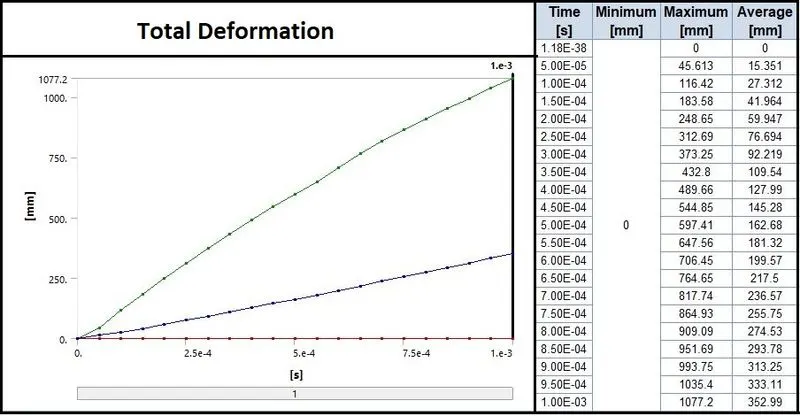
- Here the Maximum deformation is 1077.2 mm.
- Due to impact of the Wall, frontal portion is facing the plastic deformation.
- So, we can observe the maximum deformation is occurring on frontal portion of the Car Body.
_ _ _ _ _ _ _ _ _ _ _ _ _ _ _ _ _ _ _ _ _ _ _ _ _ _ _ _ _ _ _ _ _ _ _ _ _ _ _ _ _ _ _ _ _ _ _ _ _ _ _ _ _ _ _ _ _ _ _ _ _ _ _ _ _ _ _ _ _ _ _ _ _ _ _
CASE_3 (Thickness = 5 mm)
Stress Contours:
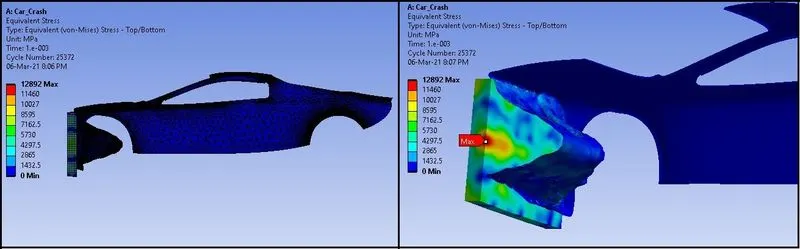
Stress Plot & Data:
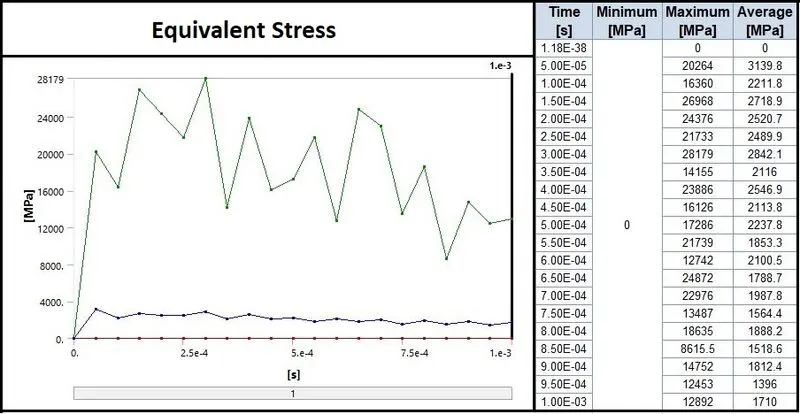
- Here maximum stress is 12892 Mpa.
- Due to collision of the Car Body to the Wall, we can see the maximum stress is occurring at the Wall.
- Here, the thickness of the Car Body is increased up to 5 mm, so the location of the maximum stress is different but also on the Wall.
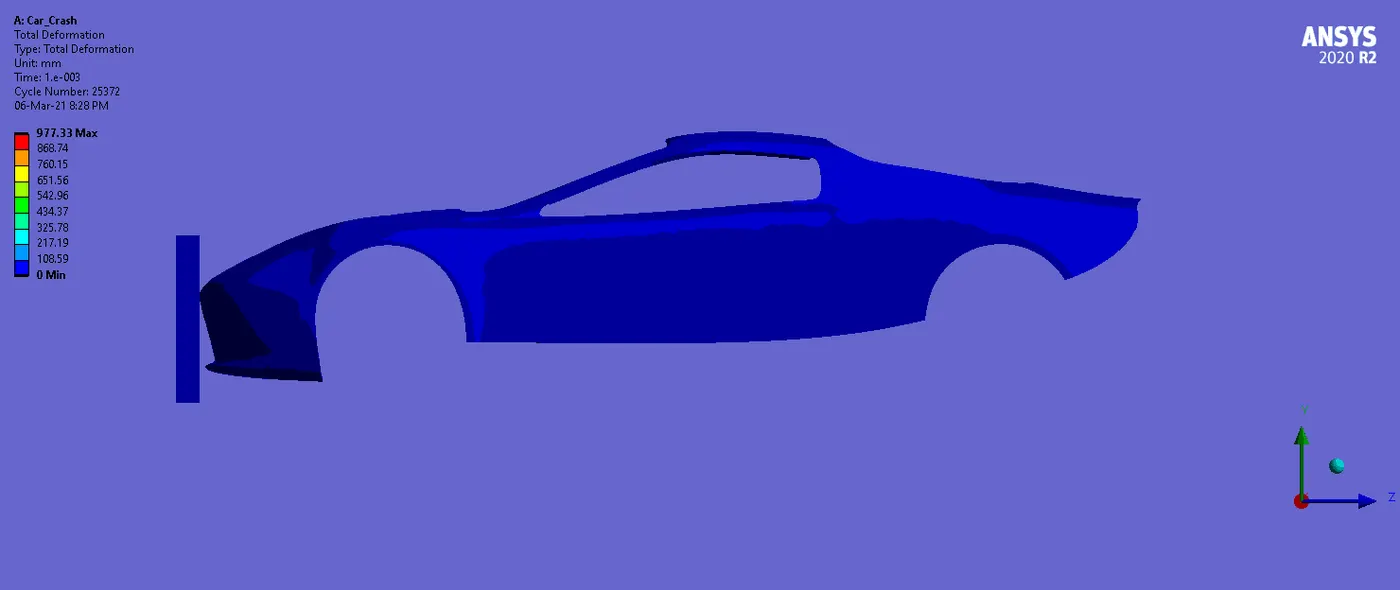
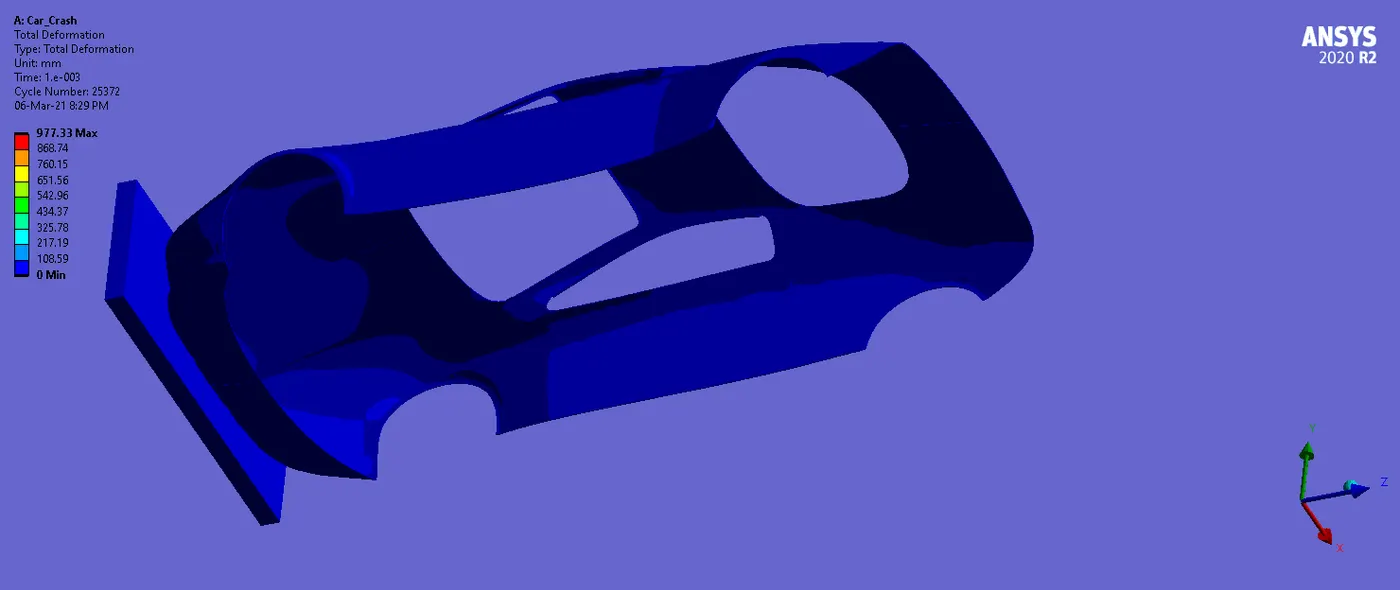
Total Deformation Contours:
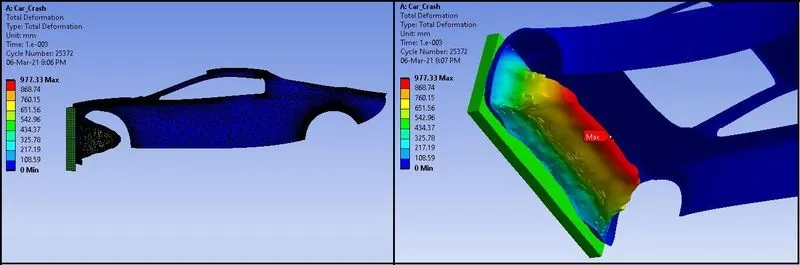
Total Deformation Plot & Data:
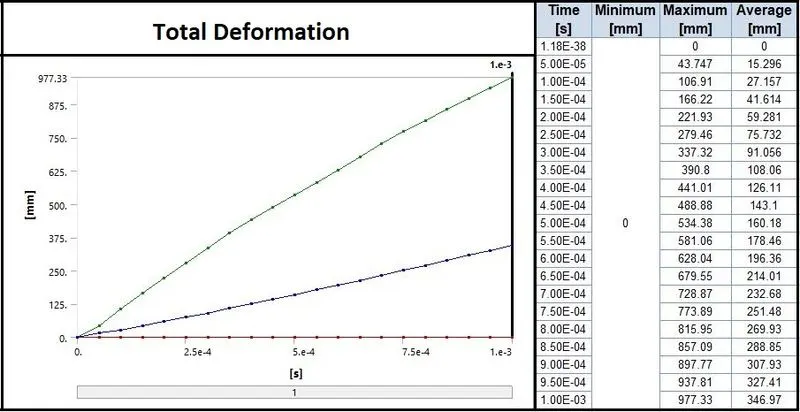
- Here the Maximum deformation is 977.33 mm.
- Due to impact of the Wall, frontal portion is facing the plastic deformation.
- So, we can observe the maximum deformation is occurring on frontal portion of the Car Body.
________________________________________________________________________________________________________
Comparison:

- On comparison of the three cases, we can see the stress is high for the CASE_1, where the thickness of the Car Body is 0.3 mm.
- Also the deformation is high for 0.3 mm thickness, because it can deform easily.
- In CASE_2, where the thickness is 2 mm, stress and deformation decreases compare to CASE_1.
- Lowest stress and deformation is resulting in CASE_3, where the thickness is 5 mm, because it can resist more to the load or given displacement.
_________________________________________________________________________________________________________
Conclusion:
- From the above results we can conclude that the stress and deformation is decreasing as increase in thickness of the Car Body.
- With 0.3 mm thickness, the Car Body will be very light in weight, and can accelerate high, so all the energy will be dissipated to the Car Body and the damage will also be high.
- With 5 mm thickness, it will be little rigid. So it will not dissipate more energy and the energy will be transferred to whole Car Body, which is also not good.
- With thickness of 2 mm, the Car Body will not be so rigid and also not accelerate more, so energy absorption will be optimized.
- So 2 mm thickness is preferred for the Car Body for good Crash Safety results.
- Further study can be taken with different material properties for frontal impact with the same thickness to verify effect of material yield, plasticity on force carrying capacity, energy absorption and acceleration levels.
_________________________________________________________________________________________________________
References:
- Crash test - Wikipedia
- IRJET-V3I12247.pdf
- Crash Analysis Of Car Chassis Frame Using Finite Element Method (ijert.org)
- Effect Thickness of Frontal Member in Frontal Crash (ijsrp.org)
- pdf (arcjournals.org)
- (PDF) Simulation of Vehicular Frontal Crash-Test (researchgate.net)
- Simulation of Car Bumper Material using Finite Element Analysis (scialert.net)
- ImpactAnalysisOfBumperAndCarChassisFrameDueToFrontalCollisionForDifferentMaterials(131-135).pdf (ijemr.net)
_________________________________________________________________________________________________________
Animations:
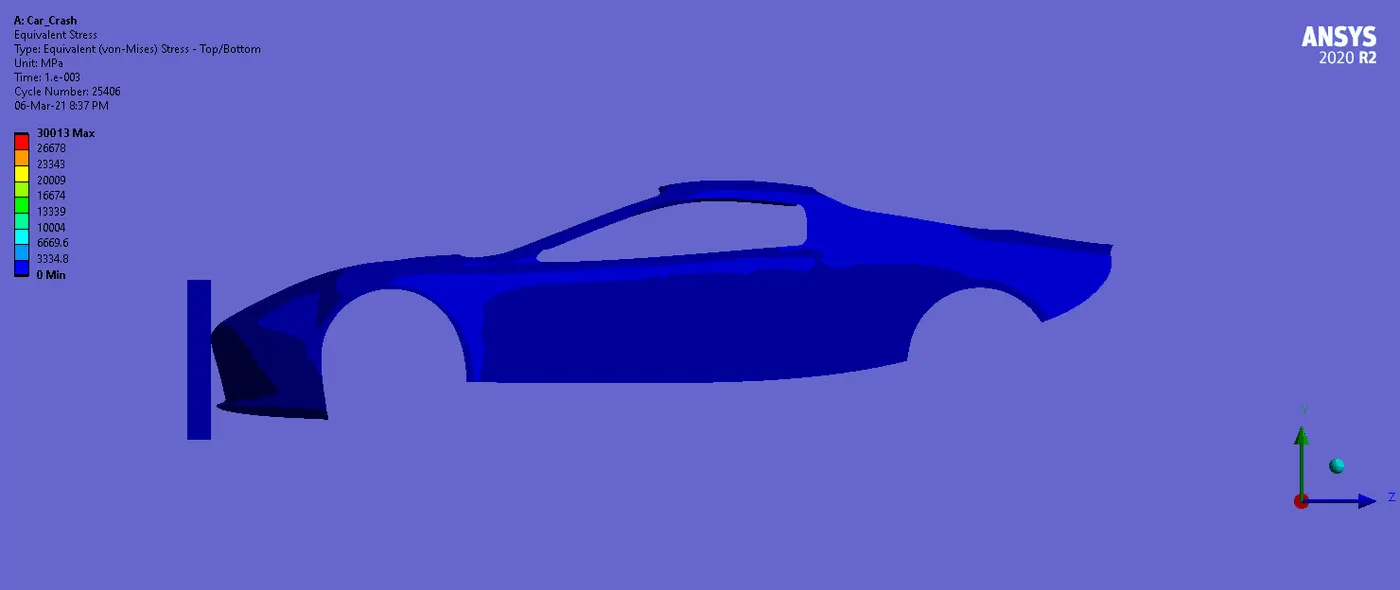
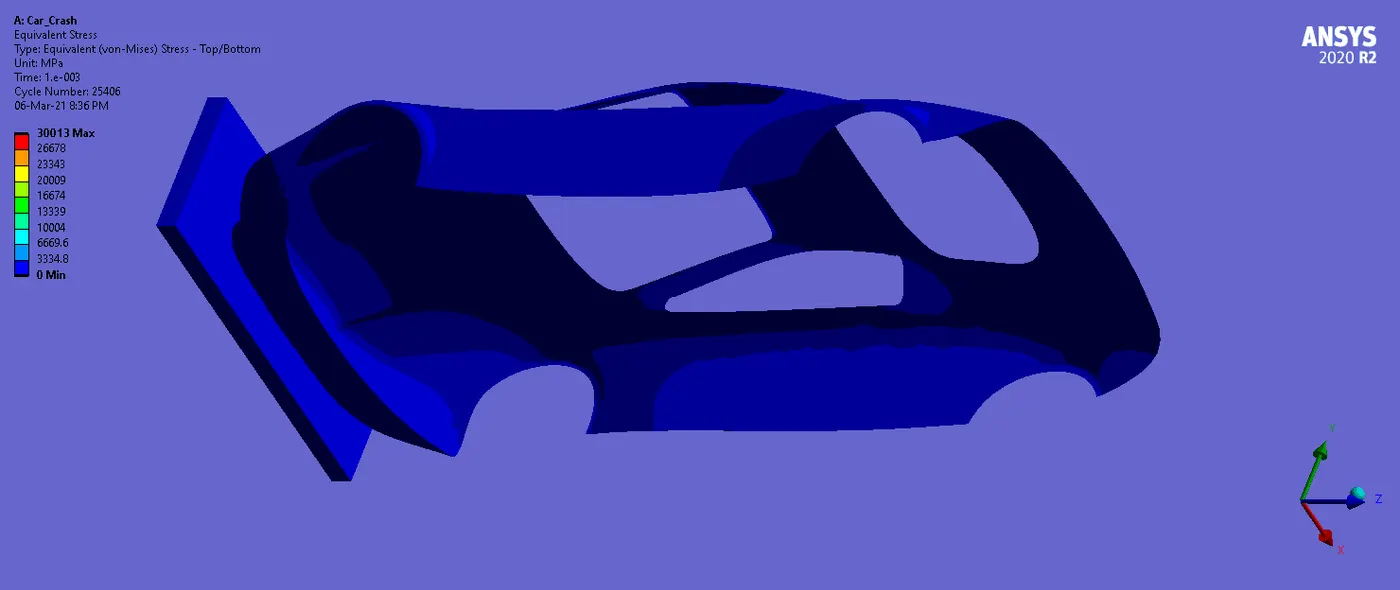
Here the animations for Stress and Total Deformations regarding CASE_1 ( THICKNESS = 0.3 MM) & CASE_2 (THICKNESS = 5 MM) are given as below:
CASE_1: (Thickness = 0.3 mm)
Stress:
Total Deformation:
_ _ _ _ _ _ _ _ _ _ _ _ _ _ _ _ _ _ _ _ _ _ _ _ _ _ _ _ _ _ _ _ _ _ _ _ _ _ _ _ _ _ _ _ _ _ _ _ _ _ _ _ _ _ _ _ _ _ _ _ _ _ _ _ _ _ _ _ _ _ _ _ _ _ _
CASE_3: (Thickness = 5 mm)
Stress:
Total Deformation:
_________________________________________________________________________________________________________
Thanks & Regards,
Dharmesh Joshi