Week 10 - Simulating Combustion of Natural Gas.
SIMULATING OF COMBUSTION GAS
Aim
- Using the combustor model, run a combustion simulation. Plot the variation in the mass fractions of the various species in the simulation using line probes at various positions along the combustor.
- Make contour plots for CO2, H2O, CH4, N2, O2, NOx emission, and Soot Formation as well.
- Examine the impact of adding water to the fuel on NOx and SO2 production at the output.
- Increase the water content of the fuel by a mole from 5% to 30% and assess the effect on the outcomes.
- Finally, plot the line graphs and contour charts to see how the change has occurred.
Introduction
Combustion is a chemical reaction that occurs between a fuel and an oxidant (typically oxygen) that produces heat, light, and various combustion products such as carbon dioxide, water vapor, and other compounds depending on the fuel and conditions of the reaction.
The reaction can be represented by a chemical equation that shows the reactants and products involved. For example, the combustion of methane (natural gas) can be represented by the equation:
CH4 + 2O2 -> CO2 + 2H2O + heat
This equation shows that one molecule of methane reacts with two molecules of oxygen to produce one molecule of carbon dioxide and two molecules of water, along with the release of heat.
Combustion is an important process for many practical applications, such as generating energy in power plants and transportation engines, as well as for heating and cooking in households. However, combustion also produces pollutants such as carbon monoxide, nitrogen oxides, and particulate matter that can have negative effects on human health and the environment. Therefore, efforts are made to minimize the emissions of these pollutants through various technologies and regulations.
CHEMICAL KINETICS
Chemical kinetics is the branch of chemistry that studies the rates of chemical reactions as well as the factors that influence those rates. It entails quantitatively describing the reaction mechanisms and determining the reaction rates. Chemical kinetics is the study of the concentrations of reactants and products as a function of time using experimental techniques such as reaction calorimetry, spectroscopy, and chromatography. The experimental results can then be analyzed using mathematical models to gain information about the reaction mechanism and rate constants.
CHEMICAL REACTION MODEL
A mathematical representation of a chemical reaction that describes the kinetics and thermodynamics of the reaction is known as a chemical reaction model. It can be used to anticipate reaction behavior under various situations and to optimize reaction parameters including temperature, pressure, and reactant concentrations. Chemical reaction models are often comprised of a collection of differential equations that explain the rates of change of reactant and product concentrations over time.
The reaction mechanism, which is the sequence of elementary reactions that occur during the overall reaction, provides the basis for these equations. The mechanism of the reaction describes the stoichiometry of each elementary reaction as well as the rate constant for each step. The rate constants can be obtained empirically or calculated using structurally based theoretical models.
REACTION RATE MODELS:
- Laminar finite rate model
- Eddy dissipation model
MASS FRACTION:
Mass fraction is a way of expressing the relative amount of a component in a mixture or solution in terms of its mass. It is defined as the mass of the component divided by the total mass of the mixture, expressed as a percentage or a decimal.
For example, if a solution contains 10 grams of salt dissolved in 90 grams of water, the mass fraction of salt would be:
Mass of salt = 10 grams Total mass of solution = 10 grams + 90 grams = 100 grams
Mass fraction of salt = (10 grams / 100 grams) x 100% = 10%
So, the mass fraction of salt in the solution is 10%.
Mass fraction is commonly used in chemistry and other fields where mixtures or solutions are analyzed. It is a useful way of expressing the composition of a mixture because it is independent of the size of the sample or the units used to measure it. In addition to mass fraction, other ways of expressing the composition of mixtures include mole fraction, volume fraction, and weight fraction.
NITROGEN OXIDE EMISSION
NOx emissions are a type of air pollution caused by the combustion of fuels such as coal, oil, and natural gas in industrial processes and transportation. Nitrogen oxide (NO) and nitrogen dioxide (NO2) are the two most common nitrogen oxides. NOx emissions are harmful to both human health and the environment. They help to create ground-level ozone, which can cause respiratory difficulties, as well as acid rain, which can harm crops, forests, and aquatic habitats. NOx emissions also contribute to particulate matter production and global warming.
SOOT FORMATION
Soot is a sort of particulate matter produced by the incomplete combustion of carbon-containing fuels like diesel, petrol, and coal. It is made up of microscopic, black carbon particles that are hazardous to both human health and the environment. Soot production is a complex process that is influenced by several factors, including fuel composition, combustion conditions, and the presence of catalysts or inhibitors.
The heat breakdown of the fuel, which releases unstable free radicals, is the first step in the production of soot. These radicals combine and with the fuel molecules to generate larger, more complex hydrocarbon molecules. As the temperature of the reaction zone rises, these molecules pyrolyze and produce smaller hydrocarbons, including polycyclic aromatic hydrocarbons (PAHs), which are harmful to the environment.
Geometry
The fluent was configured in Ansys workbench. In the space claim of geometry in fluent, the 3D model is imported and converted to a 2D model using tools such as combine and cut, as illustrated in the figures below.
 |
 |
 |
 |
Meshing
The converted 2d model is imported to meshing and initially the model is meshed with default mode. Then the model is mesh of finer size. Here I used 1mm mesh element size. Then the model is named like axis, Air inlet, Fuel Inlet, walls and Outlet
|
Fuel Inlet
|
Air Inlet
|
|
|
Axis
|
Walls
|
|
|
Outlet
|
Fine Mesh 1mm
|
|
 |
||
 |
||
|
Element Quality
|
Statistics
|
|
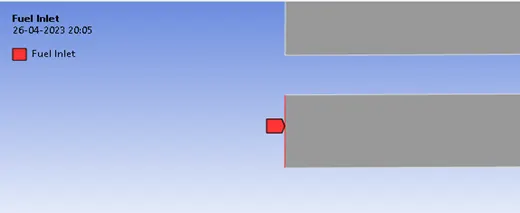
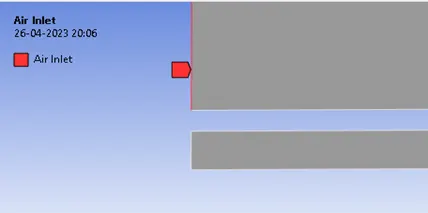
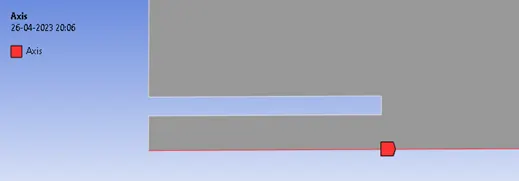
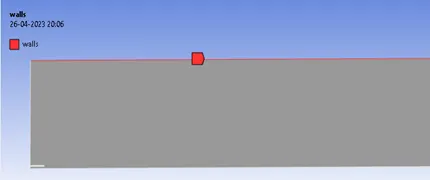
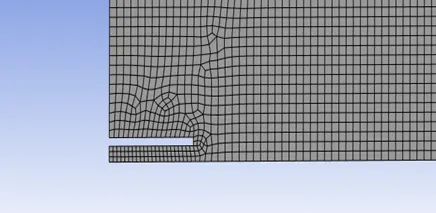
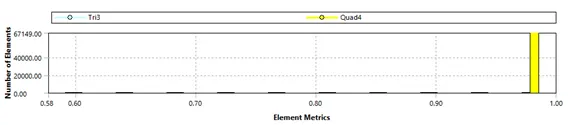
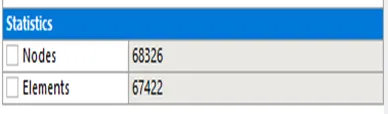
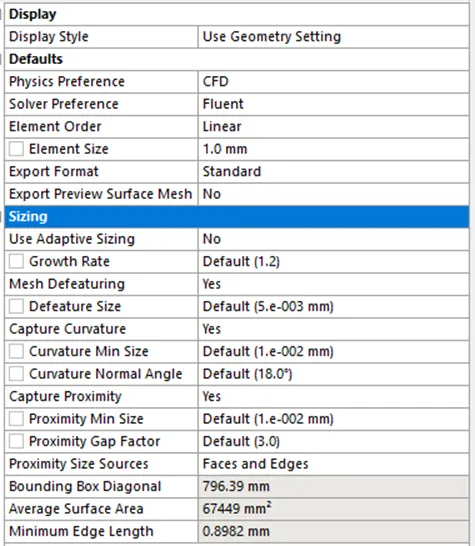 The model is meshed by quad mesh and the curvature is captured. Total elements were 67422 and nodes of 68326.
Set-up
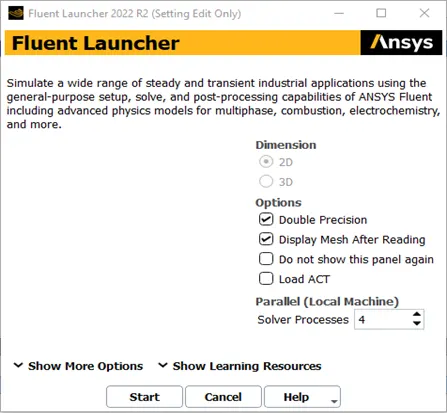
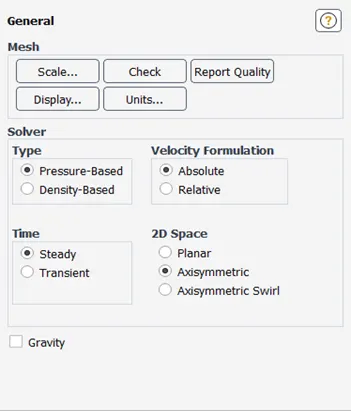
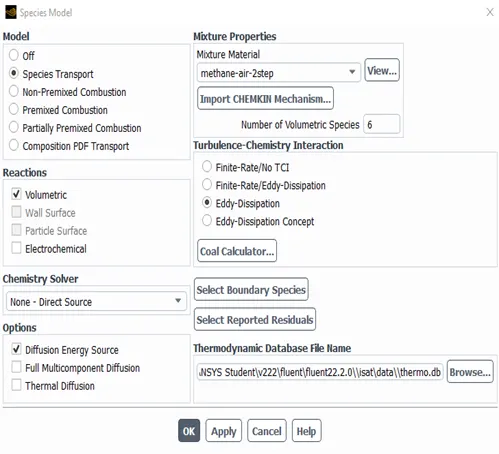
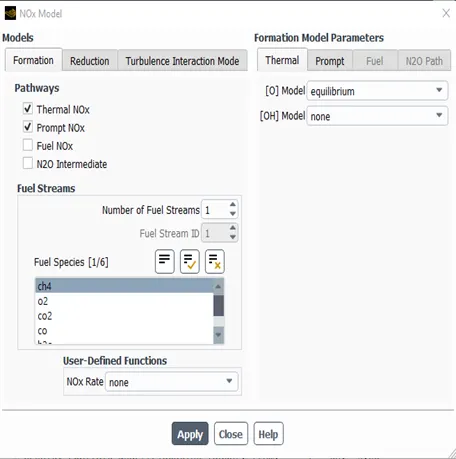
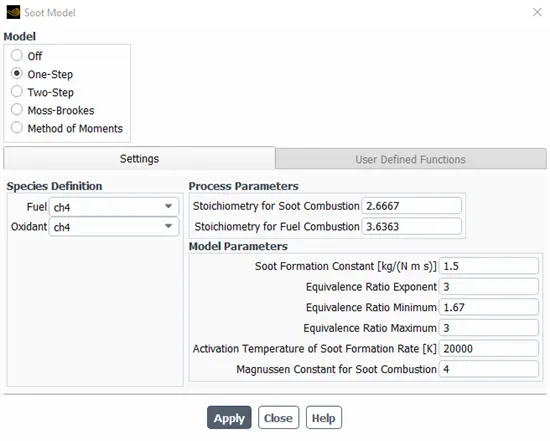
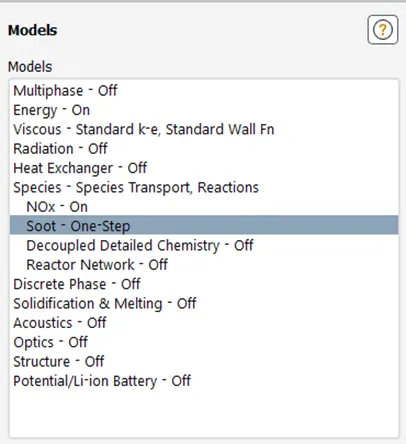
The model is set up by pressure-based, steady state, axisymmetric boundary conditions. The species model is switched on with Methane -air 2-step mixture material, volumetric reaction, and Eddy dissipation with Turbulent chemistry interaction. To find out other NOx pollutants and soot formation in simulation that model was turned on in more model option in fluent setup.
Viscous model
Model- K epsilon- standard-standard wall function
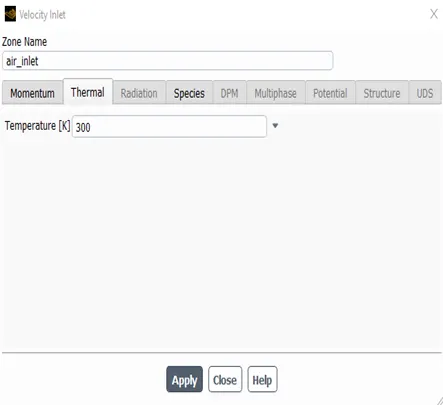
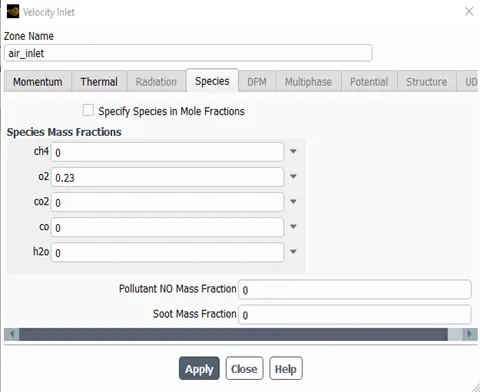
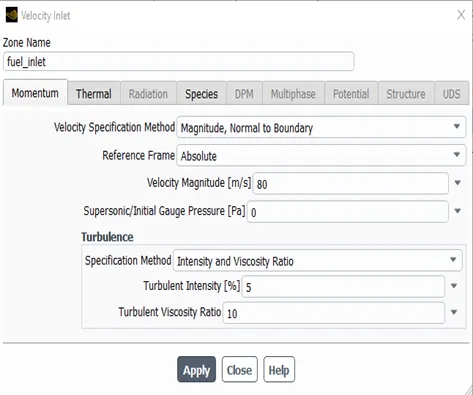
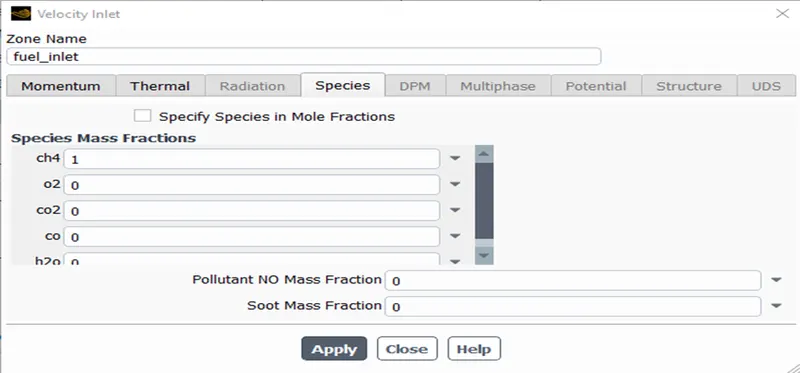
Boundary condition
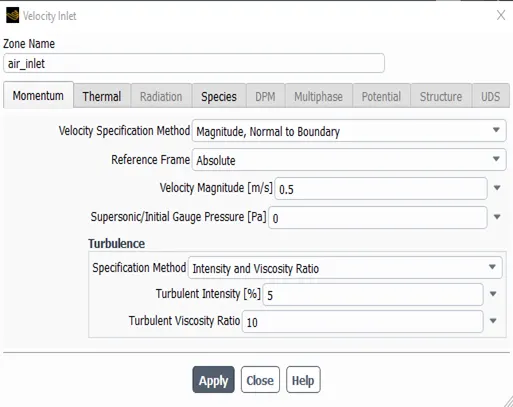
Air inlet-velocity inlet Fuel inlet-velocity inlet
Velocity=0.5 m/s Velocity=80 m/s
Temperature=300k Temperature=300k
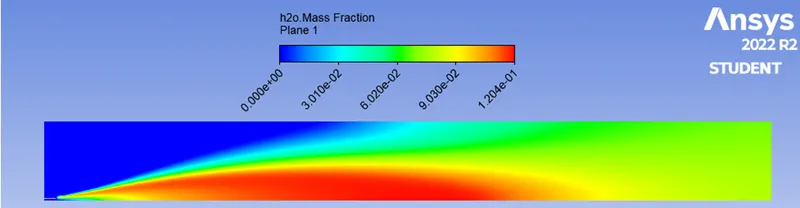
Case 1: Species mass fraction O2=0.23 Species mass fraction CH4=1, H2O=0
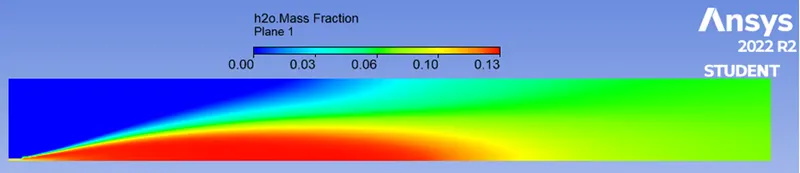
Case 2: Species mole fraction O2=0.21 Species mole fraction CH4=0.9, H2O=0.1
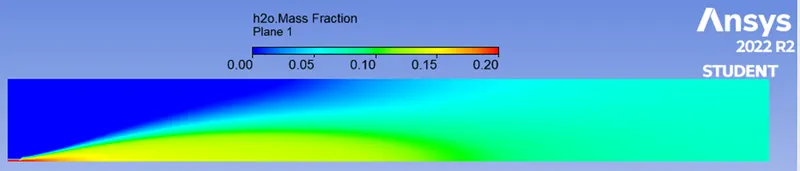
Case 3: Species mole fraction O2=0.21 Species mole fraction CH4=0.8, H2O=0.2
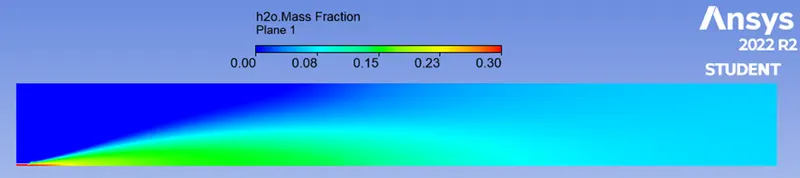
Case 4: Species mole fraction O2=0.21 Species mole fraction CH4=0.7, H2O=0.3
Case1 case 2
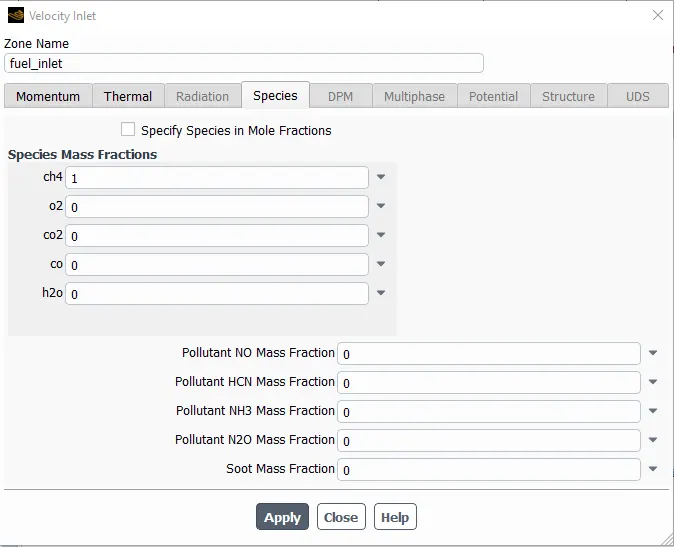
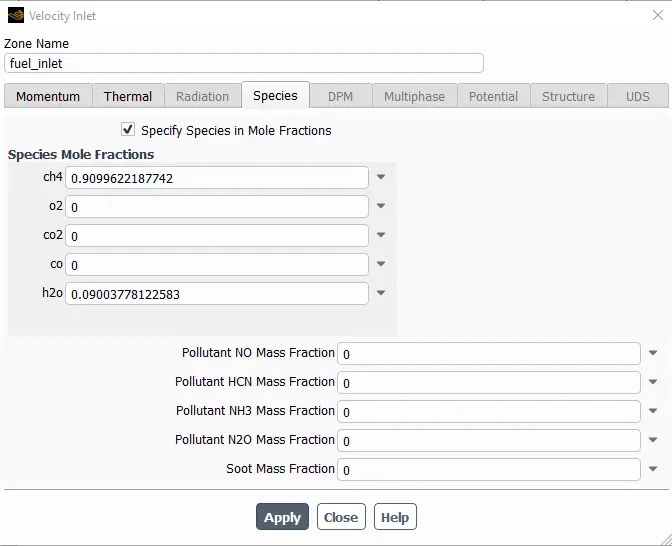
Case 3 Case 4
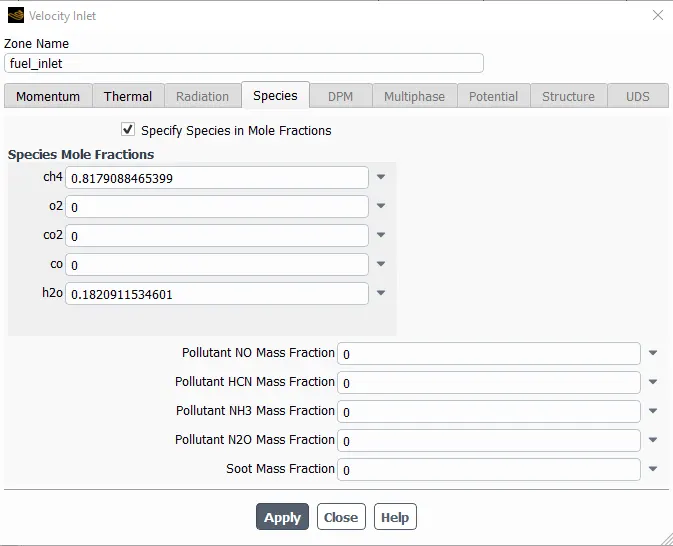
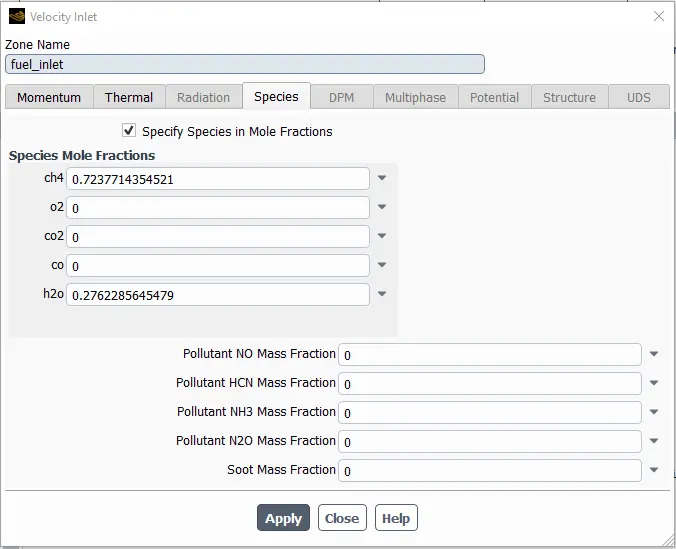
Results
|
0 % of H2O Addition
|
|
10 % of H2O Addition
|
|
20 % of H2O Addition
|
|
30 % of H2O Addition
|
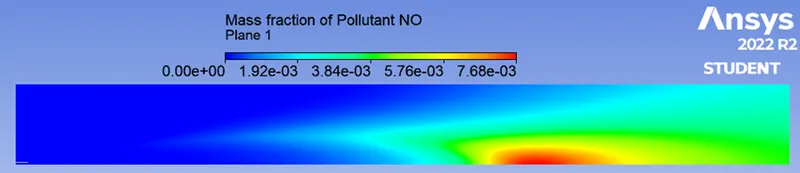
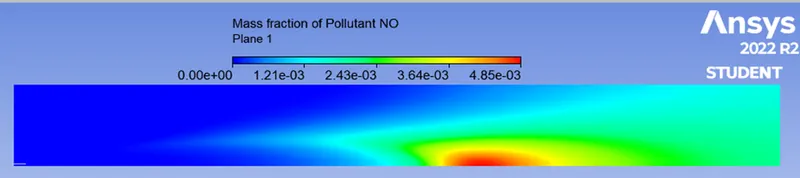
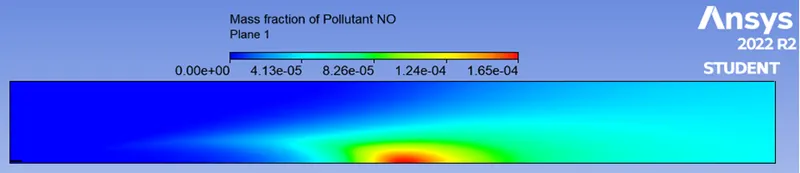
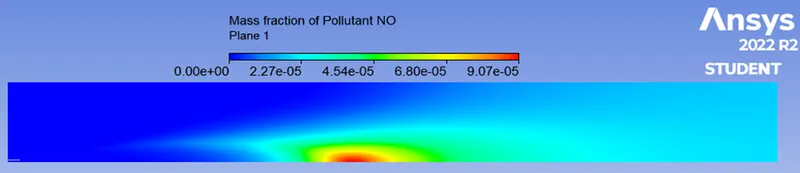
Mass Fraction of pollutant NO
|
0 % of H2O Addition
|
|
10 % of H2O Addition
|
|
20 % of H2O Addition
|
|
30 % of H2O Addition
|
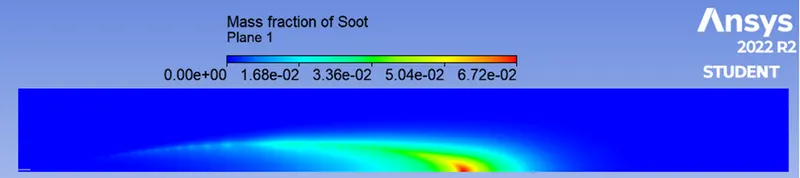
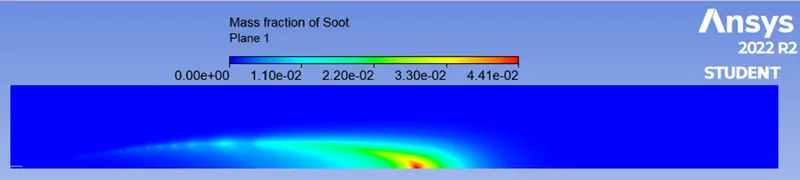
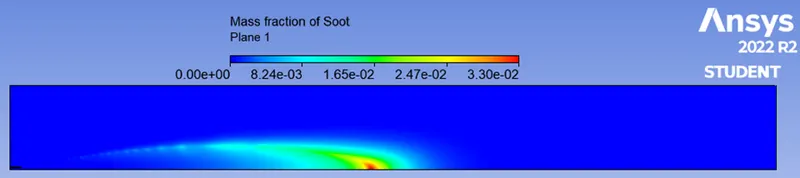
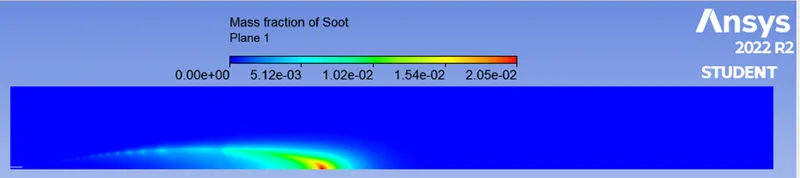
Mass Fraction of pollutant Soot
|
0 % of H2O Addition
|
|
10 % of H2O Addition
|
|
20 % of H2O Addition
|
|
30 % of H2O Addition
|
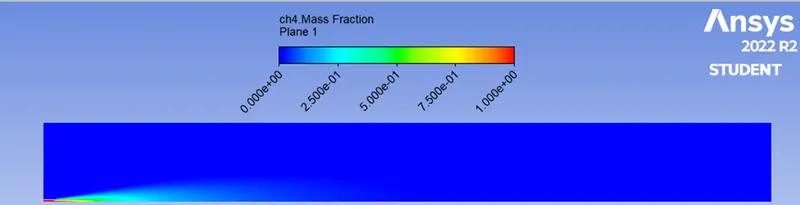
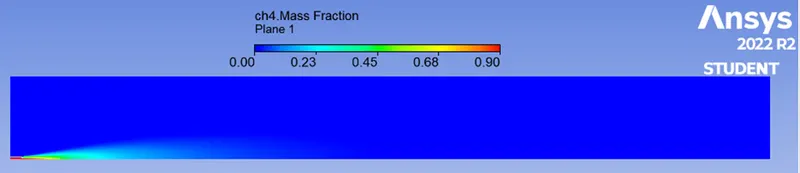
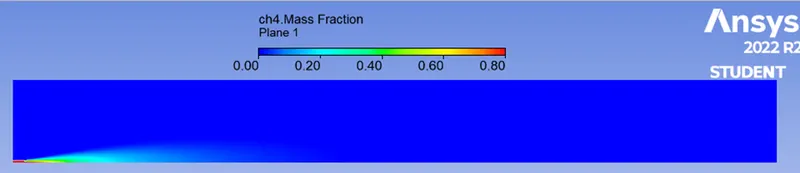
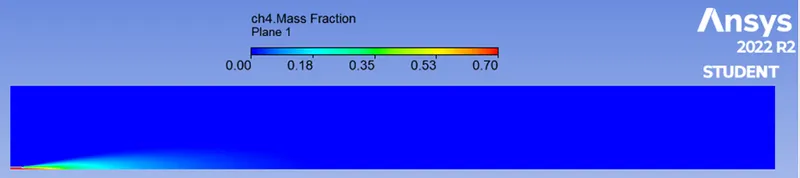
CH4 Mass Fraction
|
0 % of H2O Addition
|
|
10 % of H2O Addition
|
|
20 % of H2O Addition
|
|
30 % of H2O Addition
|
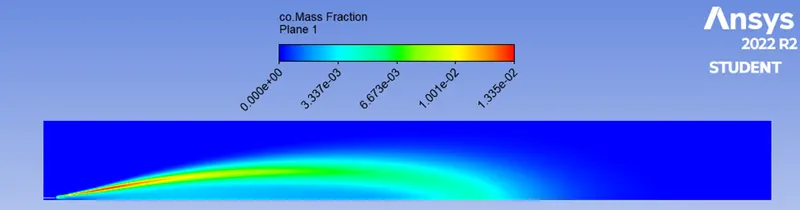
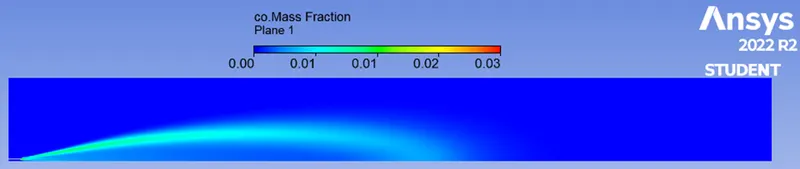
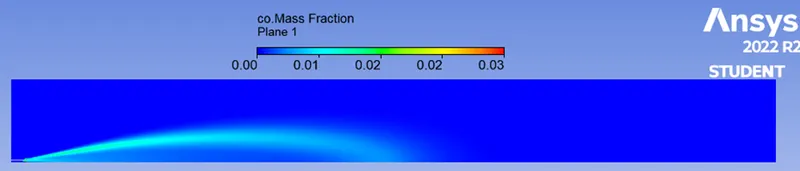
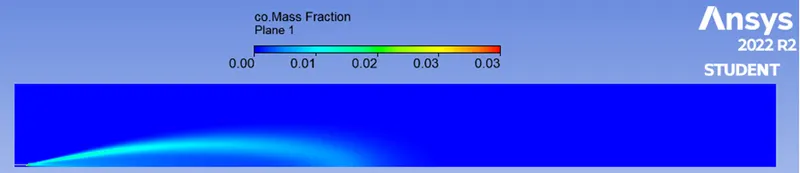
CO Mass Fraction
|
0 % of H2O Addition
|
|
10 % of H2O Addition
|
|
20 % of H2O Addition
|
|
30 % of H2O Addition
|
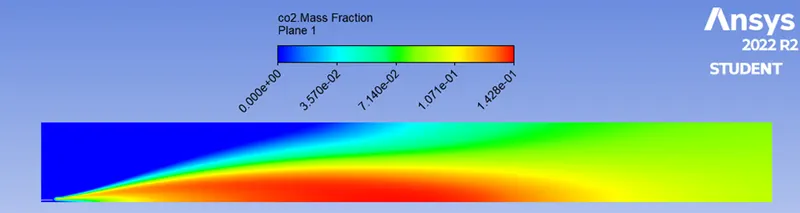
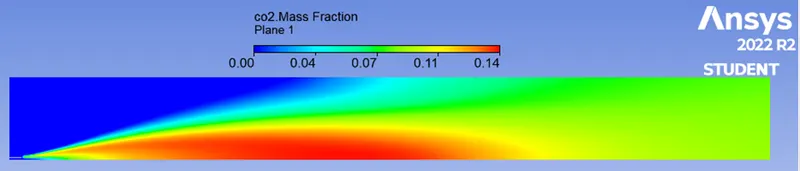
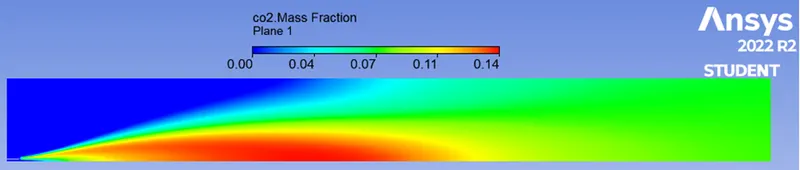
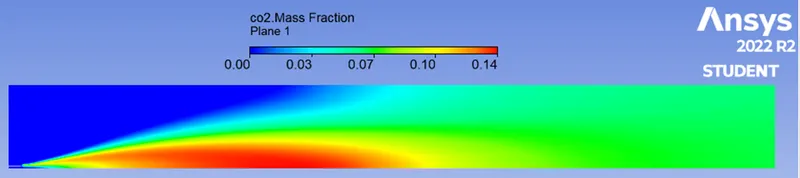
CO2 Mass Fraction
|
0 % of H2O Addition
|
|
10 % of H2O Addition
|
|
20 % of H2O Addition
|
|
30 % of H2O Addition
|
H2O Mass Fraction
|
0 % of H2O Addition
|
|
10 % of H2O Addition
|
|
20 % of H2O Addition
|
|
30 % of H2O Addition
|
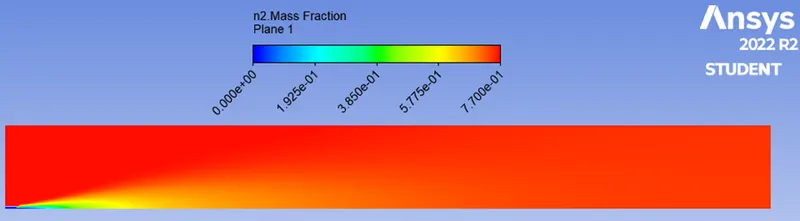
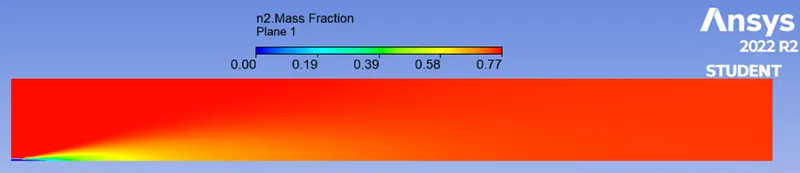
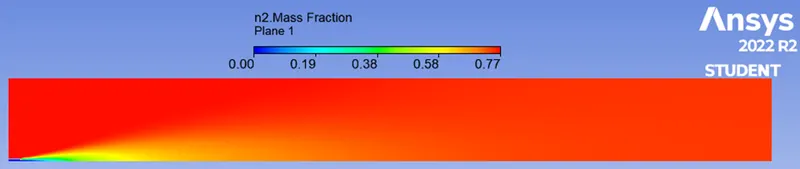
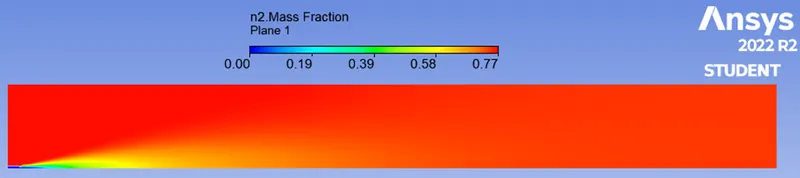
N2 Mass Fraction
|
0 % of H2O Addition
|
|
10 % of H2O Addition
|
|
20 % of H2O Addition
|
|
30 % of H2O Addition
|
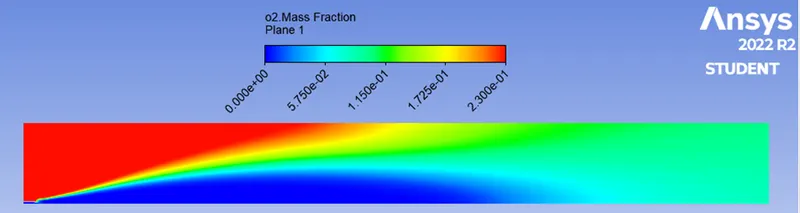
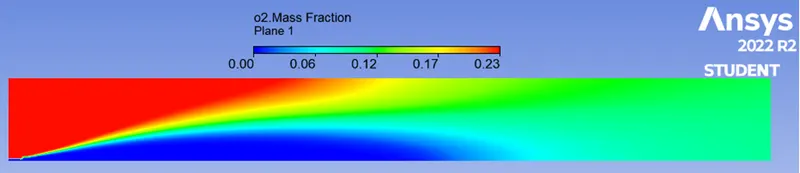
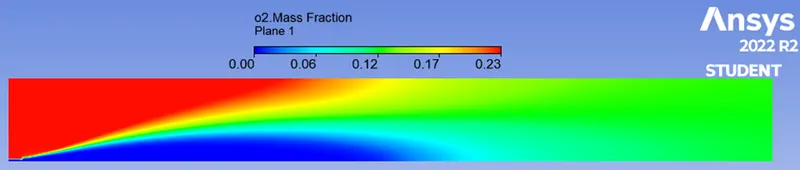
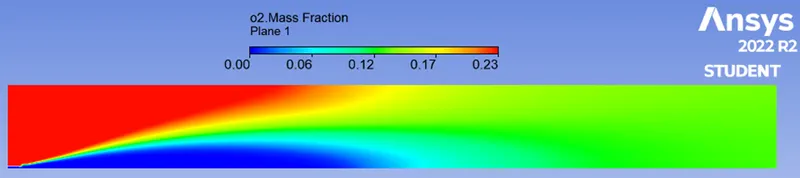
O2 Mass Fraction
|
0 % of H2O Addition
|
|
10 % of H2O Addition
|
|
20 % of H2O Addition
|
|
30 % of H2O Addition
|
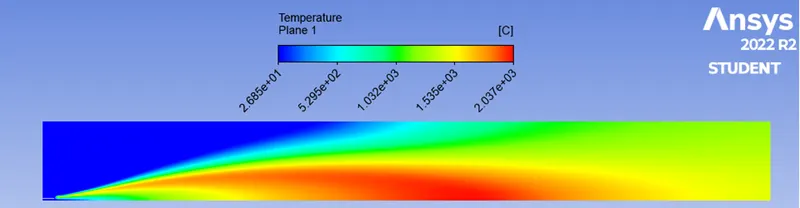
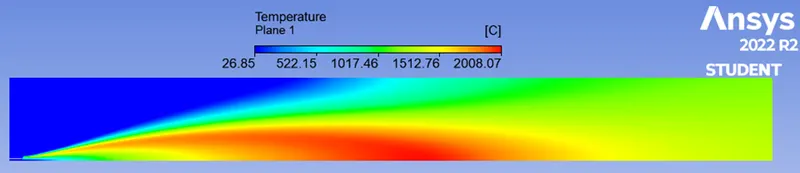
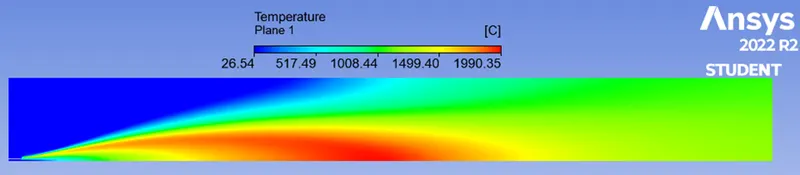
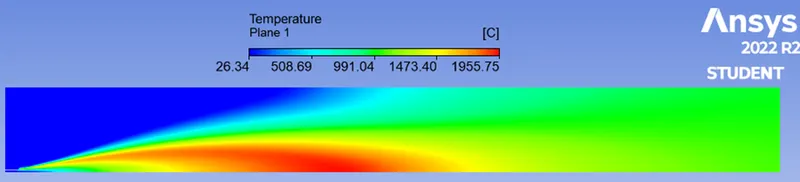
Temperature
|
0 % of H2O Addition
|
|
10 % of H2O Addition
|
|
20 % of H2O Addition
|
|
30 % of H2O Addition
|
Velocity Contour
|
0 % of H2O Addition
|
|
10 % of H2O Addition
|
|
20 % of H2O Addition
|
|
30 % of H2O Addition
|
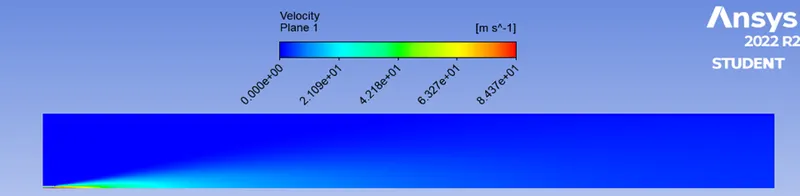


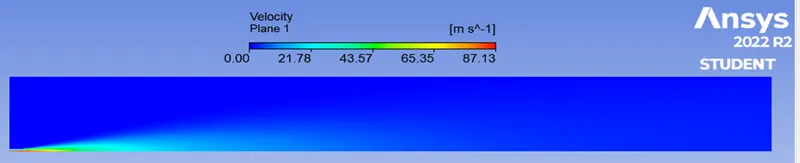
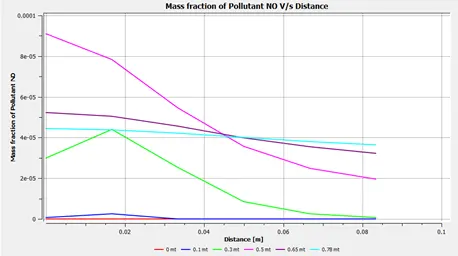
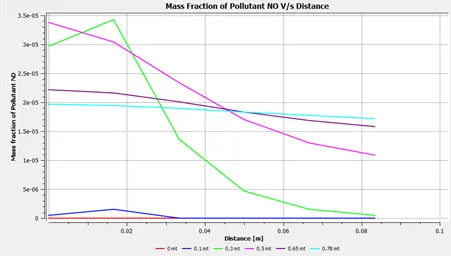
Mass Fraction of pollutant NO v/s Distance
|
0 % of H2O Addition
|
10 % of H2O Addition
|
|
20 % of H2O Addition
|
30 % of H2O Addition
|
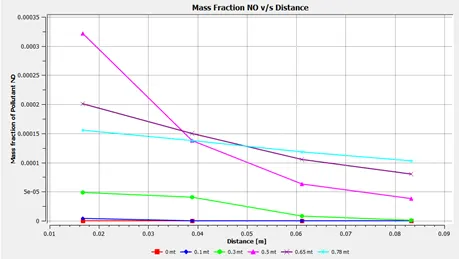
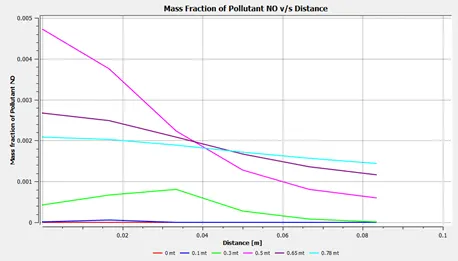
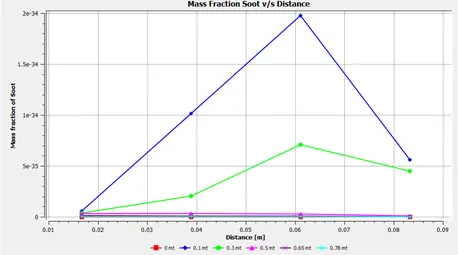
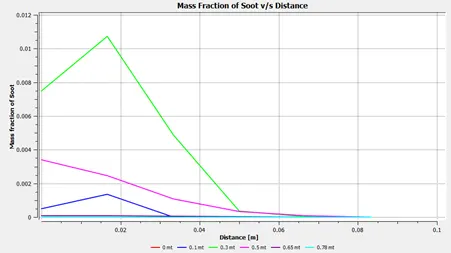
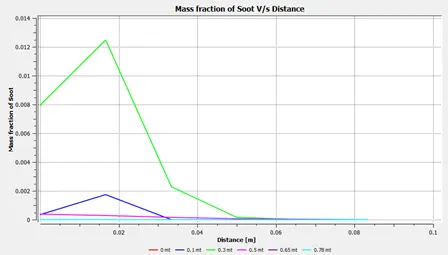
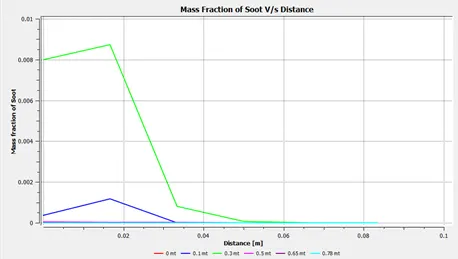
Mass Fraction of pollutant Soot v/s Distance
|
0 % of H2O Addition
|
10 % of H2O Addition
|
|
20 % of H2O Addition
|
30 % of H2O Addition
|
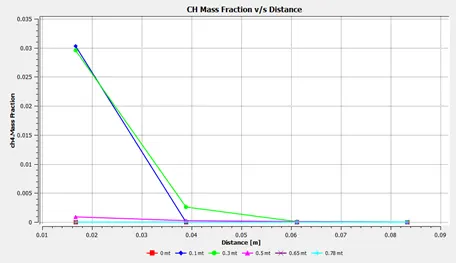
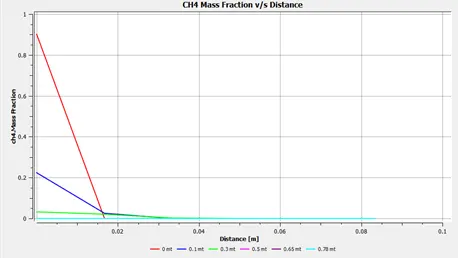
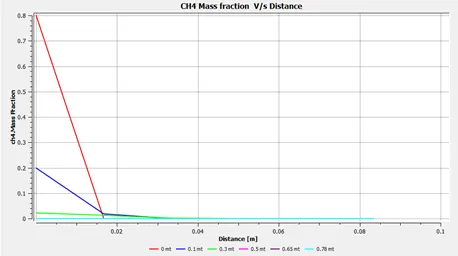
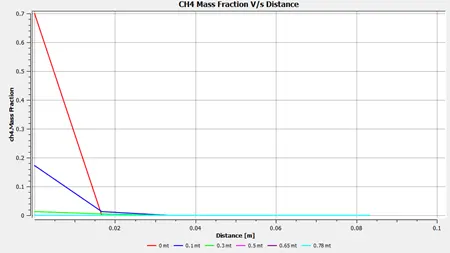
CH4 Mass Fraction v/s Distance
|
0 % of H2O Addition |
10 % of H2O Addition |
|
20 % of H2O Addition |
30 % of H2O Addition |
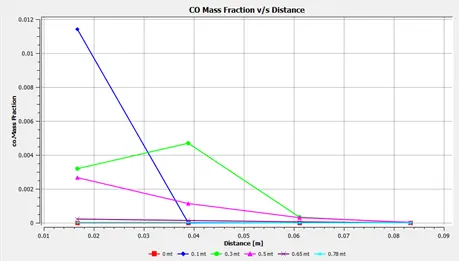
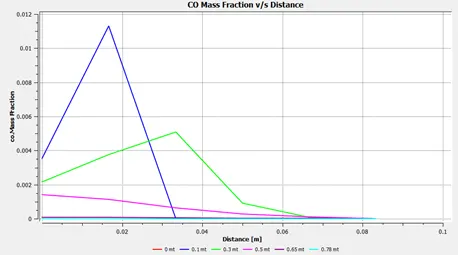
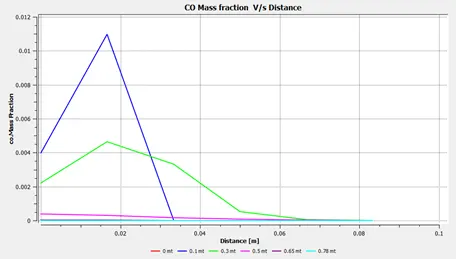
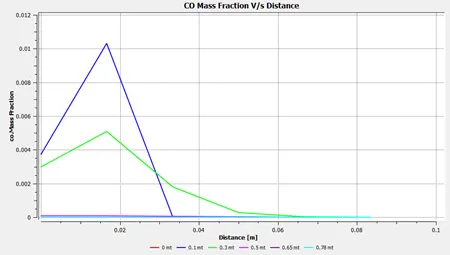
CO Mass Fraction v/s Distance
|
0 % of H2O Addition |
10 % of H2O Addition |
|
20 % of H2O Addition |
30 % of H2O Addition |
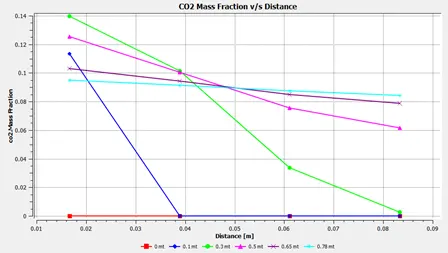
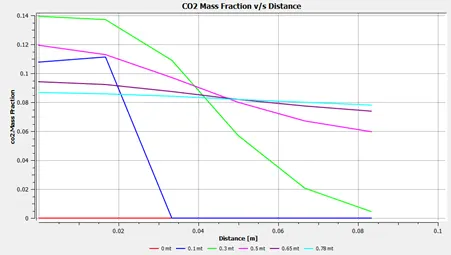
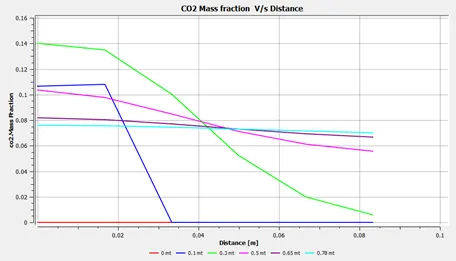
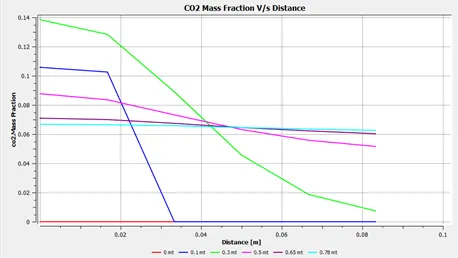
CO2 Mass Fraction v/s Distance
|
0 % of H2O Addition |
10 % of H2O Addition |
|
20 % of H2O Addition |
30 % of H2O Addition |
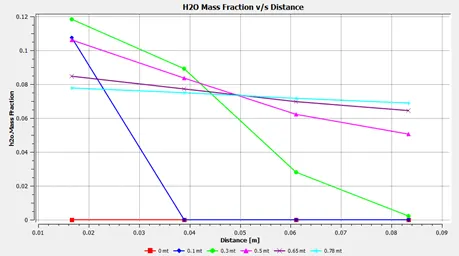
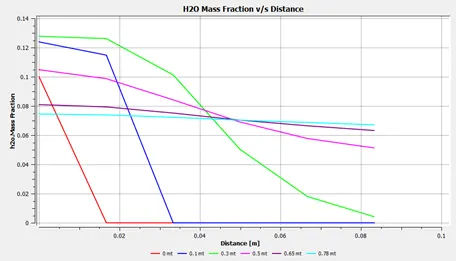
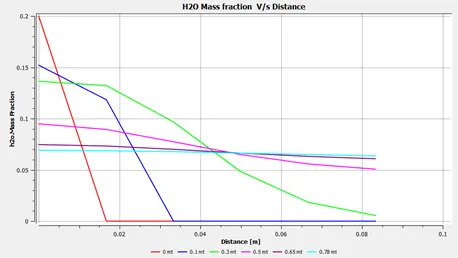
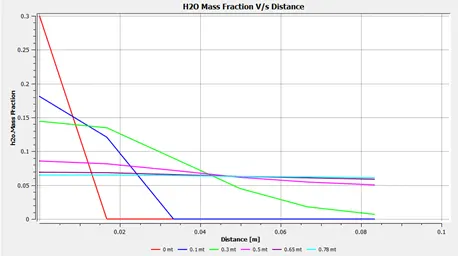
H2O Mass Fraction v/s Distance
|
0 % of H2O Addition |
10 % of H2O Addition |
|
20 % of H2O Addition |
30 % of H2O Addition |
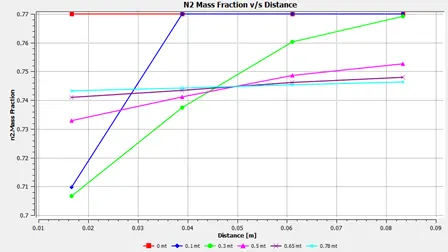
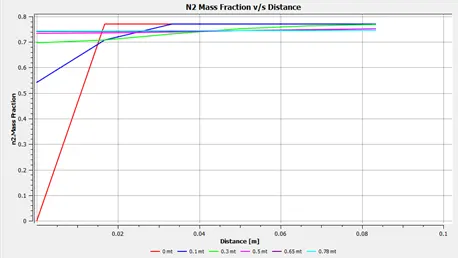
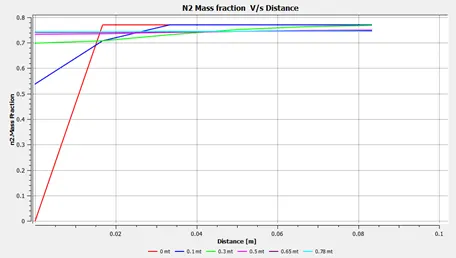
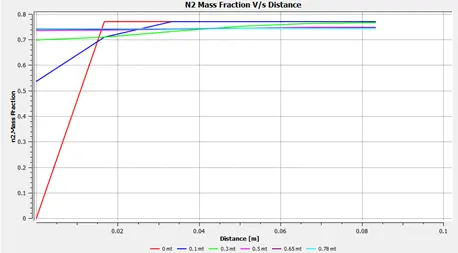
N2 Mass Fraction v/s Distance
|
0 % of H2O Addition |
10 % of H2O Addition |
|
20 % of H2O Addition |
30 % of H2O Addition |
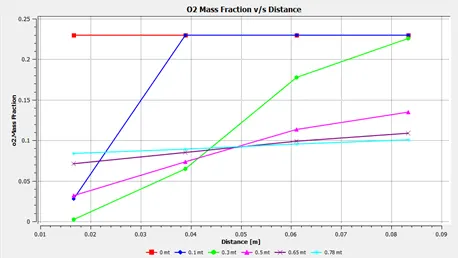
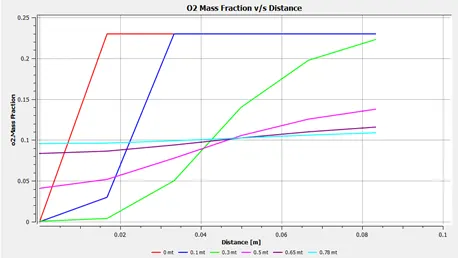
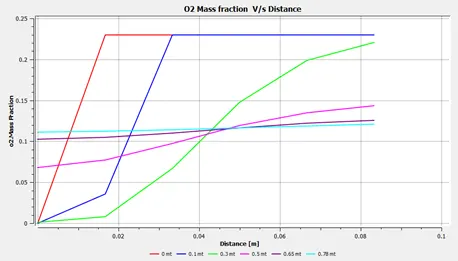
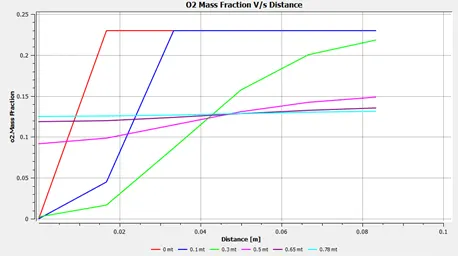
O2 Mass Fraction v/s Distance
|
0 % of H2O Addition |
10 % of H2O Addition |
|
20 % of H2O Addition |
30 % of H2O Addition |
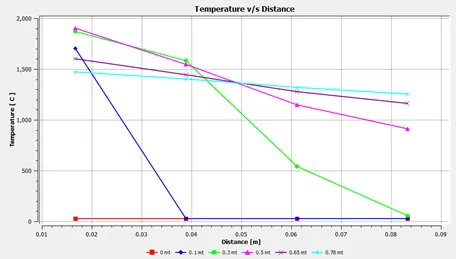
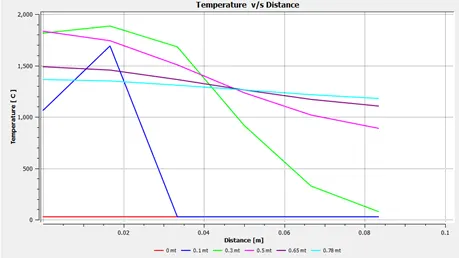
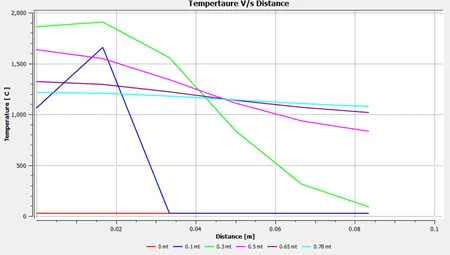
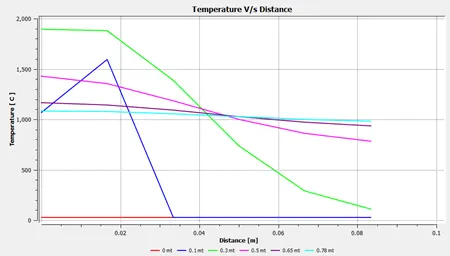
Temperature v/s Distance
|
0 % of H2O Addition |
10 % of H2O Addition |
|
20 % of H2O Addition |
30 % of H2O Addition |
Conclusion
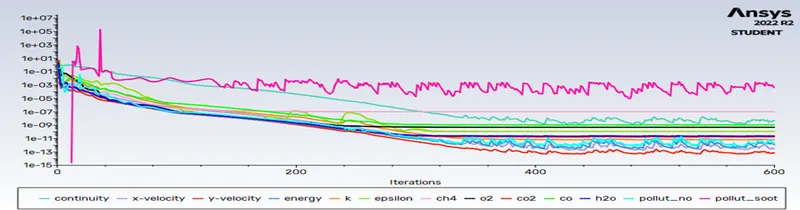
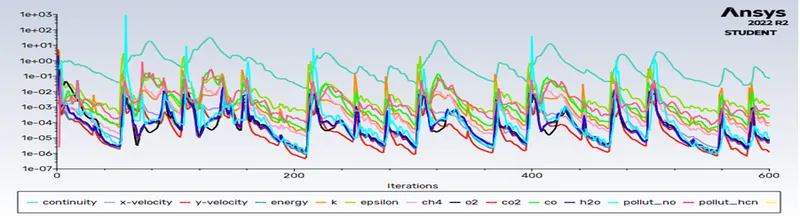
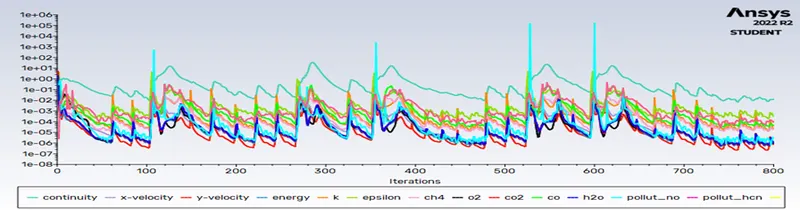
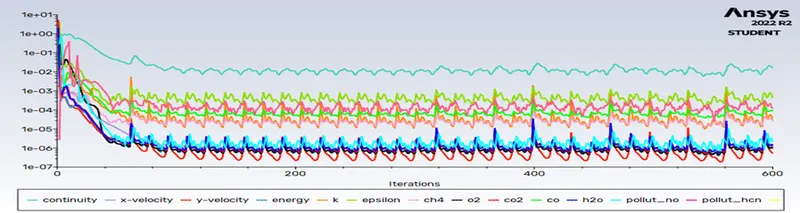
- By observing the residual plot, we can conclude that above 400 iterations the solution get converged but although I have run up to 600 iterations for better results.
- The 4 cases show that the percentage of fuel (CH4) reduction from 100% to 70% in other words the addition of water content from 0% to 30 % and observing the reaction.
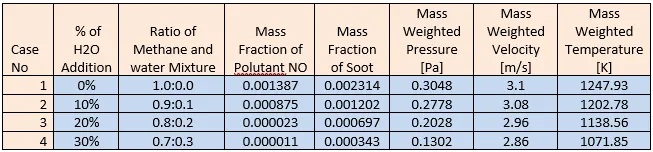
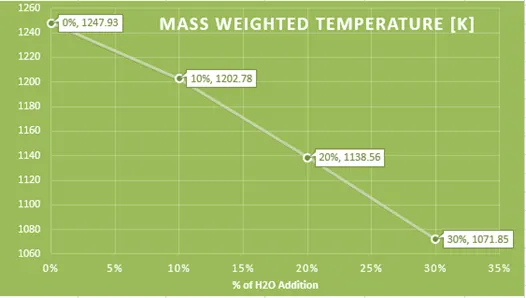
- The simulation results reveal that the maximum temperature reached in default case 1, i.e., without any water content, is around 1200 K. The mass fraction of species such as N2 and O2 is nearly stable, although CO2 content has decreased.
- The simulation contours display the NOx emissions at the combustor's outlet.
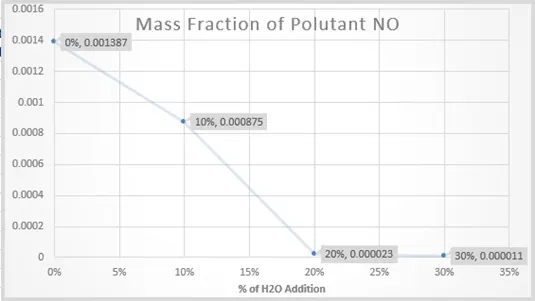
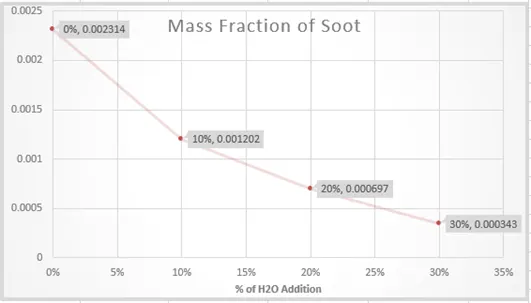
- It is apparent that the NOx mass fraction declines with a decrease in temperature. The charts for mass fraction depict that as the water content rises, soot formation reduces.
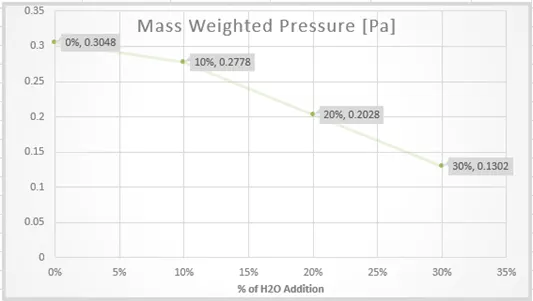
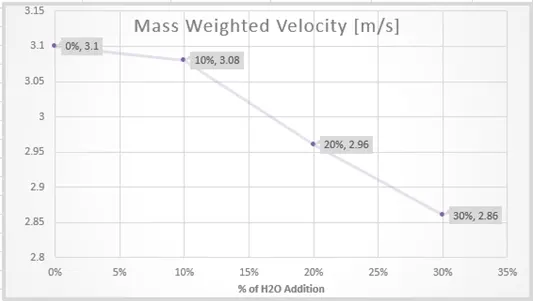
- Therefore, increasing the water content in the fuel from 5% to 30% decreases the maximum temperature, NOx, and soot formation, thereby reducing harmful emissions overall.
- Further investigations could lead to identifying the optimal conditions for complying with strict government emission standards.
Reference
- https://www.sciencedirect.com/science/article/pii/S1876610217337724
- https://link.springer.com/article/10.1007/s00773-015-0303-8
- https://www.britannica.com/science/chemical-kinetics
- https://en.wikipedia.org/wiki/Combustion