Week 10 - Simulating Combustion of Natural Gas.
BATTERY THERMAL MANAGEMENT SYSTEM
Problem Statement:
Perform the heat transfer analysis using ANSYS-Fluent software for the cylindrical Lithium ion Battery with heat generation boundary condition. Create an enclosure and use air as the working fluid for cooling the battery Pack system (4 x 2). Take air
inlet temperature as 26°C and space between the batteries as 2 mm.
Property of the Lithium-ion Battery
Nominal Voltage = 3.6 V
Nominal capacity = 2.2 A
Density = 2722 kg/m3
Specific heat = 1200 J/kg.K
Thermal Conductivity = 0.2 W/m.K
Heat Source = 48750 W/m3 (1.5 C discharge rate)
Size of the Battery = 18 mm diameter and 65 mm height.
Expected results:
• Explain why battery cooling is needed. And give a brief description about various techniques for battery cooling.
• Perform Mesh independent study for any one case and based on your judgment use the more suitable model for further cases.
• Run the simulation by varying the velocity of air as 3, 5 and 10m/sec and discuss the results.
• Find out the maximum temperature and heat transfer coefficient obtained by the battery.
• Based on the results and on your judgment, select one case (3, 5 or 10 m/s) and vary the space between the batteries as 2, 4 and 6 mm, then discuss the results.
• Prove that the simulation has achieved convergence with appropriate images and plots (Velocity and temperature contour plots on the cut planes).
• Create the animation to observe the temperature distribution and velocity vector.
• Summarize the results in tabulation/ graphical form.
• State the inferences based on the results.
BTMS:
Battery Thermal Management Systems (BTMS) are used to control the temperature of batteries in electric vehicles (EVs), hybrid electric vehicles (HEVs), and other battery-powered systems. The goal of a BTMS is to keep the temperature of the battery within an optimal range to ensure its safe and efficient operation.
There are several key components of a BTMS, including temperature sensors, a cooling system, and a control system. Temperature sensors are used to monitor the temperature of the battery and provide feedback to the control system. The cooling system, which can include a liquid or air-based cooling system, is used to remove heat from the battery. The control system uses the information from the temperature sensors to control the cooling system and maintain the desired temperature range.
There are several different cooling methods used in BTMS, including liquid cooling, air cooling, and phase change materials. The choice of cooling method depends on the specific application and the requirements of the system.
IMPORTANCE OF BTMS:
The importance of BTMS is that it helps to maintain the safety and performance of the battery, by keeping the temperature within an optimal range. Overheating can cause permanent damage to the battery, while too low a temperature can also affect performance. BTMS helps to extend the life of the battery, by preventing thermal runaway, which can cause battery failure.
Some of the key reasons for the importance of BTMS include:
-
Safety: Temperature control is crucial for preventing thermal runaway, which can lead to fires or explosions. A properly functioning BTMS can help to prevent overheating and maintain safe operating temperatures.
-
Performance: Temperature also plays a key role in determining the performance of lithium-ion batteries. High temperatures can lead to a reduction in capacity and an increase in resistance. A BTMS can help to maintain optimal temperatures for maximum performance.
-
Durability: High temperatures can also lead to degradation of the battery over time. A BTMS can help to extend the life of the battery by preventing excessive heating.
-
Charging and discharging: Temperature control is also important when charging and discharging lithium-ion batteries. High temperatures during charging can lead to overcharging, while low temperatures during discharging can lead to undercharging. A BTMS can help to regulate the temperature during charging and discharging to ensure optimal performance.
-
Energy Efficiency: BTMS also play a key role in energy efficiency. The cooling system of the BTMS can consume significant power, which can be a trade-off with the cooling efficiency. A proper balance between cooling efficiency and power consumption is important for energy efficiency.
THERMAL RUNAWAY:
Thermal runaway is a phenomenon that occurs in batteries, where an increase in temperature causes a further increase in temperature, leading to a thermal chain reaction. This can cause the battery to overheat, leading to thermal damage, and in extreme cases, fires or explosions.
Thermal runaway typically occurs when the battery experiences an internal short circuit, which causes a large amount of current to flow through the cells. The high current causes an increase in temperature, which can lead to a breakdown of the electrolyte and the release of flammable gases. The increase in temperature can also cause the separator to degrade, allowing the electrodes to come into contact, further increasing the current flow and temperature.
Thermal runaway can also be caused by external factors, such as overcharging or overdischarging the battery, exposure to high temperatures, or mechanical damage.
Preventing thermal runaway is critical for the safe operation of batteries. This can be achieved through the use of safety mechanisms, such as temperature sensors and thermal fuses, which can detect an increase in temperature and shut off the current flow to prevent further heating. Additionally, the use of high-quality materials and manufacturing processes, as well as proper usage and maintenance of the batteries, can help to prevent thermal runaway.
C-RATING OF BATTERY:
The C-rating of a battery refers to the rate at which a battery can safely discharge its stored energy. It is defined as the ratio of the maximum continuous discharge current to the capacity of the battery.
For example, if a battery has a capacity of 2000mAh (milliampere-hours) and a C-rating of 2C, then the maximum continuous discharge current would be 2 x 2000mA = 4000mA.
The C-rating is typically used to compare the performance of batteries with different capacities. The higher the C-rating, the faster the battery can be discharged. However, it is important to note that the C-rating also depends on the battery chemistry.
For example, a lithium-ion battery will have a higher C-rating than a lead-acid battery. It is important to note that the C-rating is only relevant if the discharge rate is continuous. Short bursts of high current can be handled by batteries with lower C-rating. However, when a battery is discharged at a rate higher than its C-rating, the performance will decrease and it can even cause damage to the battery. For example, a battery with 2C rating can be discharged for 1 hour at its maximum continuous current, 2C x capacity of the battery.
AIM:
The aim of this study is to perform a heat transfer analysis of a cylindrical Lithium-ion battery using ANSYS-Fluent software and understand the cooling performance of the battery and the effect of air velocity and spacing between the batteries on the temperature distribution and heat transfer coefficient. The goal is to investigate the cooling performance of the battery pack system and determine the optimal air velocity and spacing between the batteries that results in the lowest maximum temperature and the highest heat transfer coefficient.
PROCEDURE:
In CFD heat transfer analysis, the following steps were performed in a stepwise manner:
1.Geometry creation/Pre-processing
2.Mesh Generation
3.Setup, solution generation, and finally,
4.Post-Processing.
To perform this, the ANSYS Fluent commercial CFD code was utilized.
CASE1: Spacing between Batteries 2mm and Flow velocity Varying from 3,5,10m/sec.
1) Geometry creation:
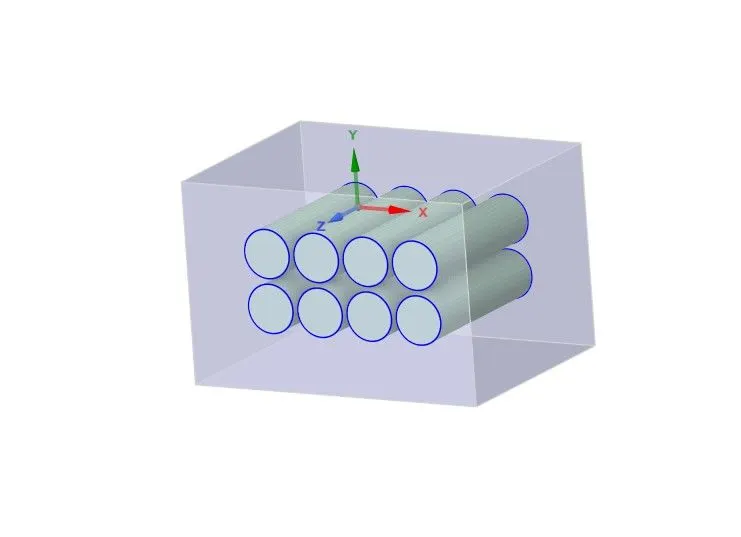
In ANSYS, Spaceclaim was used to create a geometry with 18mm in diameter and 65mm in length. Using the linear tool method, a battery pack was created with 4 cells in the X-direction and 2 cells in the Y-direction, with a spacing of 2mm between each cell in both the X and Y directions. An enclosure was also created around the cells with a spacing of 10mm from the cell to the top wall and 20mm to the side walls, to ensure sufficient airflow around the cells for optimal cooling.
2) Mesh Generation:
Additionally, named conventions were assigned to the various components of the battery module based on their respective functions. The walls were designated as convection walls as there would be heat transfer from the battery module to the external environment, which would likely be minimal.
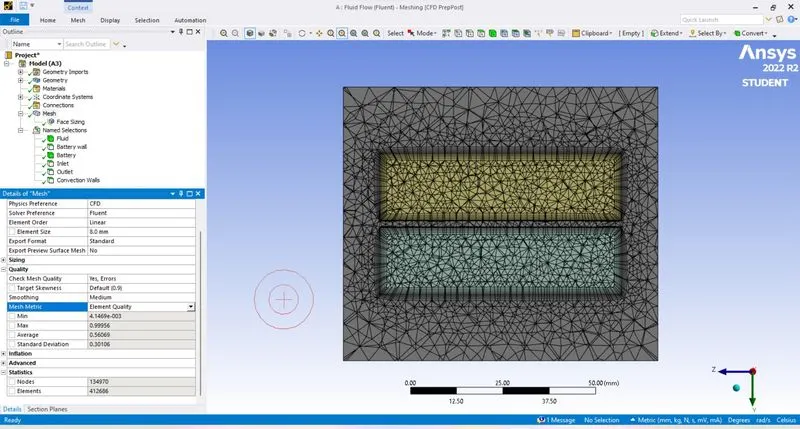
In the meshing process, an 8mm mesh element was chosen throughout the entire battery pack, and a face sizing method was applied to the battery wall to accurately capture the airflow and heat transfer, as well as the curvature of the surface. Initially, an inflation layer was created around the cells using a program-controlled method, but the results were not satisfactory. Therefore, the inflation layer was created using the named selection method specifically on the battery wall. The final mesh elements were found to be satisfactory with a total of 412,686 elements.
3)Setup & Solution:
In ANSYS, the following setup was used for the CFD heat transfer analysis:
-
In the "Boundary Conditions" panel, convection walls were assigned for the battery module walls as there is heat transfer from the battery module to the external environment. A flow velocity of 3m/sec was assigned at the inlet.
-
In the "Viscous Model" panel, the k-epsilon RNG model with Enhanced wall treatment was selected.
-
In the "Pressure and Velocity Coupling" panel, the COUPLED method was used as the pressure and velocity coupling scheme.
-
In the "Solver" panel, a steady-state pressure-based solver was used.
-
In the "Materials" panel, the solid medium was set to LITHIUM. The properties of lithium-ion battery such as density, specific heat and thermal conductivity were given as per the problem statement. The fluid medium was set to AIR, with the properties of air used as default.
-
Under the "Sources" panel, a "heat generation" boundary condition was applied to the battery cells with a value of 48750 W/m3 as per the problem statement.
-
In the "Initialization" panel, the Hybrid initialization method was used for initialization.
The obtained results are mentioned below.
| Battery Spacing in mm |
Flow Velocity in m/sec |
Max Temp of Battery in kelvin |
Min Temp of Battery in kelvin |
Delta Temp of Battery in kelvin |
Avg Temp of Battery in kelvin |
Heat Transfer Coefficeient W/(m2K) |
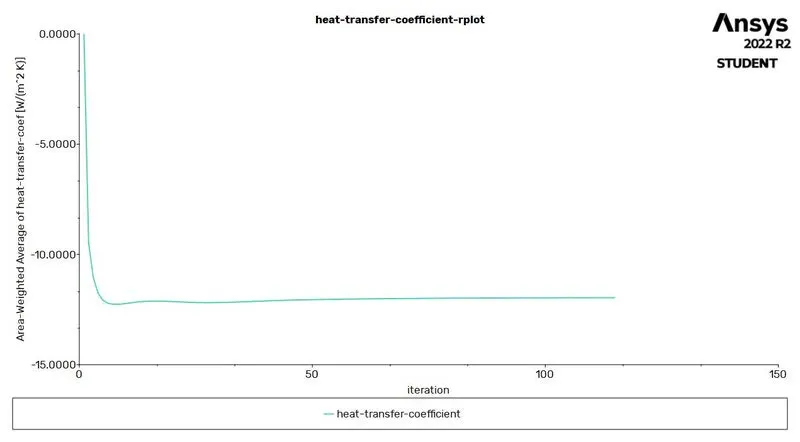
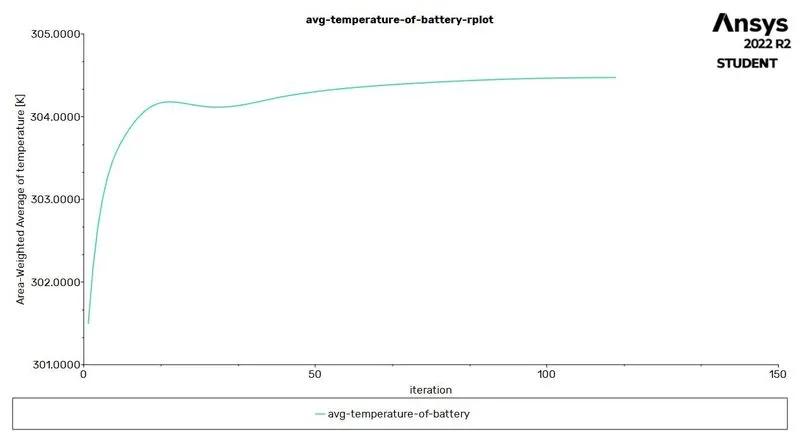
| 2 | 3 | 310.58 | 300.76 | 9.82 | 304.5 | -11.964 |
| 2 | 5 | 307.86 | 300.47 | 7.39 | 303.18 | -12.888 |
| 2 | 10 | 305.15 | 300.25 | 4.9 | 301.94 | -13.962 |
Based on the simulation results, it can be concluded that the temperature of the battery decreases as the flow velocity of the cooling air increases. The maximum temperature of the battery decreases from 310.58 K at a flow velocity of 3 m/sec to 305.15 K at a flow velocity of 10 m/sec. The heat transfer coefficient also increases as the flow velocity increases, indicating that the cooling performance of the system is better at higher flow velocities. Also, the results have also indicated that the temperature difference and the heat transfer coefficient is significantly decreased as the spacing between the batteries increased. Overall, it can be inferred that the cooling performance of the battery pack system improves with an increase in the flow velocity of the cooling air and also with the increase in the spacing between the batteries.
Velocity And Temperature Contour Plot:
For Flow Velocity 3m/sec
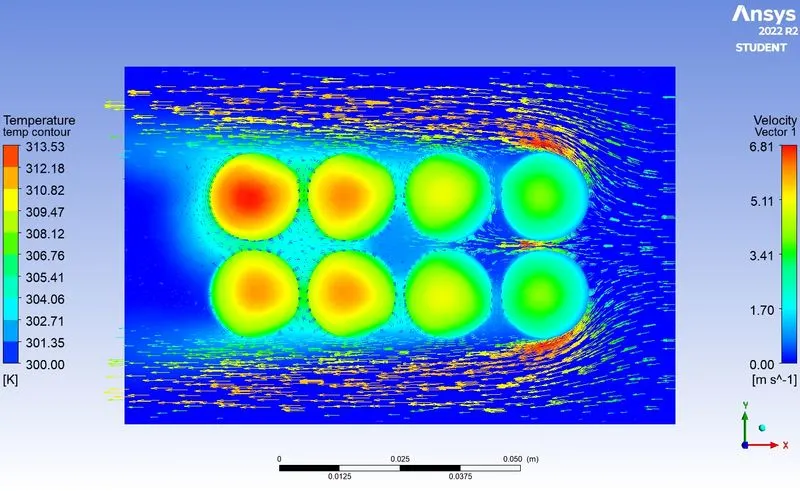
The results of the simulation indicate that as the flow velocity of the cooling air increases, the heat transfer coefficient, or the rate at which heat is transferred from the battery to the cooling air, also increases. However, the temperature distribution within the battery pack is not uniform. At lower flow velocities, the temperature at the left side of the battery is higher than at the right side, likely due to a longer heat transfer time at the left side of the battery. This can lead to uneven heating of the battery cells, and if sustained over time, could potentially result in damage to the cells and even thermal runaway.
For Flow Velocity 5m/sec
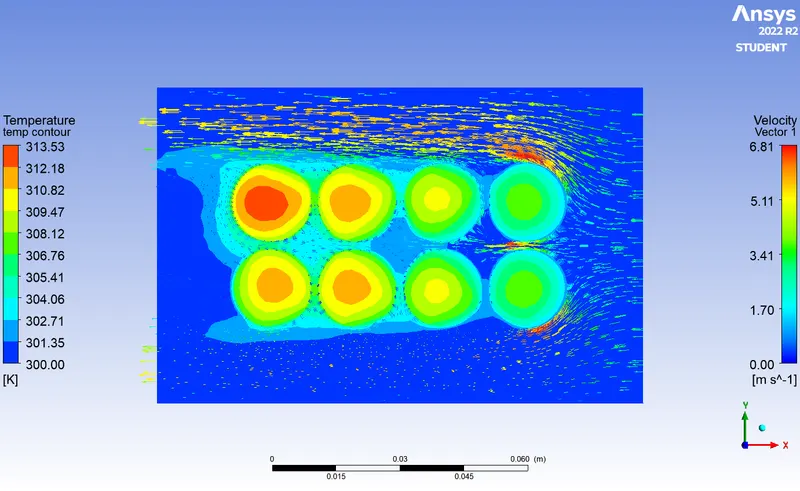
The above plot indicates that the fluid flow is from right to left. The plot shows that the cooling of the battery is highest at the rightmost side and the temperature of the battery remains relatively high at the leftmost side for a flow velocity of 5 m/s.
For Flow Velocity 10m/sec:
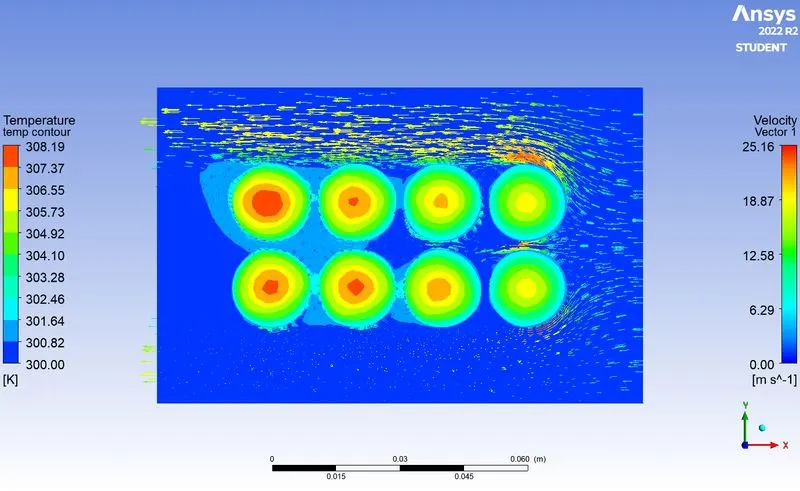
The above plot shows that as the fluid flow velocity increases from 3m/s to 10m/s, the heat transfer coefficient increases, resulting in a decrease in the temperature of the outer shell of the battery. This indicates that a higher flow velocity leads to more efficient cooling of the battery. It also shows that at the highest flow velocity of 10m/s, the temperature difference between the inner and outer shell of the battery is the smallest, indicating that the heat is being effectively transferred from the battery to the fluid.
If we observe the temperature in cells, it can be seen that the heat transfer rate is greater with a higher fluid flow velocity. However, for a flow velocity of 5m/sec, the temperature at the center of the cell is much lower compared to a flow velocity of 10m/sec. This may be due to the fact that at higher flow rates, the outer part of the battery is cooled more quickly, leaving less time for heat transfer from the inside to the outside. At higher flow velocities, the fluid flow time is shorter than the heat transfer time. If this continues for an extended period or over the life of the battery, it may lead to weakening of the battery at the core or center region, and in some cases, failure or damage of the battery due to thermal runaway.
CASE2: Spacing between Batteries 4mm and Flow velocity Varying from 3,5,10m/sec.
The procedures followed were the same as said above in creating geometry and meshing.
Mesh Elements : 379042.
Results found satisfactory.
| Battery Spacing in mm |
Flow Velocity in m/sec |
Max Temp of Battery in kelvin |
Min Temp of Battery in kelvin |
Delta Temp of Battery in kelvin |
Avg Temp of Battery in kelvin |
Heat Transfer Coefficeient W/(m2K) |
| 4 | 3 | 307.94 | 300.89 | 7.05 | 303.87 | -12.723 |
| 4 | 5 | 305.58 | 300.57 | 5.01 | 302.55 | -13.892 |
| 4 | 10 | 303.99 | 300.31 | 3.68 | 301.65 | -14.755 |
PostProcessing:
Temperature and Velocity contour plot for 3m/sec velocity with 4mm spacing between batteries.
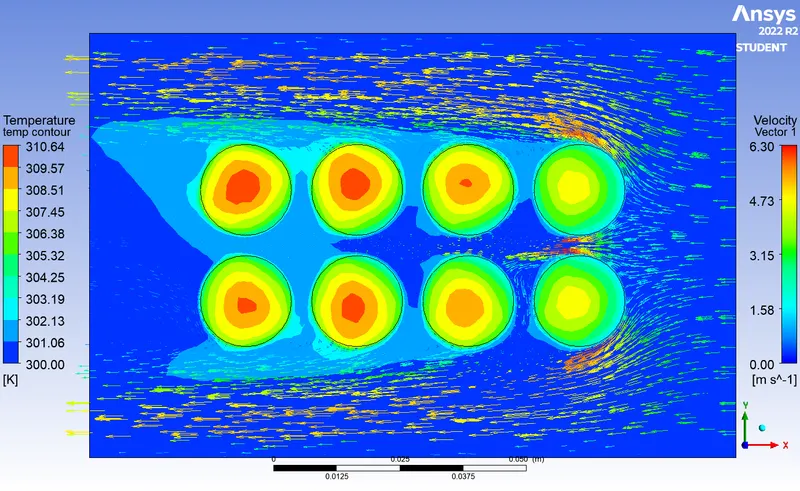
Temperature and Velocity contour plot for 5m/sec velocity with 4mm spacing between batteries.
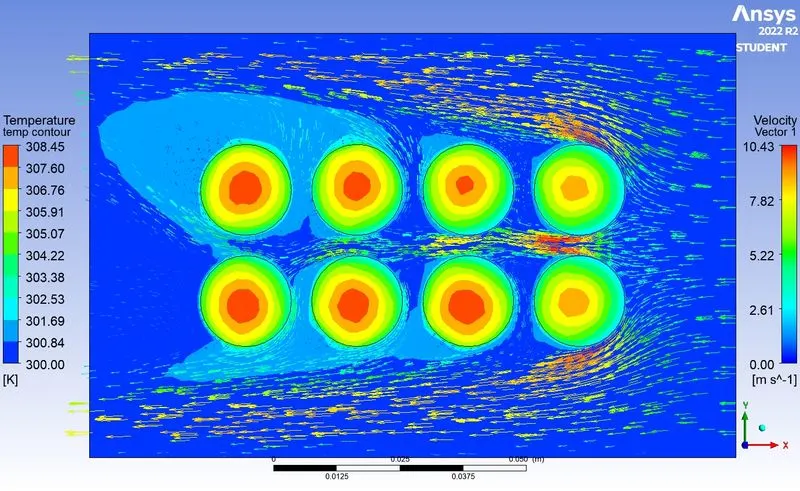
Temperature and Velocity contour plot for 10m/sec velocity with 4mm spacing between batteries.
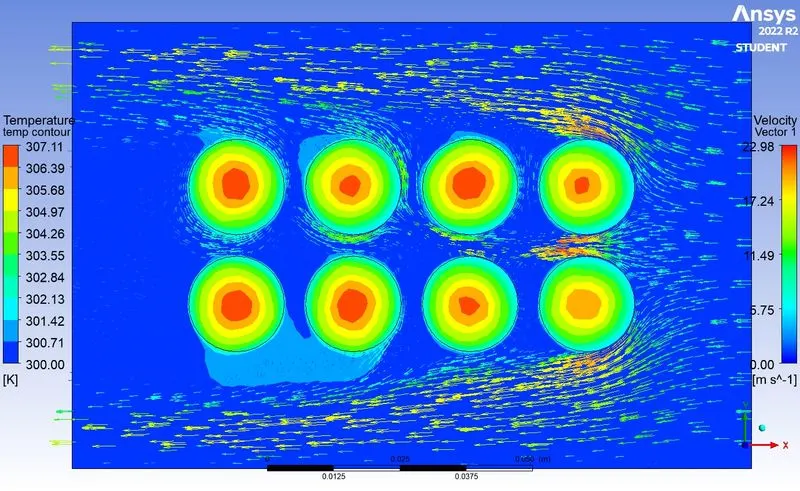
The results of the simulation show that as the spacing between the batteries increases to 4mm, even with a lower flow velocity of 3m/sec, the cooling of the battery pack is improved in comparison to the 2mm spacing and 5m/sec flow velocity conditions. This suggests that increasing the spacing between the batteries can enhance the cooling performance of the battery thermal management system.
If we observe the temperature in cells, it can be seen that the heat transfer rate is greater with a higher fluid flow velocity. However, for a flow velocity of 5m/sec, the temperature at the center of the cell is much lower compared to a flow velocity of 10m/sec. This may be due to the fact that at higher flow rates, the outer part of the battery is cooled more quickly, leaving less time for heat transfer from the inside to the outside. At higher flow velocities, the fluid flow time is shorter than the heat transfer time. If this continues for an extended period or over the life of the battery, it may lead to weakening of the battery at the core or center region, and in some cases, failure or damage of the battery.
CASE3: Spacing between Batteries 6mm and Flow velocity Varying from 5m/sec.
The procedures followed were the same as said above in creating geometry and meshing.
Mesh Elements : 394067.
Results found satisfactory.
| Battery Spacing in mm |
Flow Velocity in m/sec |
Max Temp of Battery in kelvin |
Min Temp of Battery in kelvin |
Delta Temp of Battery in kelvin |
Avg Temp of Battery in kelvin |
Heat Transfer Coefficeient W/(m2K) |
| 6 | 3 | 308.47 | 300.91 | 7.56 | 304.16 | -12.466 |
| 6 | 5 | 305.95 | 300.73 | 5.22 | 302.506 | -13.922 |
| 6 | 10 | 304.01 | 300.31 | 3.7 | 301.66 | -14.75 |
Temperature and Velocity contour plot for 3m/sec velocity with 6mm spacing between batteries.
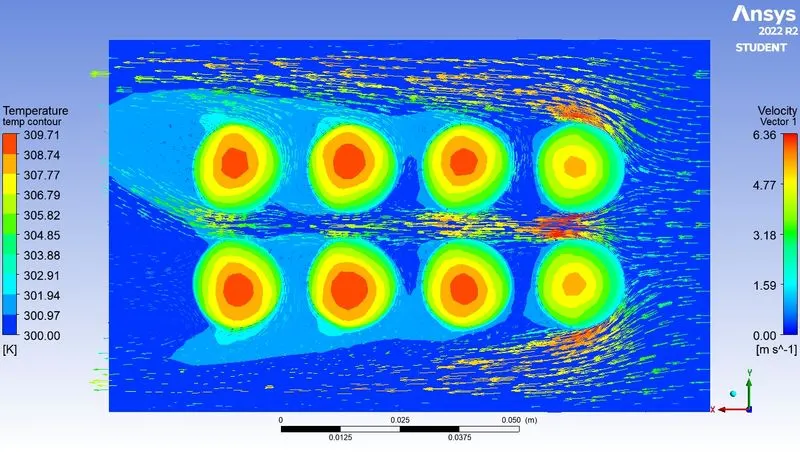
Temperature and Velocity contour plot for 5m/sec velocity with 6mm spacing between batteries.
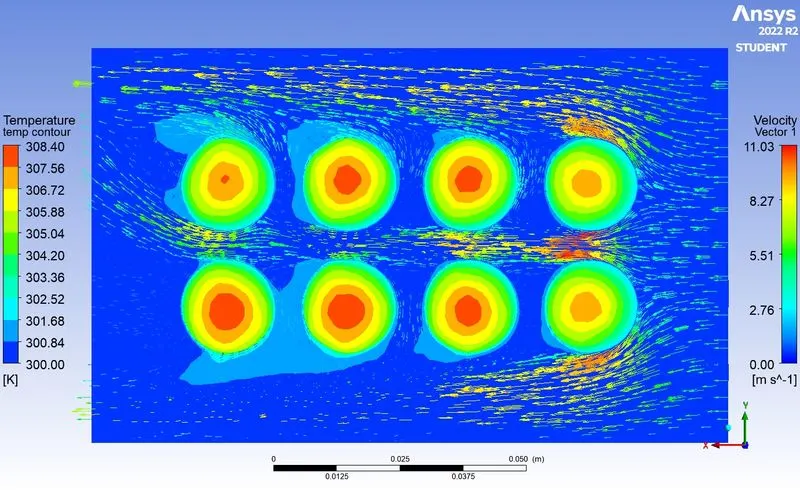
Temperature and Velocity contour plot for 10m/sec velocity with 6mm spacing between batteries.
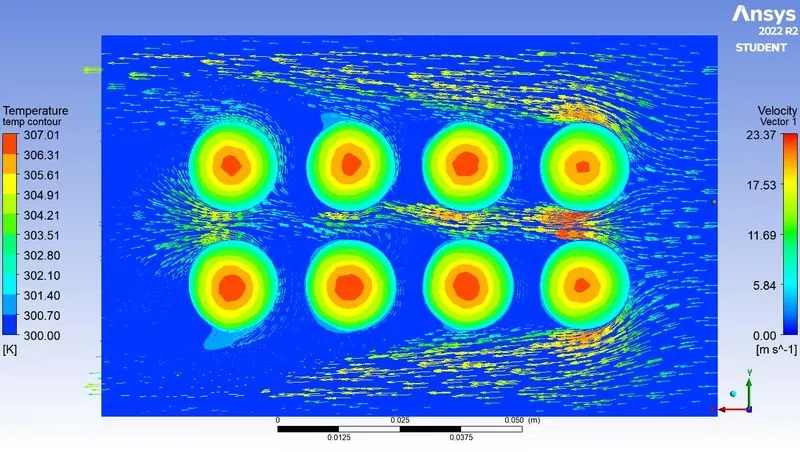
If we observe the plot and the obtained results, we can see that the temperature concentration is higher at the center of each individual cell. This is likely due to the fact that steady state simulation was used, where flow parameters are independent of time. This means that the time required for heat transfer to occur is longer and as a result, the temperature at the center of each cell is higher.
CASE4: 6mm Spacing with Varying flow velocity With TRANSIENT STATE Condition.
In a transient state condition, the system is in a state of constant change over time. The conditions within the system are constantly evolving and are not in a steady state. In contrast, in a steady state condition, the conditions within the system do not change over time and remain constant. In a transient state simulation, the system is modeled over a period of time and the results show how the system changes over that period. This can be useful for understanding how a system behaves in real-world scenarios where conditions are constantly changing.
| Flow Velocity in m/sec |
Max Temp of Battery in kelvin |
Avg Temp of Battery in kelvin |
Heat Transfer Coefficeient W/(m2K) |
| 3 | 310.58 | 304.47 | -11.964 |
| 5 | 307.86 | 303.18 | -12.887 |
| 10 | 305.14 | 301.94 | -13.961 |
From these results, it can be observed that as the flow velocity increases, the maximum temperature of the battery decreases and the average temperature of the battery also decreases. This suggests that a higher flow velocity results in more efficient cooling of the battery, which can help to prolong the battery's lifespan. Additionally, the heat transfer coefficient also decreases as the flow velocity increases, indicating that more heat is being transferred from the battery to the surrounding fluid at higher flow velocities. It can also be inferred that, as the flow velocity increases, the temperature difference between the maximum and average temperature of the battery also decreases which means heat is uniformly distributed inside the battery. It is also important to consider the actual time for which the simulation was run, as transient state results are dependant on time. It should also be noted that these results are specific to the conditions and parameters used in the simulation and may not necessarily reflect the behavior of the battery in real-world conditions.
CONCLUSION:
| Battery Spacing in mm |
Flow Velocity in m/sec |
Max Temp of Battery in kelvin |
Min Temp of Battery in kelvin |
Delta Temp of Battery in kelvin |
Avg Temp of Battery in kelvin |
Heat Transfer Coefficeient W/(m2K) |
| 2 | 3 | 310.58 | 300.76 | 9.82 | 304.5 | -11.964 |
| 4 | 3 | 307.94 | 300.89 | 7.05 | 303.87 | -12.723 |
| 6 | 3 | 308.47 | 300.91 | 7.56 | 304.16 | -12.466 |
| Battery Spacing in mm |
Flow Velocity in m/sec |
Max Temp of Battery in kelvin |
Min Temp of Battery in kelvin |
Delta Temp of Battery in kelvin |
Avg Temp of Battery in kelvin |
Heat Transfer Coefficeient W/(m2K) |
| 2 | 5 | 307.86 | 300.47 | 7.39 | 303.18 | -12.888 |
| 4 | 5 | 305.58 | 300.57 | 5.01 | 302.55 | -13.892 |
| 6 | 5 | 305.95 | 300.73 | 5.22 | 302.506 | -13.922 |
| Battery Spacing in mm |
Flow Velocity in m/sec |
Max Temp of Battery in kelvin |
Min Temp of Battery in kelvin |
Delta Temp of Battery in kelvin |
Avg Temp of Battery in kelvin |
Heat Transfer Coefficeient W/(m2K) |
| 2 | 10 | 305.15 | 300.25 | 4.9 | 301.94 | -13.962 |
| 4 | 10 | 303.99 | 300.31 | 3.68 | 301.65 | -14.755 |
| 6 | 10 | 304.01 | 300.31 | 3.7 | 301.66 | -14.75 |
From the above table, it can be observed that as the spacing between the batteries increases, the maximum temperature of the battery decreases. Also, as the flow velocity increases, the maximum temperature of the battery decreases. The heat transfer coefficient also decreases as the spacing between the batteries increases and the flow velocity increases. This suggests that increasing the spacing between the batteries and increasing the flow velocity improves the cooling of the battery pack and reduces the maximum temperature of the battery. This in turn can improve the life of the battery pack.