Week 10: Project 1 - FULL HYDRO case set up (PFI)
Aim: To setup and perform full hydrodynamic simulation of port fuel injection engine using the converge CFD software.
Objective:
- To setup the full hydrodynamic case with the given inputs and boundary conditions.
- To find out the compression ratio of the given engine.
- To explain the need for wall heat transfer model and explain why prediction of wall temperature from CFD simulation is not possible.
- To calculate combustion efficiency of the given engine.
- To engine performance calculatot for determining the power and torque of the engine.
- To explain the significance of Ca10, Ca50 and Ca90.
Introduction:
The purpose of internal combustion engines is the production of mechanical power from chemical energy contained in the fuel. In internal combustion engines, the energy is released by burning or oxidizing the fuel inside the engine. Many spark ignited engines use fuel injection system where the fuel is introduced into the combustion chamber where the fuel is atomized as it is sprayed through the nozzle.
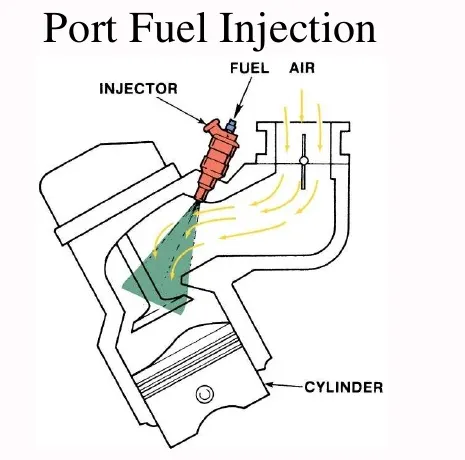
This project discusses the methods involved in CFD modeling the combustion in the port fuel injection engine. It is very important to study the mixture preparation in engines to understand the injection strategy which helps in achieving minimum emission and lower fuel consumption. The case setup for full hydrodynamic PFI engine simulation is given below.
Case setup:
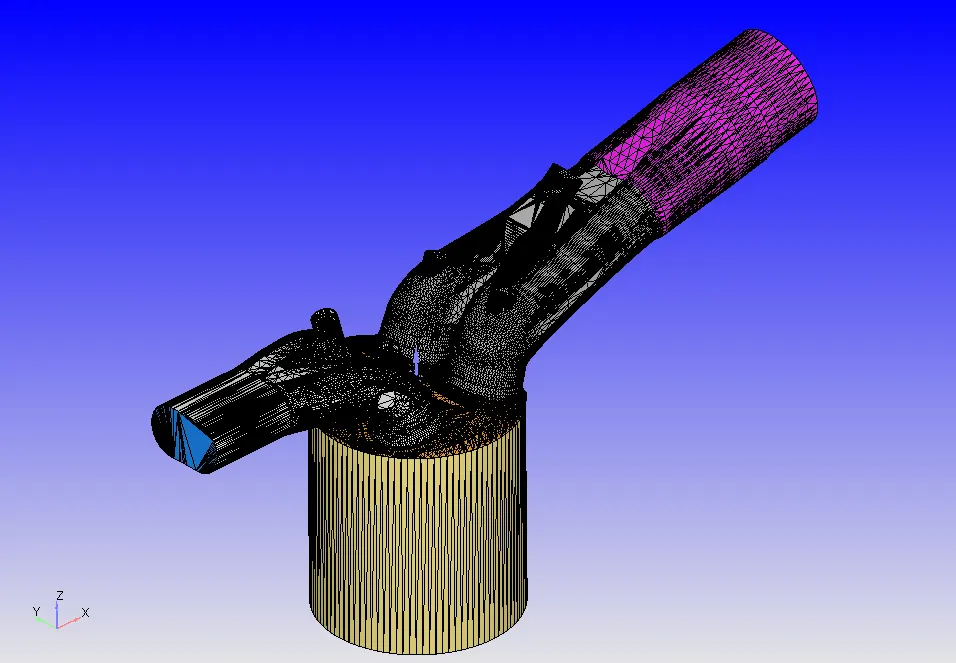
Importing the given PFI engine model into converge CFD software
Engine parameters
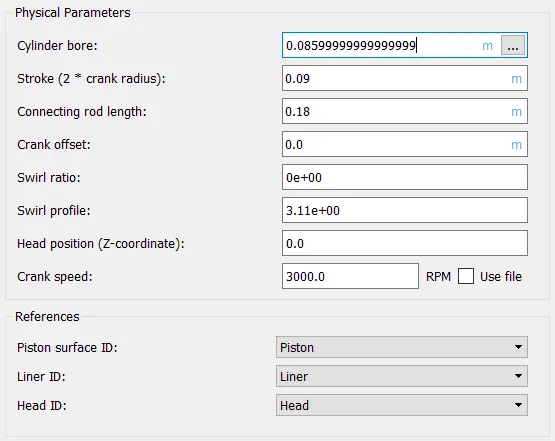
The engine parameters such as cylinder bore diameter, stroke length, connecting rod lenth and crank speed are specified in the physical parameters tab as shown in above picture. The reference ID are added for piston, liner and cylinder head.
Materials
therm.dat file imported into the gas simlation
mech.dat file imported into the reaction mechanism
IC8H18 is added as the species in the parcel simulation
The therm.dat file provides the list of gas properties from species specific polynomial coefficients which must be present for each gas-phase species in the simulation. The mech.dat file provides the list of gas phase elements and species used in the simulation and it also includes the reaction data which helps in solving complex chemical kinetics equations. The IC8H18 is added as the species for parcel simulation as it has similar physical properties as the gasoline and it is the fuel sprayed into the combustion chamber through inlet port.
Simulation run parameters
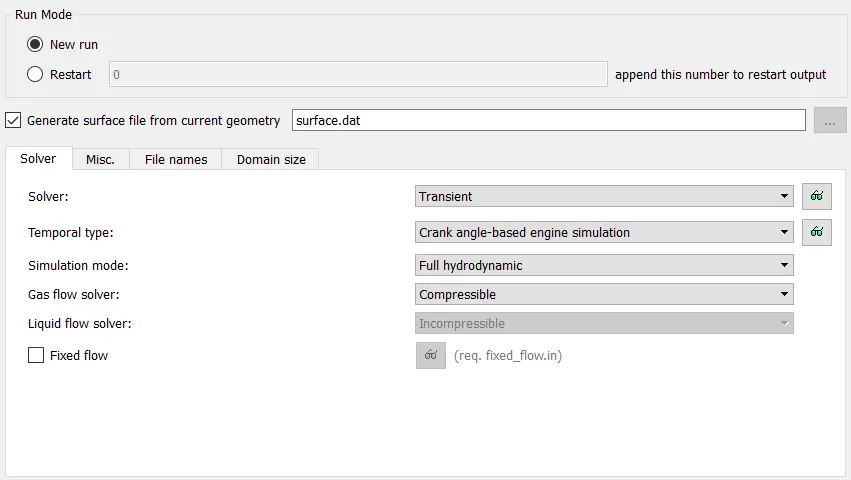
The transient state solver is used as the solver with full hydrodynamic simulation which solves the CFD equations to predict desired output quantities and the position os valve, combustion process is captured as time progresses.
Simulation time parameters
Solver scheme = PISO
Navier-stokes equation solver type = density based solver
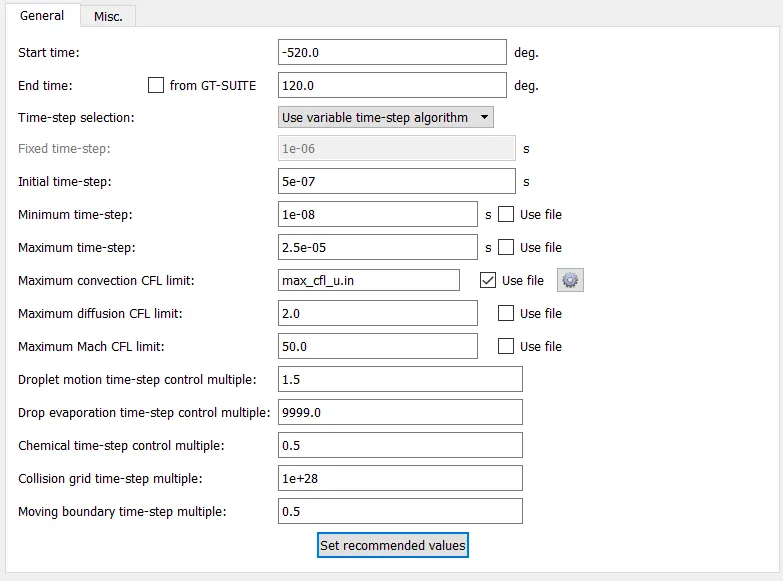
The simulation start time is at -520 deg crank angle and end time is at 120 deg crank angle. The PISO is used as the solver scheme which provides stable solution and faster solution convergence. The density based solver is used, as the fuel density changes with respect to time and is high speed compressible flow.
Boundary conditions
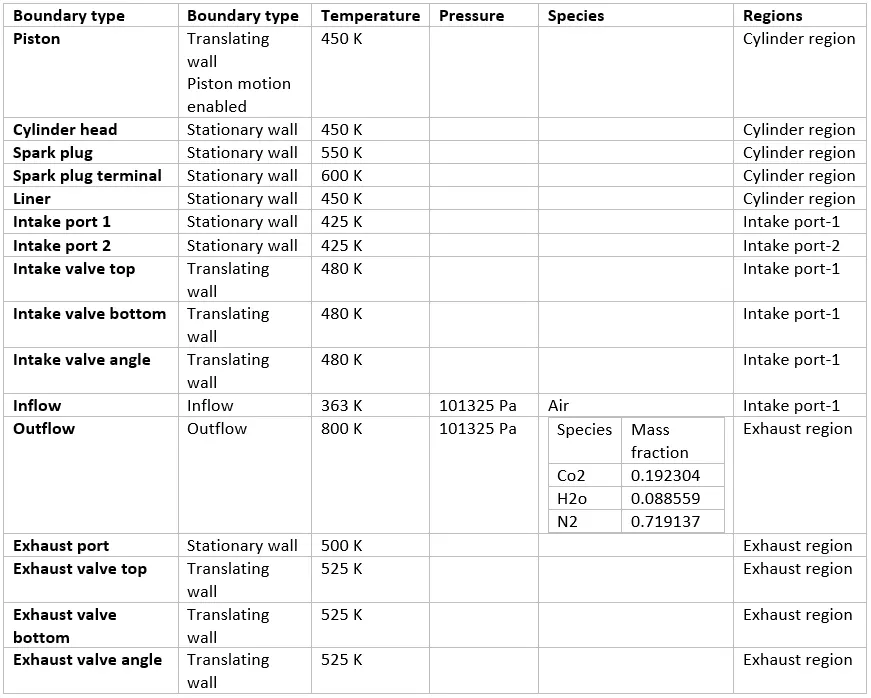
The boundary conditions for different parts of the PFI engine is specified as described in the above table. The piston boundary type is translating moving wall which follows the piston motion and its temperature is specified. And the motion of other translating wall boundaries such as intake valve top, intake valve bottom, intake valve angle and exhaust valve top, exhaust valve bottom, exhaust valve angle is described in the valve lift profile which is imported into the respective boundary as the input file. The wall temperture of the stationary wall boundaries is specified as described in the table. The air is added as the species at the inflow boundary, and Co2, N2, H20 species concentration is calculated according to the stoichiometric condition. Thus, the boundary conditions for different parts of the PFI engine is setup.
Regions and initialization
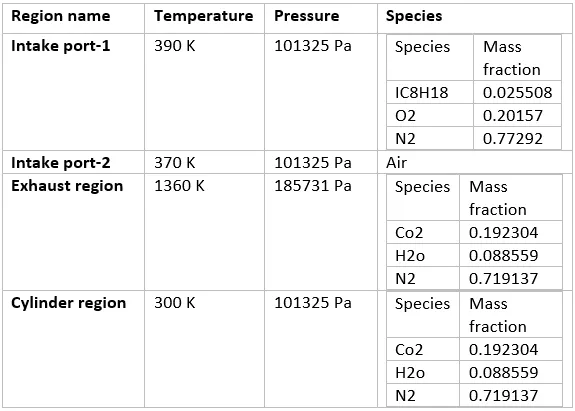
Four regions are created to provide initial conditions for CFD calculations. The intake port-1 is the region close to the combustion chambed where the fuel parcels are sprayed into the combustion chamber. The intake port-2 is the region where air is injected to mix with the fuel. The cylinder region is the region where the fuel is burnt and combustion process occurs. The exhaust region is the region where the unburnt fuel mass flows out through the exhaust valve.
Events
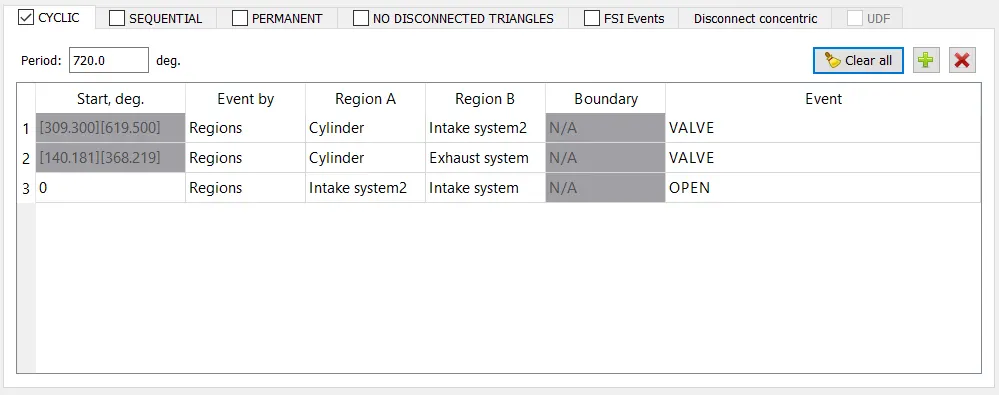
The converge software controls the flow between the two regions using events which activates or deactivates the disconnect triangles. The flow between two regions occurs when the disconnect triangles is activated and the flow is rectricted between two regions when the disconnect triangles is deactivated. The flow of fuel parcels from the intake port to the combustion chamber is contralled by valve event which activates the disconnect triangles between cylinder region and intake port-1 according to lift profile of the intake valves. The flow of unburnt fuel mass from the combustion chamber to exhaust port is controlled by the valve which activates the disconnect triangles between the cylinder region and exhaust region according to the lift profile of the exhaust valves. The intake port-1 and intake port-2 regions is set as open event which allows the proper mixing of air and fuel.
Spray modeling
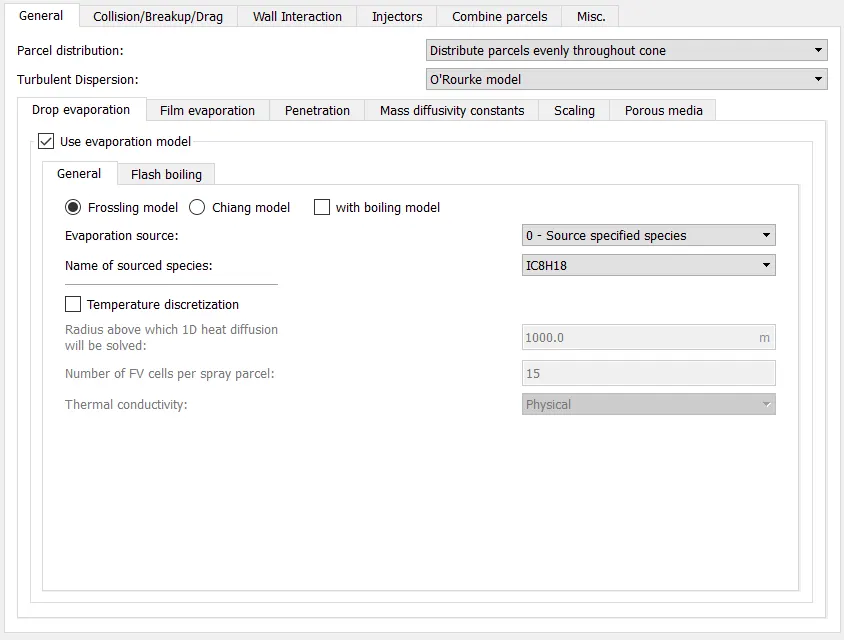
The simulation of spray accurately inside the IC engine is impossible as the time consumption to solve such equations is very high. Hence, spray modeling is used which helps in simulating the spray inside the IC engine with certain mathematical approximation. The converge uses eulerian solver for gaseous sparay and lagrangion solver for liquid spray. The converge assumes the spray to be conical and the parcel distributed evenly throughout the cone. The frossling model is used as evaporation model where the droplets are divided into a number of shperes to solve heat equation.
Collision/breakup/drag
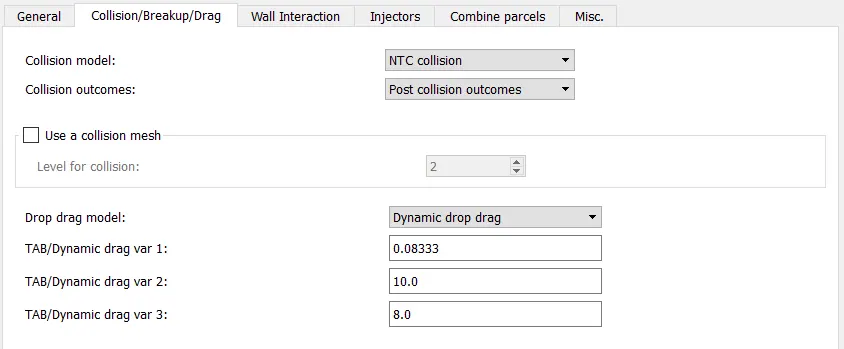
The NTC collision which is also known as no time counter method is used as the collision model which eshtimates the number of droplets and their outcomes. The collision mesh is used which enables the parcels to collide across the grid cells. During the injection process, the fuel experiences drag due to the presence of surrounding air, the drag effect is captured using the dynamic drag model.
Wall interaction
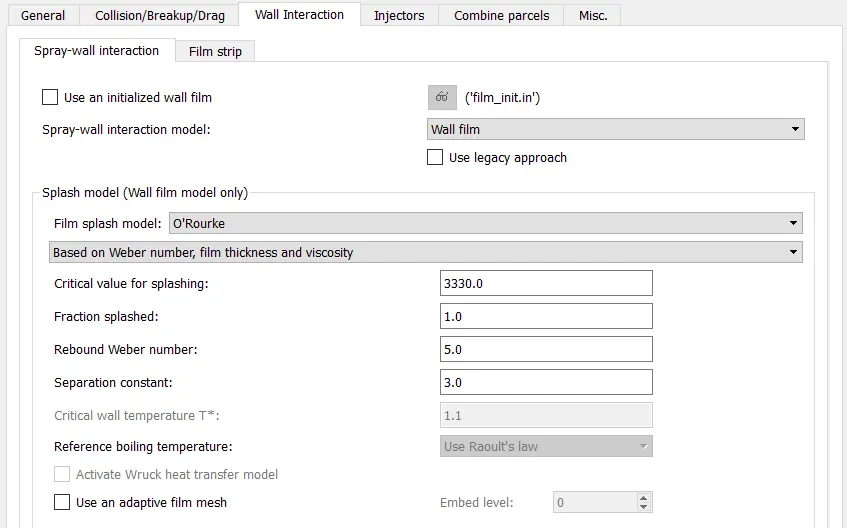
The interaction of liquid droplets with solid surface which is assumed to have certain thickness of film near its surface is captured by using the wall film model. The O'Rourke film splash model is used to capture the splash effects when the spray interacts with solid surface.
Injectors
Injector species
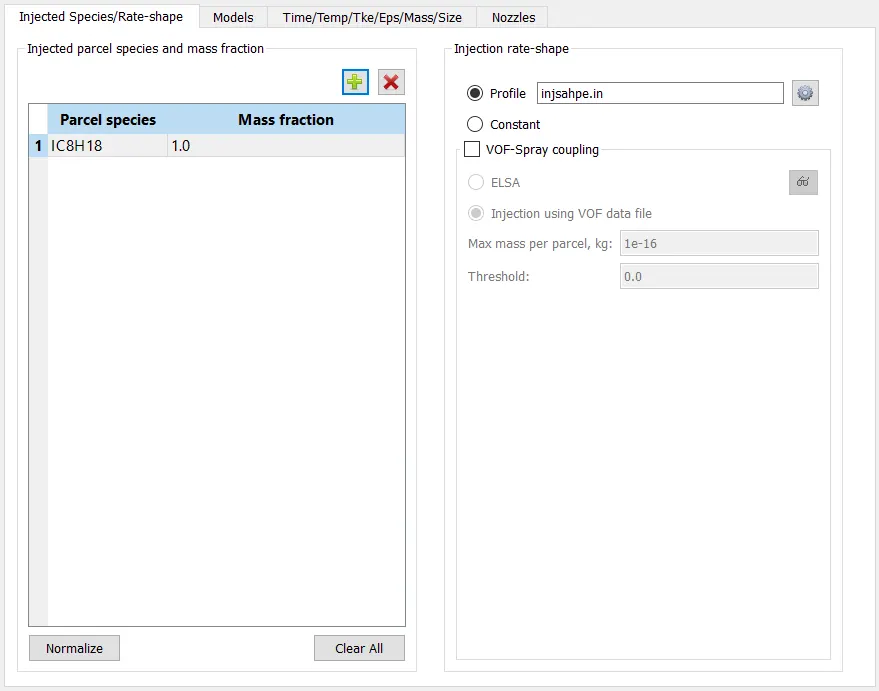
The parcel species IC8H18 with mass fraction 1 is specified as the parcel to be injected by the injector into the engine cylinder. The shape of the injector is described in the profile tab.
Injector profile and shape
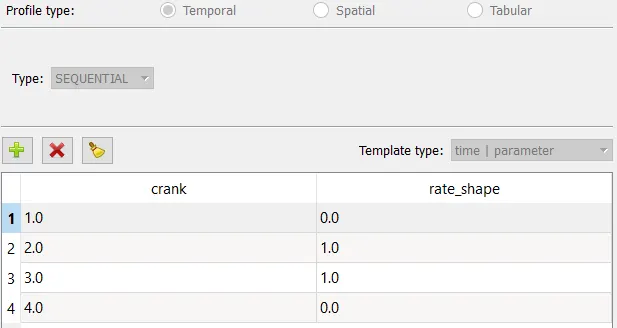
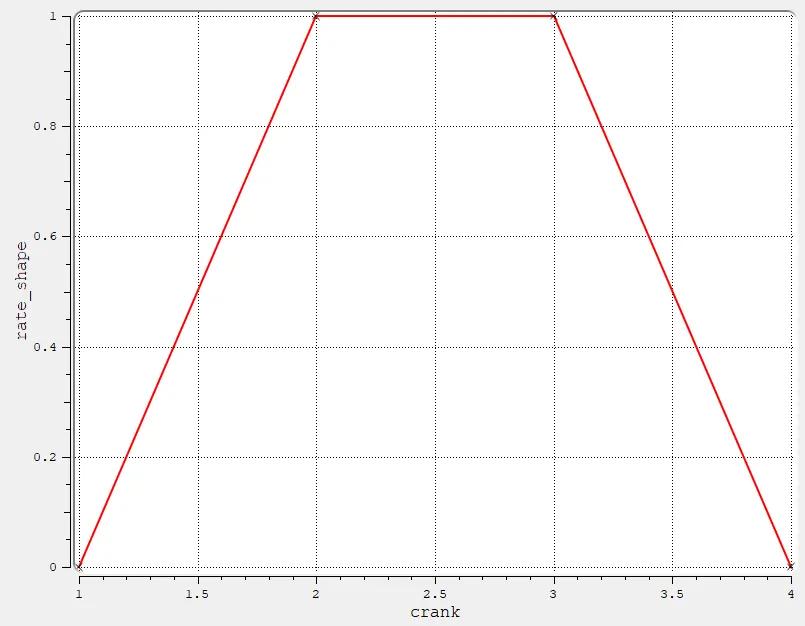
The injector rate shape is spcified according to the crank angle. The profile of the injector shape is described in the above graph. Trapezoidal injector rate shape is provided which injects the fuel mass according to the injector rate shape within specified time interval.
Injector models
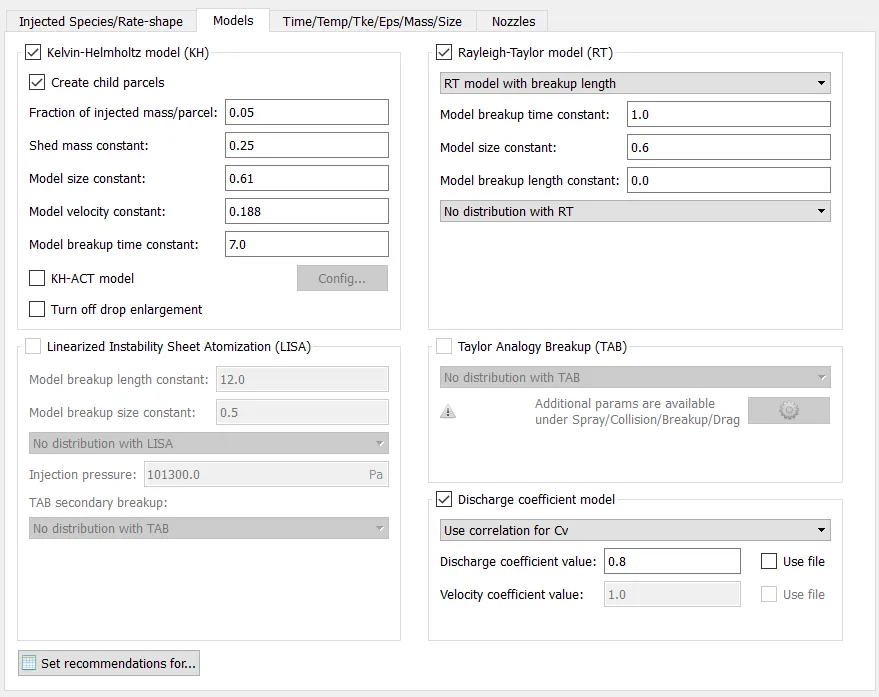
The kelvin helmholtz model and rayleigh taylor model is used as injector models which helps in predicting the size of fuel parcels. These models are used if the spray is solid cone and if the fuel used is either gasoline or diesel.
Injector time/temp/size
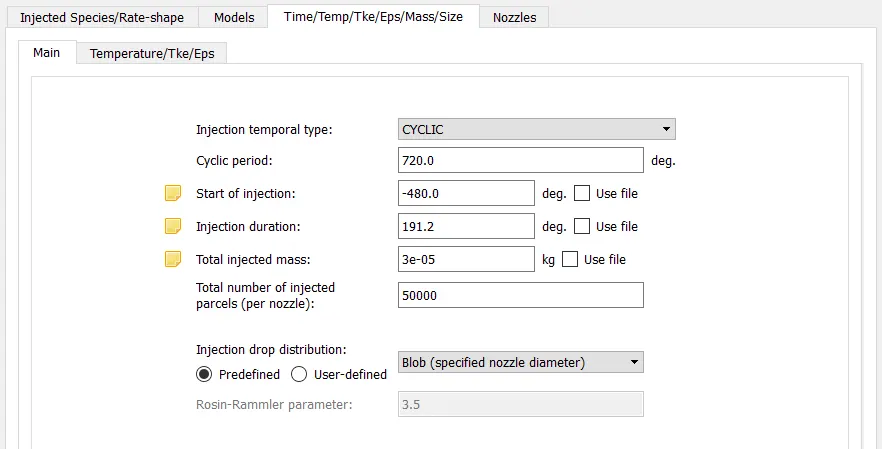
The start of injection and the duration of injection is specified as described in the above tab. The engine designers gives fuel flow rate and fuel mass injected per cycle has to be calculated.
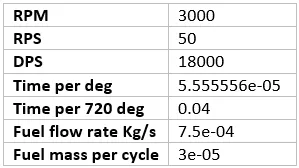
The fuel flow rate is given in terms of kg/s and is converted to fuel mass per cycle(720 deg) when the time taken for one complete cycle(720 deg) is multiplied with the fuel flow rate (in kg/s).
Nozzle parameters
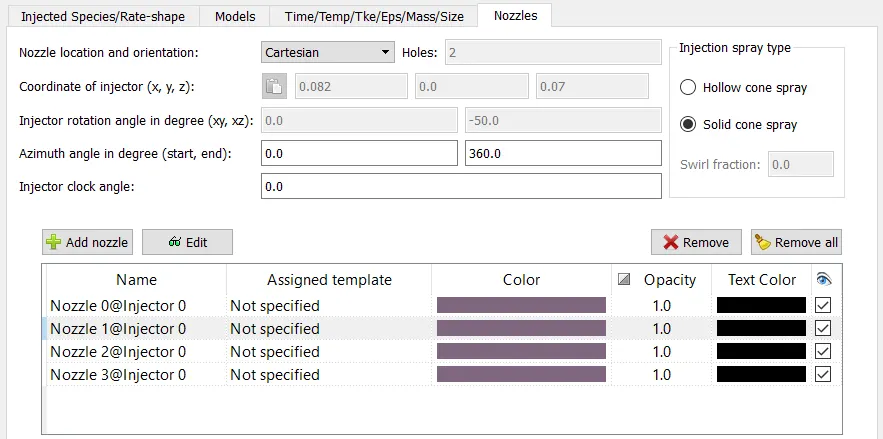
Nozzle diameter = 250e-06 m
Circulation injection radius = 125e-06 m
Spray angle = 10 deg
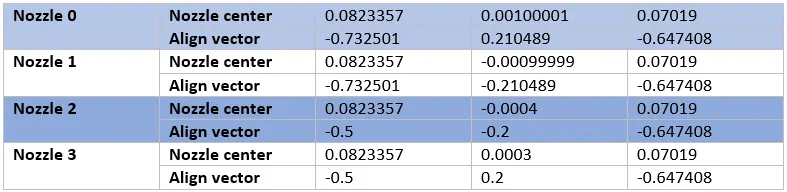
After completing the injector model setup, the nozzle location and orientation is specified. Four nozzles are assigned for spraying the fuel into the engine cylinder, and the parameters of nozzles like nozzle diameter, circulation radius is specified in the nozzle tab. The above table briefs about the location and orientation of the four nozzles.
Combustion modeling
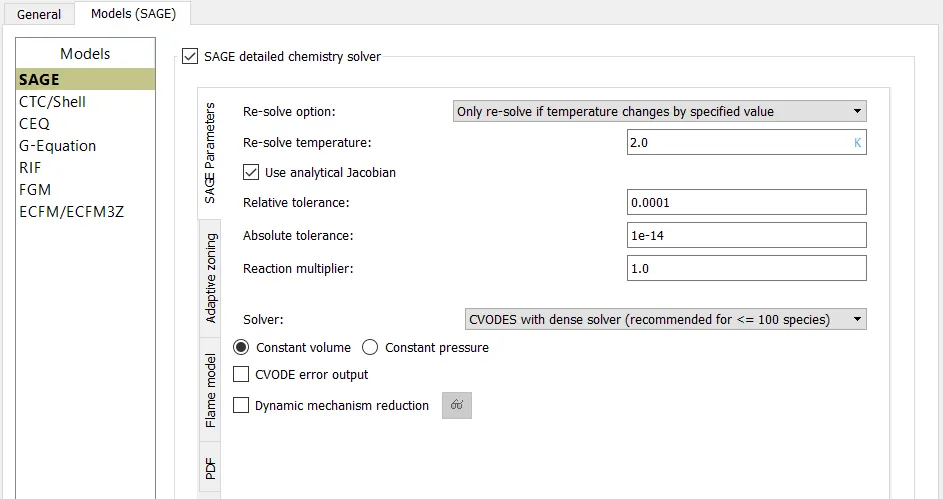
The combustion process produces mechanical power from chemical energy contained in the fuel. In order to capture the combustion process, the converge software needs to read a system of chemical rection of species. These chemical reaction mechanism of species is included in a file called mech.dat file in CHEMKIN format and is provided as the input file. Converge offers combustion modeling which reads these reaction mechanisms and solves the reaction rates of speacies. The SAGE detailed chemistry solver is one of the combustion models offered by the converge. This combustion model is the most predictive and accurate solver. The SAGE detailed chemistry solver ueses arrhenius rate law equation to calculate reaction rate. The converge reads mech.dat file which contains reaction mechanism and values of terms in arrhenius equation. These equations are in the form of a system of ODEs which is provided as the source term to the species transport equation which further predicts the physical behaviour of the species in the domain.
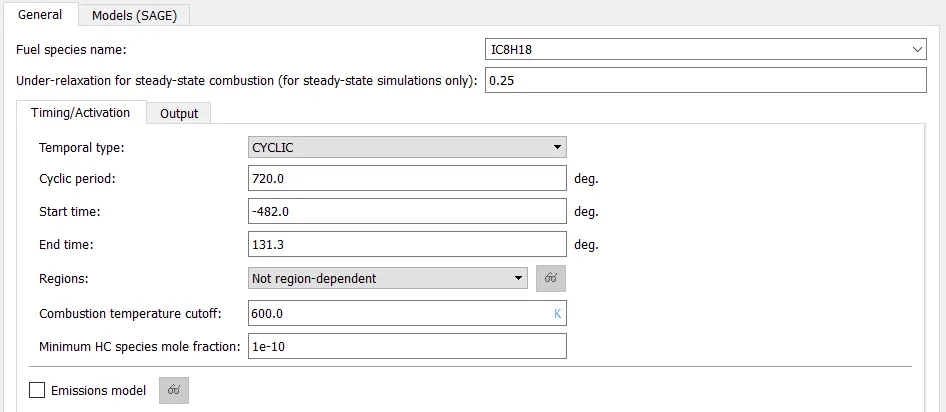
In general tab settings of combustion model, the species name, start time and end time of the combustion, and specific regions where the chemical solver needs to solve reaction rate to decrease the computation effort, minimum hydrocarbon species mole fraction is defined.
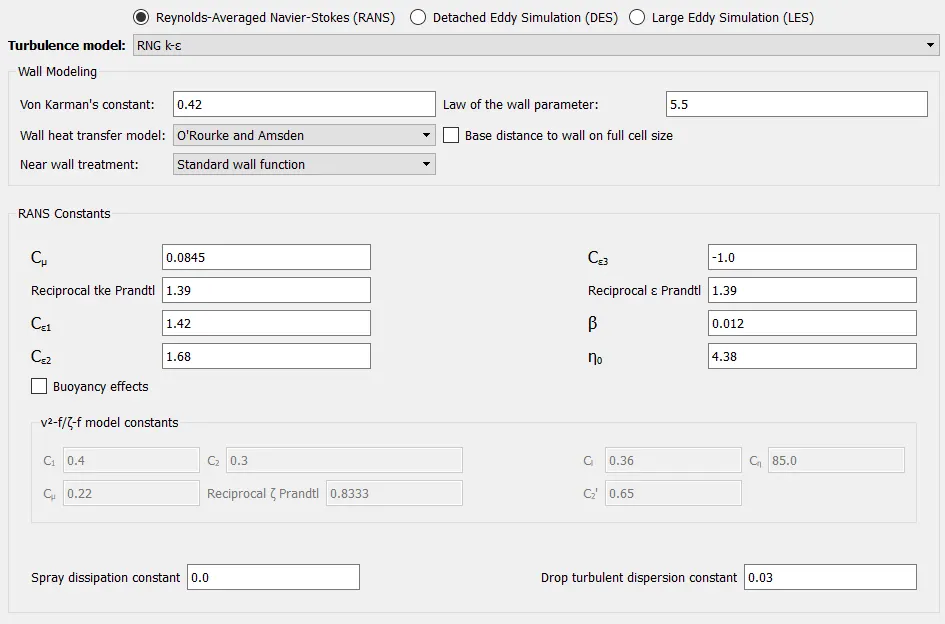
Turbulence modeling
Source/sink modeling
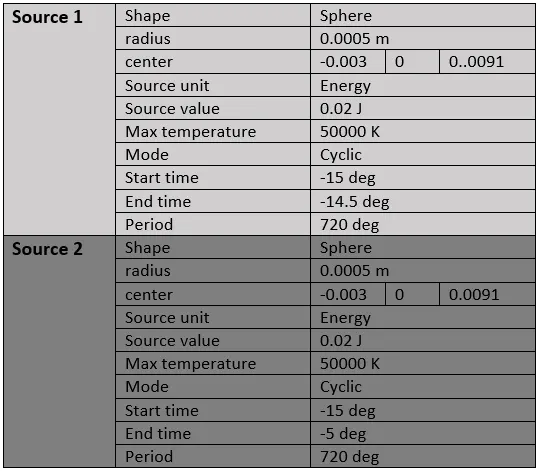
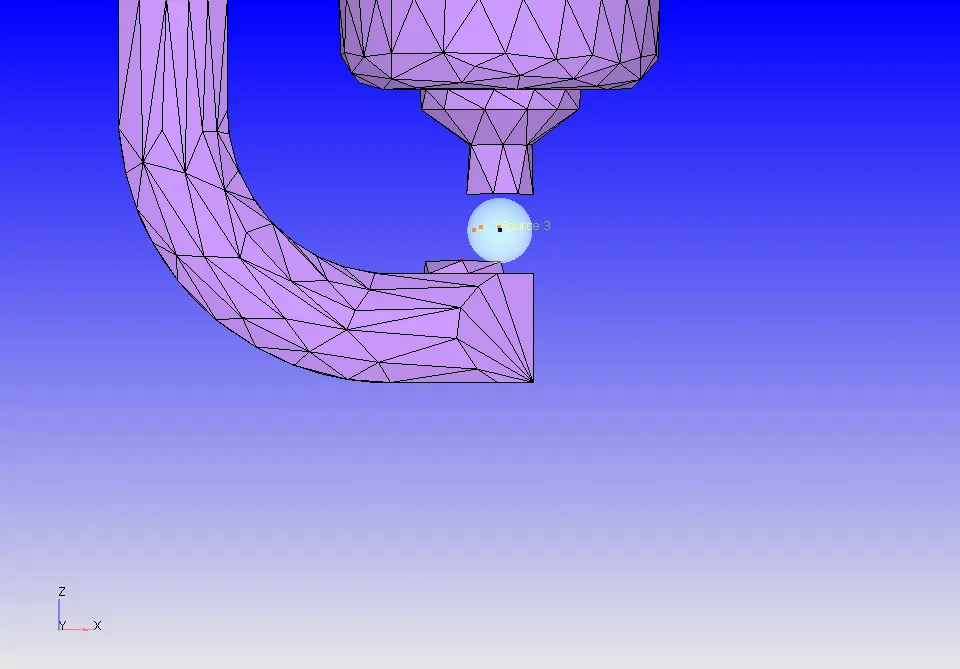
In IC engines, the spark plug ignites the fuel to start the combustion process. In order to change the fuel temperature two energy type source terms are added. These engery source terms are responsible for temperature change of the species in the species transport equation.
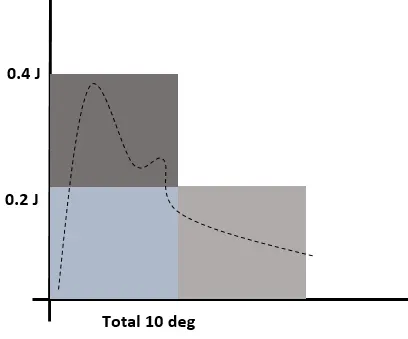
The black dotted curve in above graph describes the spark ignition duration or sprak behaviour in the typical IC engines. The spark behaviour is broken into three phases, breakdown phase where high energy is transfered to the species for a short duration of time which increases its temperature and fuel is burned, in arc phase and glow phase lower energy is provided to propagate the combustion process. The first energy source gives out 0.4 J of energy for 0.5 degrees of time which changes the temperature of the species in species transport equation and the second energy source term gives out 0.2 J of energy for 9.5 degrees of time to keep up the combustion process.
Grid control
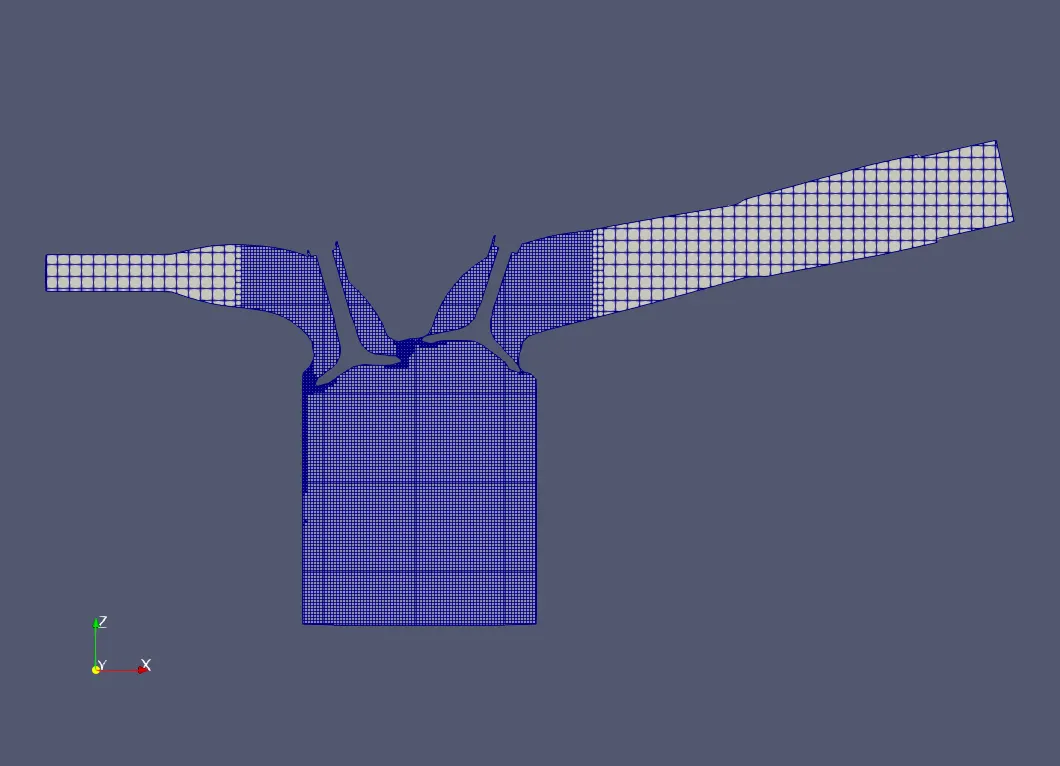
Base grid size dx=dy=dz= 0.004 m
Fixed embedding
1) Cylinder shaped embedding
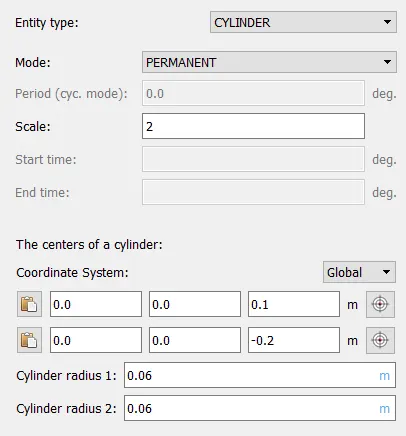
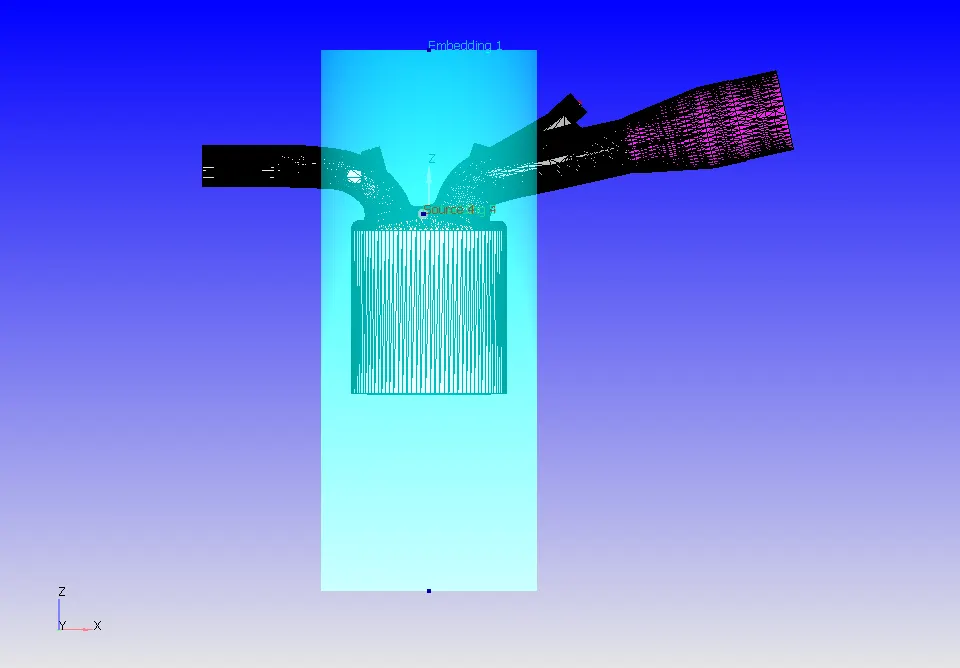
The flow fuel parcels near the valves has to captured accurately and the change of species temperature in the cylinder region during combustion has to captured to model the combustion process hence, the cyinder shaped fixed embedding with embed scale equal to 2 is used to refine the grid size in the combustion chamber(cylinder of engine) and cells near the the intake valves and exhaust valves. The size of refined grid is given by the formula,
refined cell size = base grid size/2^embed scale = 0.004/2^(2) = 0.001 m
2) Fixed embedding near intake valve angle
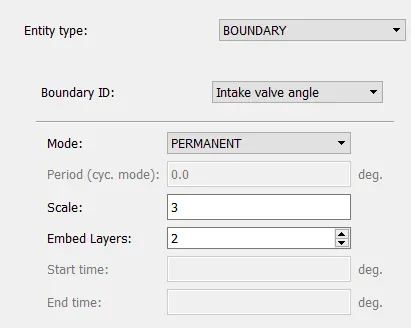
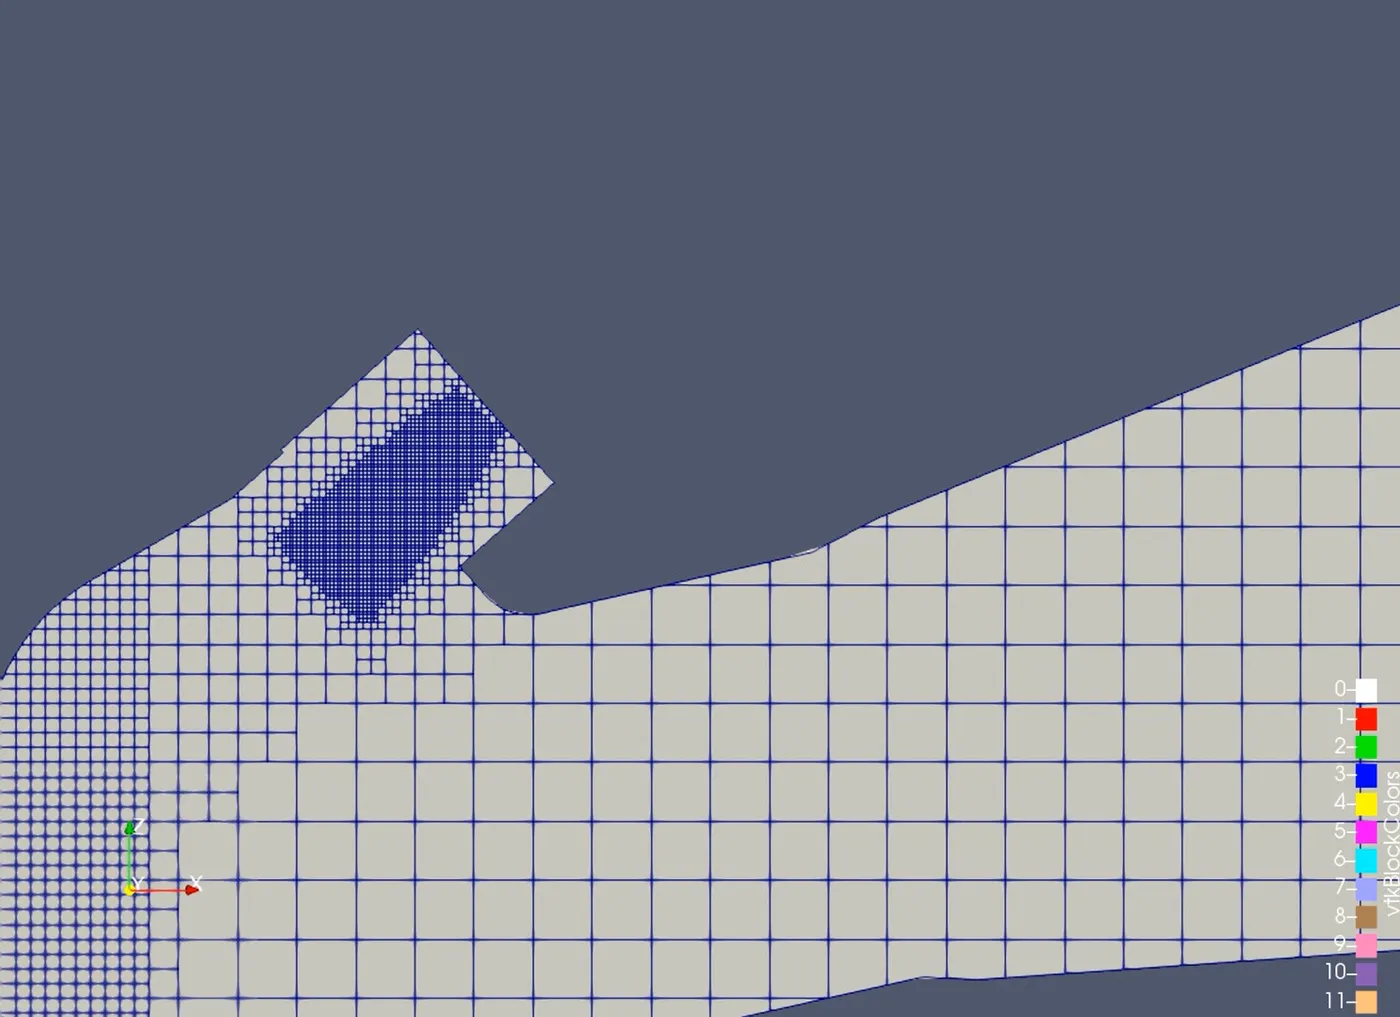
The fuel parcels flowing from the nozzle into the engine cylinder has to captured correctly which helps in proper mixing of fuel air and hence, further refinement of grids near intake valve angle boundary is done with embed scale of 3 and 2 embed layers. The size of the refined grids near intake valve angle is given by,
refined cell size = base grid size/2^embed scale = 0.004/2^(3) = 0.0006 m
3) Fixed embedding near exhaust valve angle
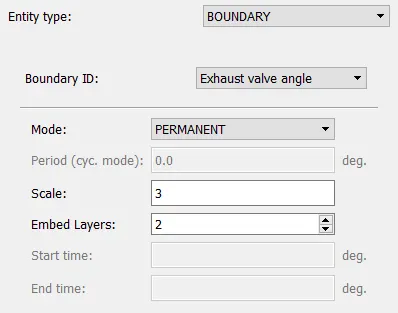
To capture the unburnt species near the exhaust valve, further refinement is done with embed scale of 3 and embed layers of 2. The refined grid size near exhaust valve angle is given by,
refined cell size = base grid size/2^embed scale = 0.004/2^(3) = 0.0006 m
4) Sphere embedding 2
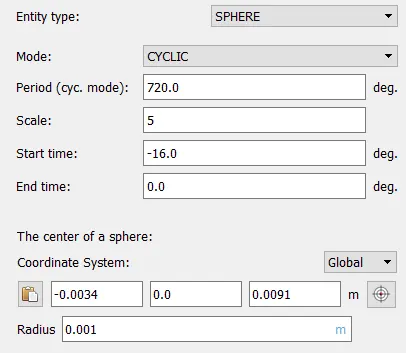
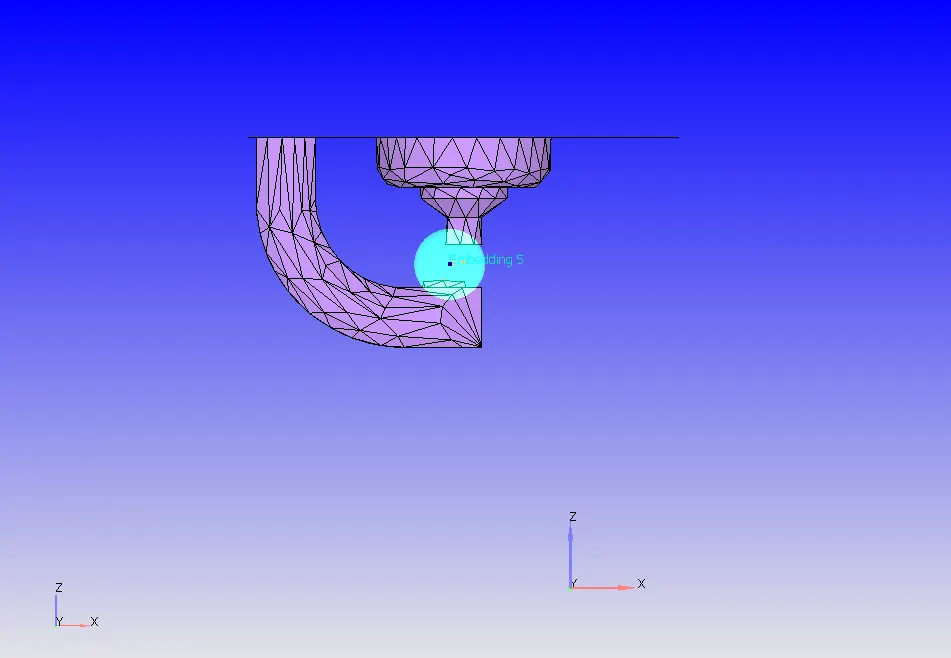
5) Sphere embedding 1
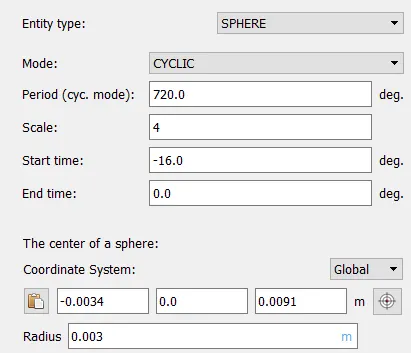
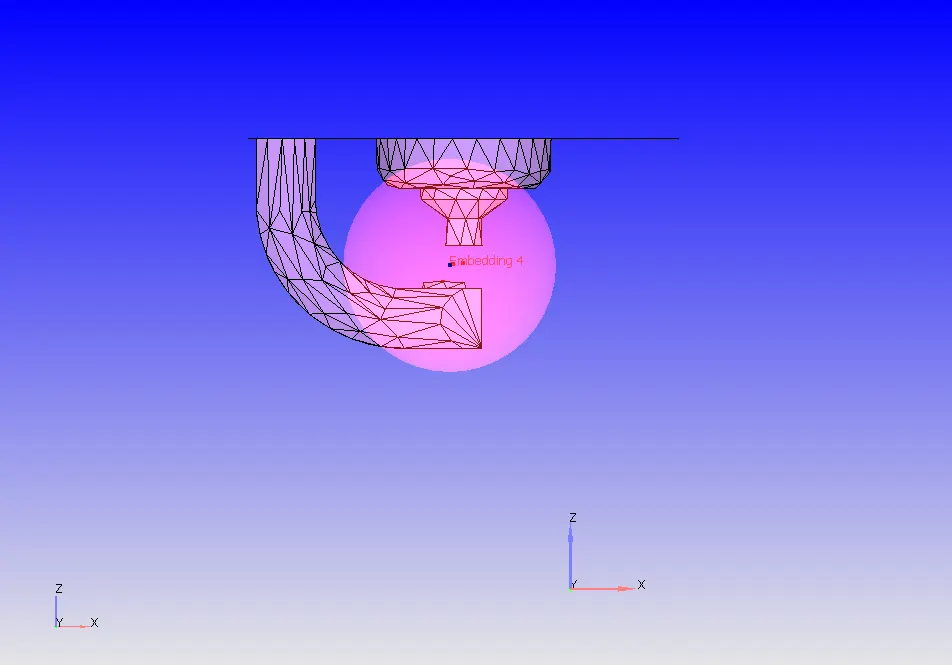
In order to combust the species in the engine cylinder, less numerical diffusion is required in the region where energy source is defined hence, two sphere shaped embedding near the spark plug terminal is done to capture the energy dissipation from the energy source term to the species in the cylinder region. These refined grids near energy source lasts only for certain duration of time which is specified in embed settings. These refined grids also help in calculating the temperature gradients which is further used by adaptive mesh refinement for generating more refined grids.
6) Injector embdding
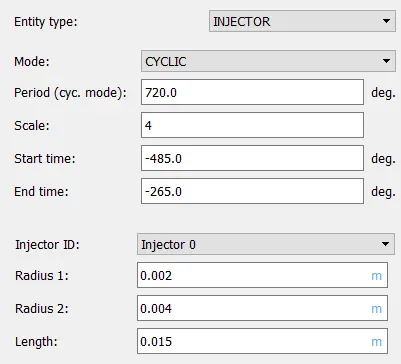
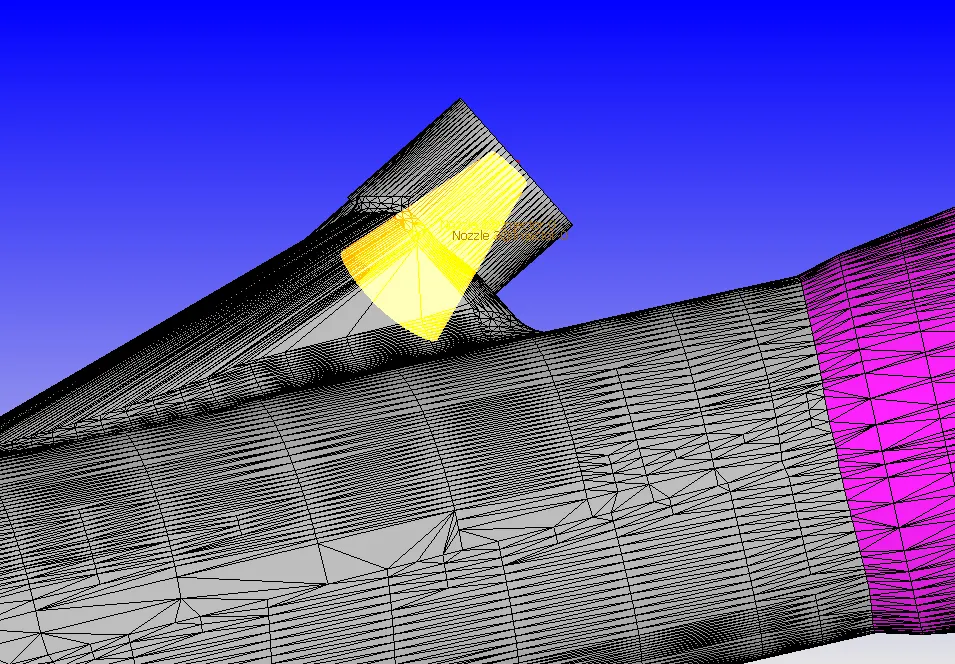
The injector embedding is used to refine the grids near the injector nozzle for a specified duration of time. The initial derivatives near the injector needs to be calculated so that further calculation is done by the adaptive mesh refinement. Hence, the refinement in the injector region.
Adaptive mesh refinement
1) Veocity AMR
2) Temperature AMR
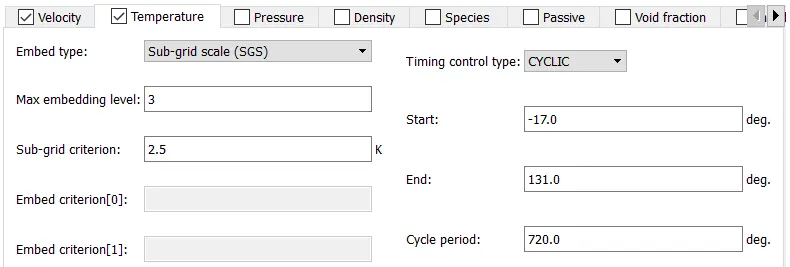
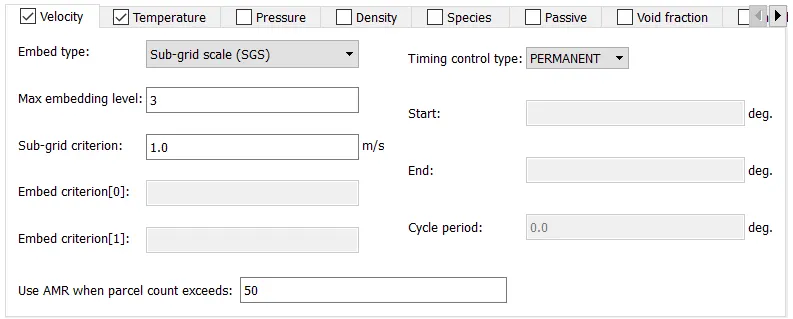
The adaptive mesh refinement is used to refine grids automatically based on the fluctuating and moving conditions such as velocity and temperature. The fuel-air mixture gets burnt as the energy source dissipates heat energy and flame propagates across the combustion chamber. The flame propagation causes high velocity flow of species and also causes rapid increase in the species temperature. These fluctuations of velocity and temperature causes gradient formation which is detected by the AMR(adaptive mesh refinement) and it refines the grid automatically so that simulation is not slowed down. The temperature AMR with 3 embed level and sub-grid scale of 2.5K starts at the spark ignition time and ends at the end of combustion process. The velocity AMR is permanent with embed level of 3 and sub-grid-scale of 1m/s. The size of the cells in scaled grid is given by,
Scaled grid size = Base grid size/2^max embed level
Scaled grid size in velocity AMR = 0.004/2^(3) = 0.0006 m.
Scaled grid size in Temperature AMR = 0.004/2^(3) = 0.0006 m.
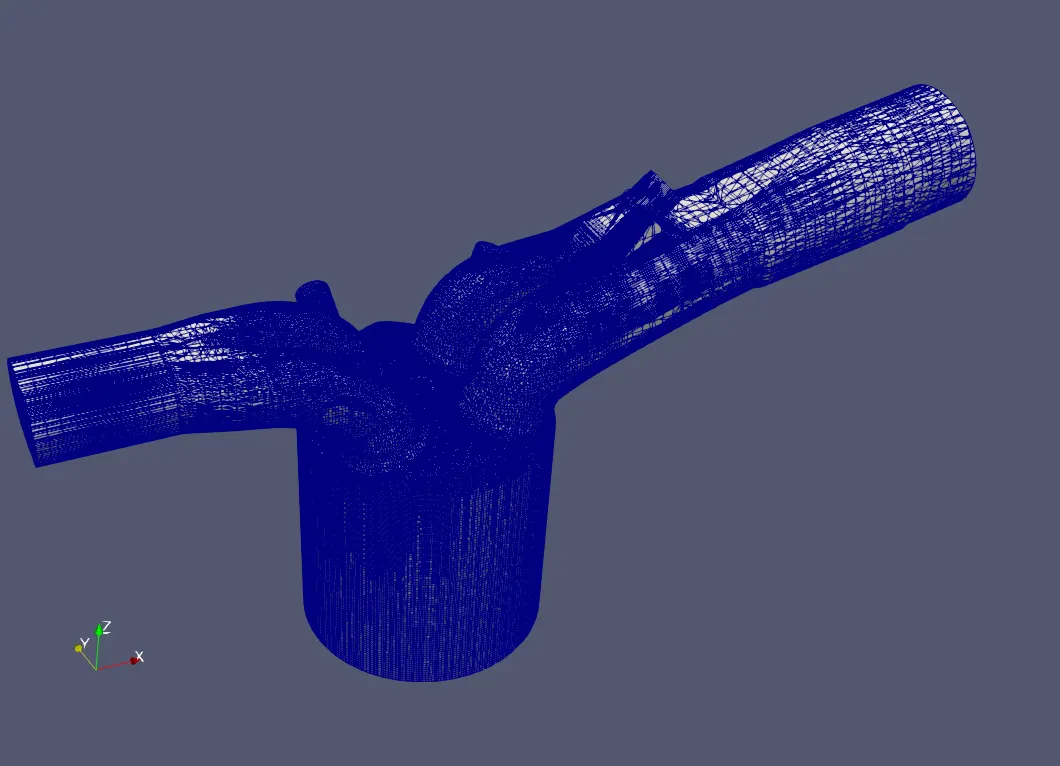
Mesh generated

Results:
Animation of fuel injection and temperature change of species
Pressure plot
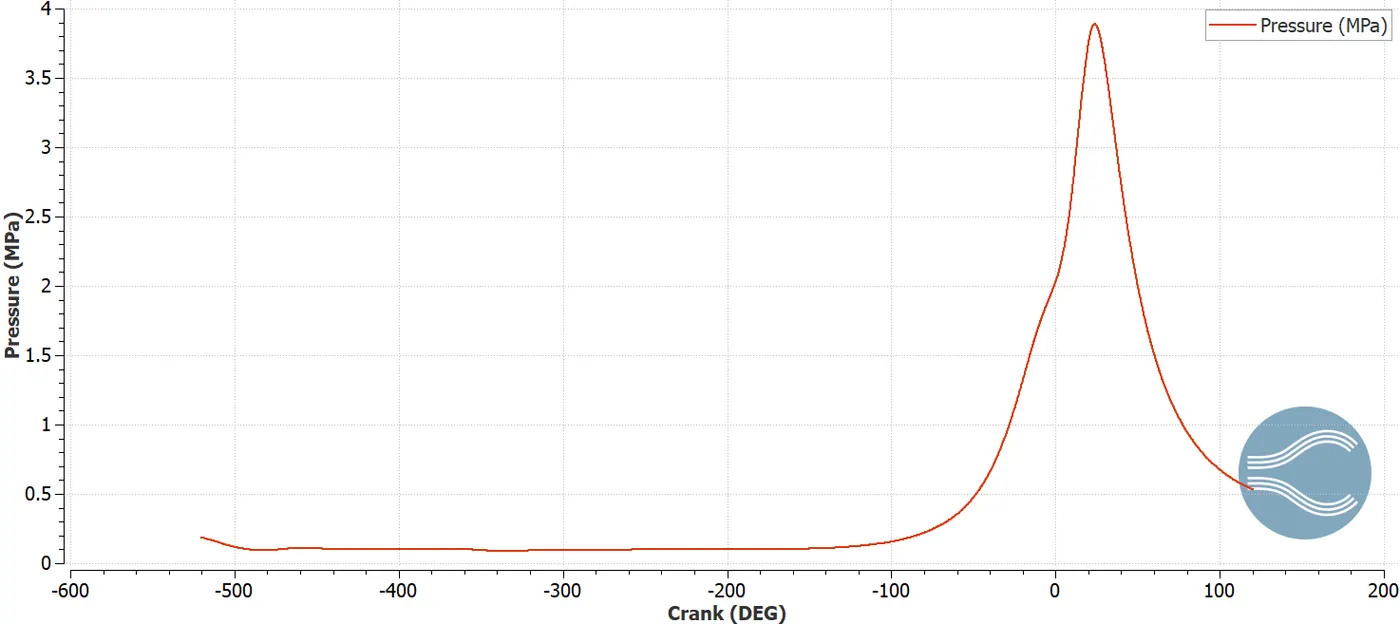
From the above pressure plot in the engine cylinder, almost constant pressure is observed which is due to compression and a sudden rise of pressure is observed which indicates that combustion process has started and drop in pressure occurs due to expansion.
Mean temperature
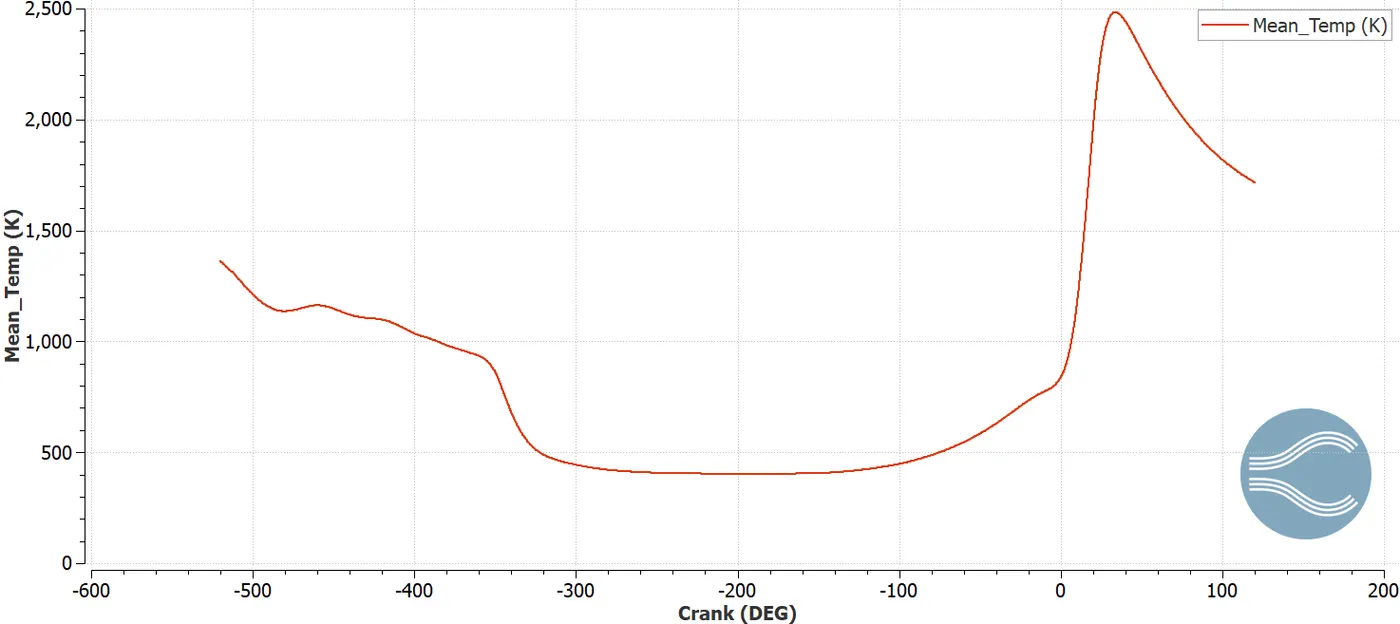
The above plot shows the mean temperature in the engine cylinder. It can be seen that a peak temperature of 2477 K is achieved in the combustion chamber. This data is very useful for further thermal analysis in softwares like Ansys.
Volume of cylinder
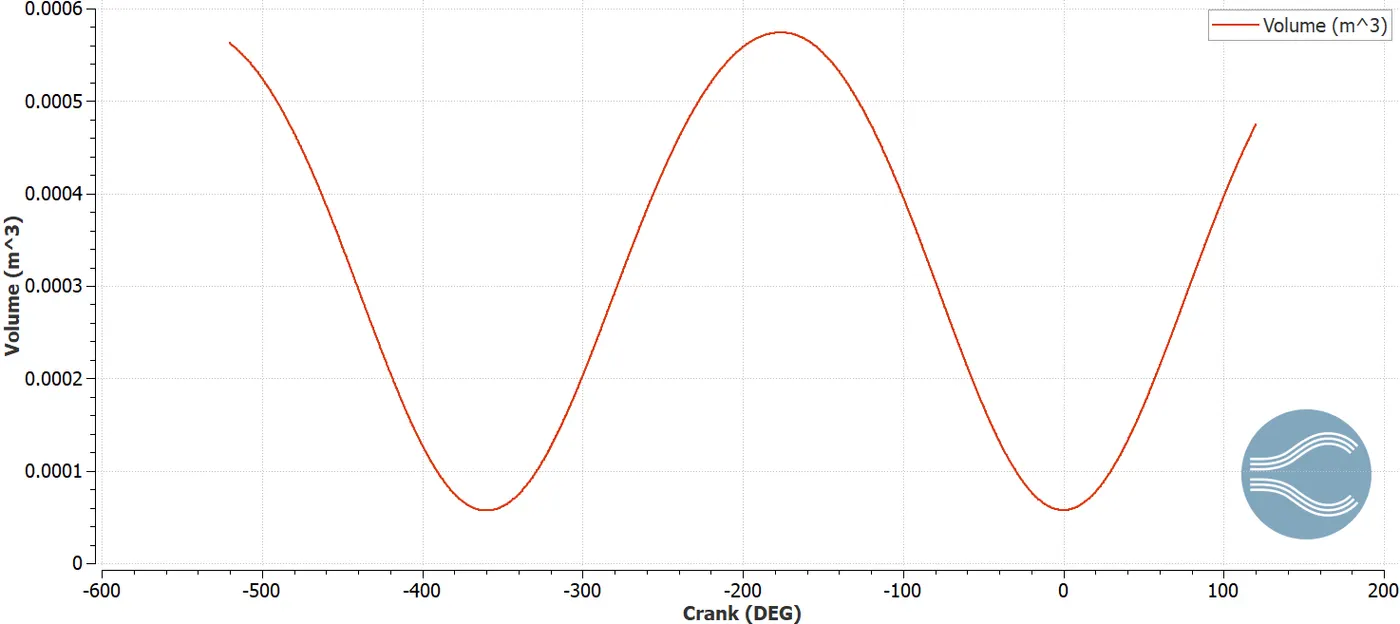
The above plot shows the change of engine cylinder volume as the piston translates from top-dead-center to bottom-dead-center. The minimum volume is the clearance volume and maximum volume is nothing but the volume swept by the piston plus clearance volume. From the graph it can seen that maximum volume is equal to 0.000574121 m^3 and minimum volume is equal to 0.0000575789 m^3. The ratio of maximum volume to the minimum volume gives the compression ratio of the engine.
Mass trapped in cylinder
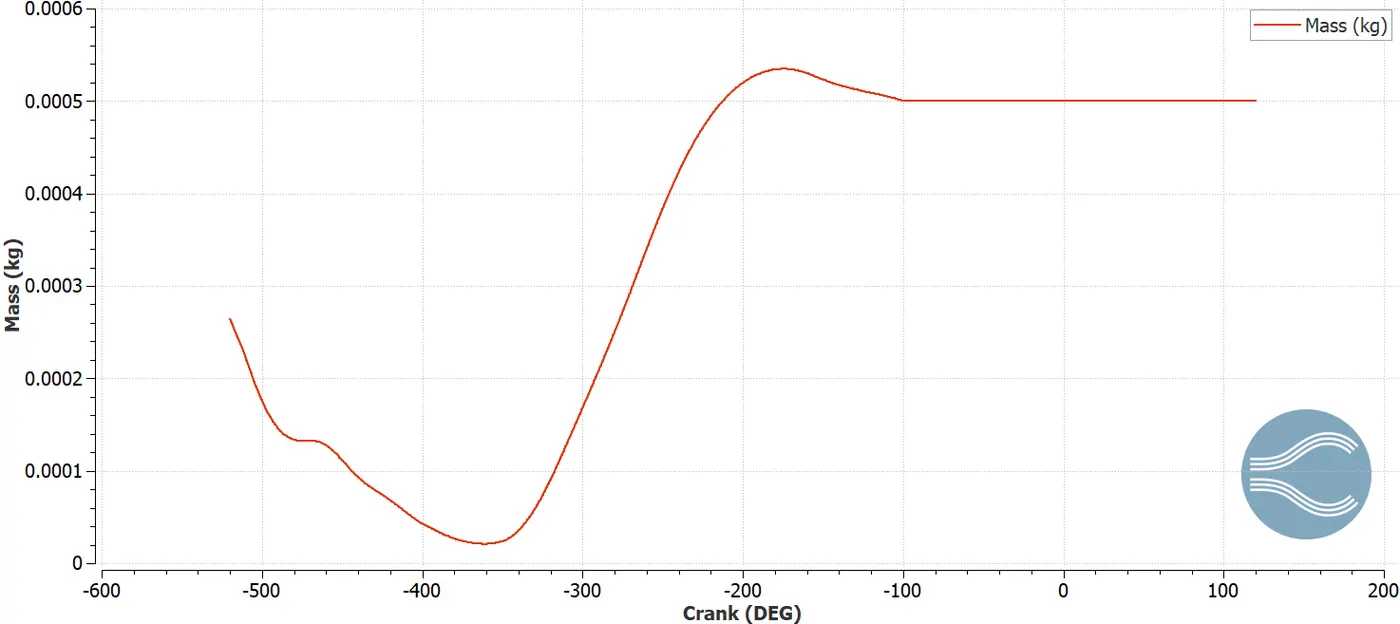
The above plot shows the variation of mass with respect to crank angles. It can be seen that the constant mass is the trapped mass.
Density change in cylinder
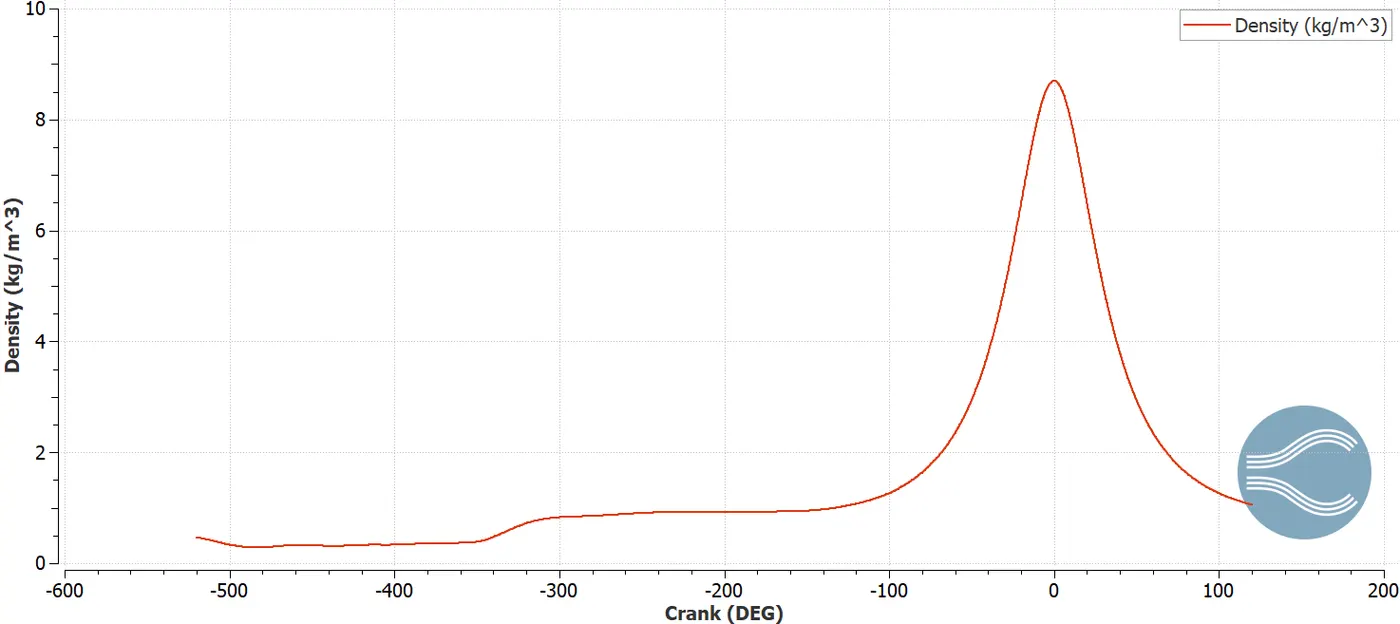
The above plot shows the change of density for different crank angles. It is observed that the density plot profile and pressure plot profile is almost similar. Thus, the density changes as a function of crank angle and depends on the pressure.
Heat release rate plot in cylinder
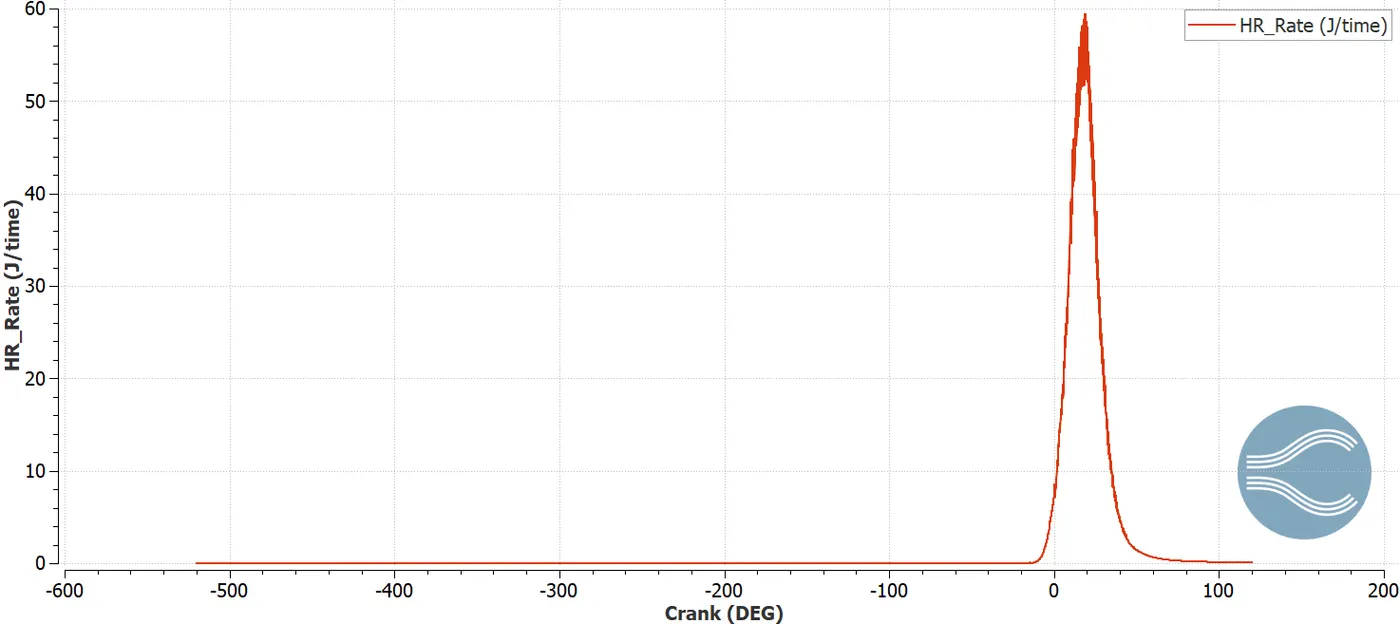
The above plot shows the total amount of heat released per crank angle. From the plot it is observed that maximum heat of 52.89 J is releases at 17.9 crank angle.
Integrated heat release plot in cylinder
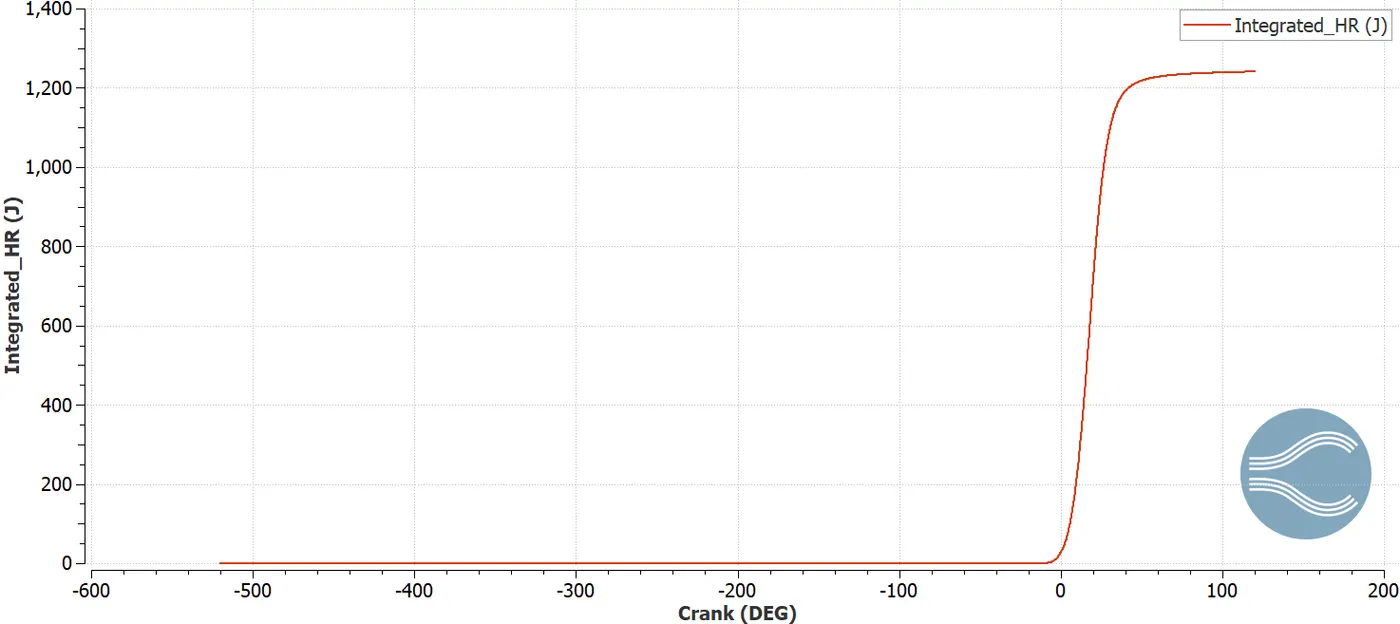
The above shows the integration of the heat released during the combustion process which is nothing but total amount of energy released by the engine. From the above plot, it can be seen that total amount of energy released by the engine is equal to 1241.06 J.
IC8H18 flow in cylinder
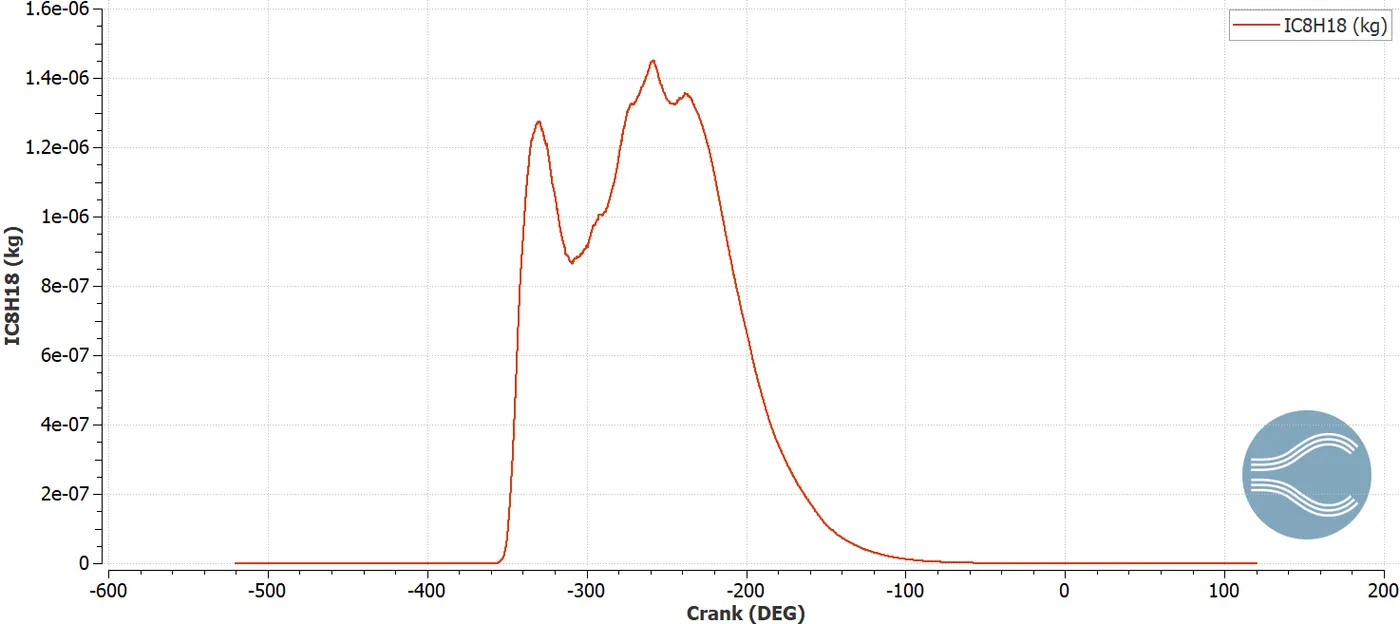
The above plot shows the variation IC8H18 mass in the engine cylinder for different crank angles. The plot shows sudden rise in the IC8H18 mass concentration when it is sprayed into engine cyinder and later fluctuation is observed which indicates the burning of species due to combustion and finaly there is sudden drop in the mass concentration which is due the vaporization. From the is observed that the mass concentration of IC8H18 reaches zero value which indicates complete combustion.
IC8H18 flow in intake port
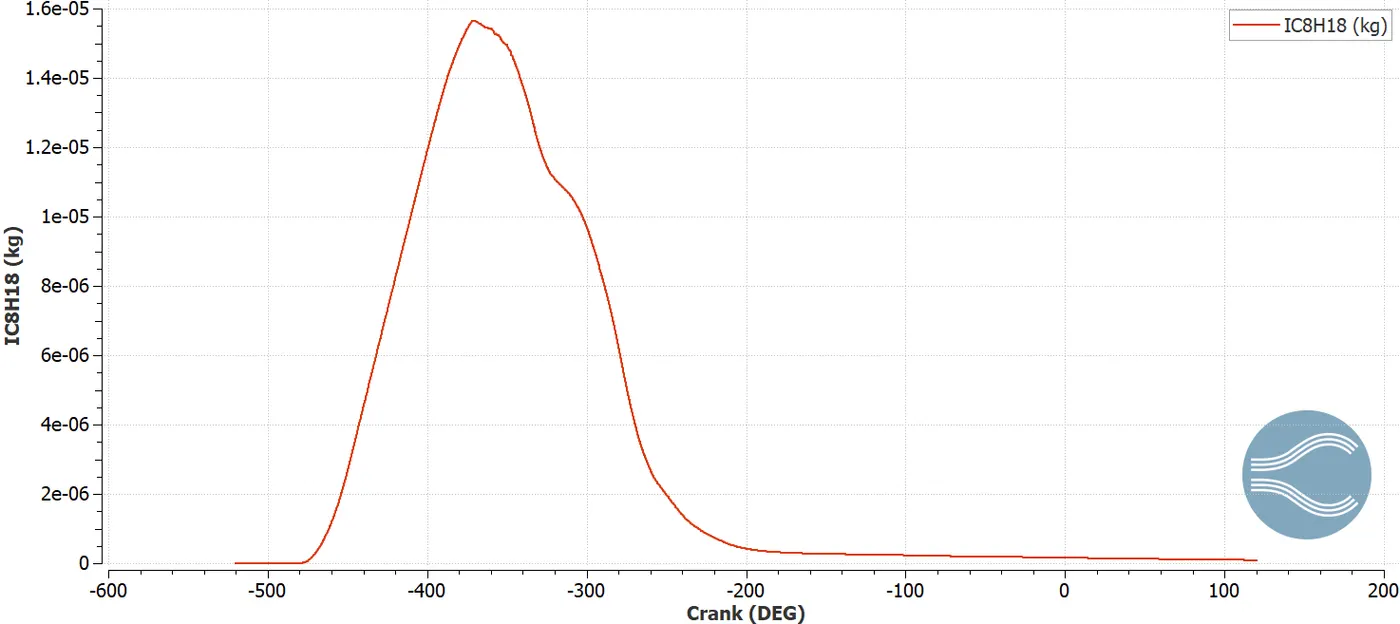
The above plot shows the mass flow rate of species IC8H18 for different crank angles. The species mass concentration decreases as it is sprayed into the engine cylinder. From the plot it can be seen that the almost 9.35e-08 Kg of IC9H18 is trapped inside the intake port.
Liquid spray drop plot in the cylinder
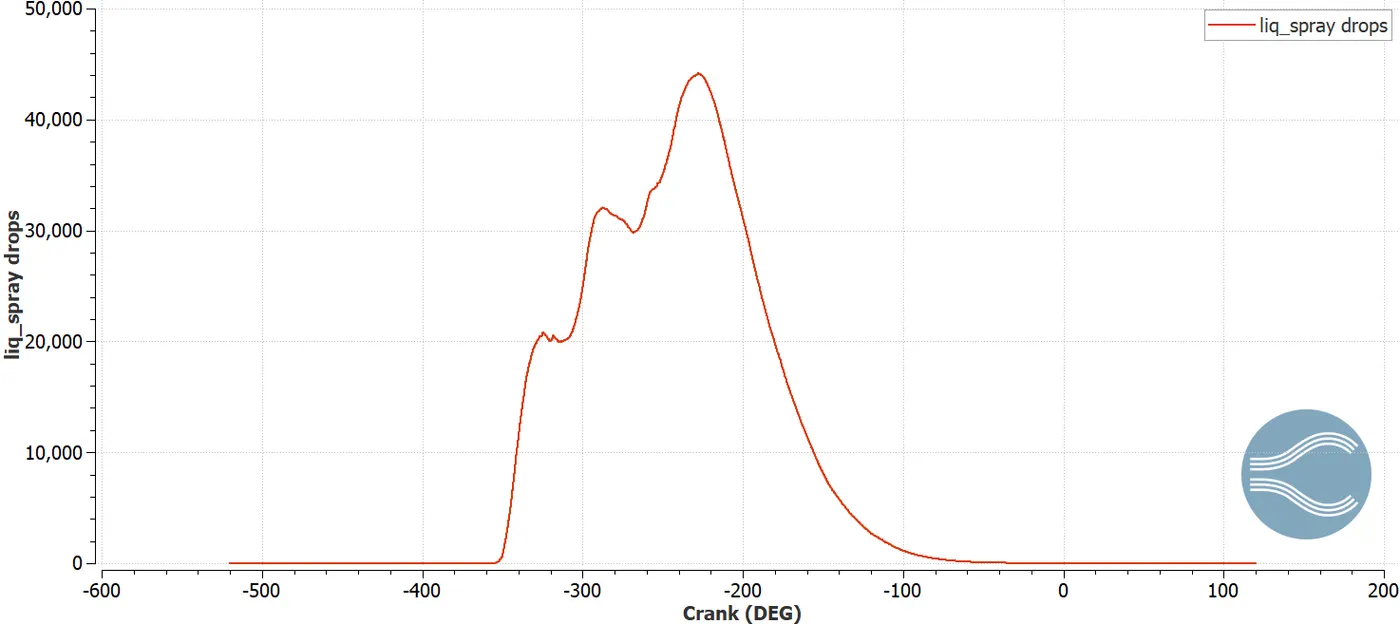
The above plot shows the variation of liquid spray droplets which is also known as lagrangian fluids with respect to crank angles. It is observed that almost 40,000 drop parcels are sprayed into the cylinder which indicated by the peak of the graph and later due to vaporization the parcels of lagrangian fluid drops.
Hiroy soot plot
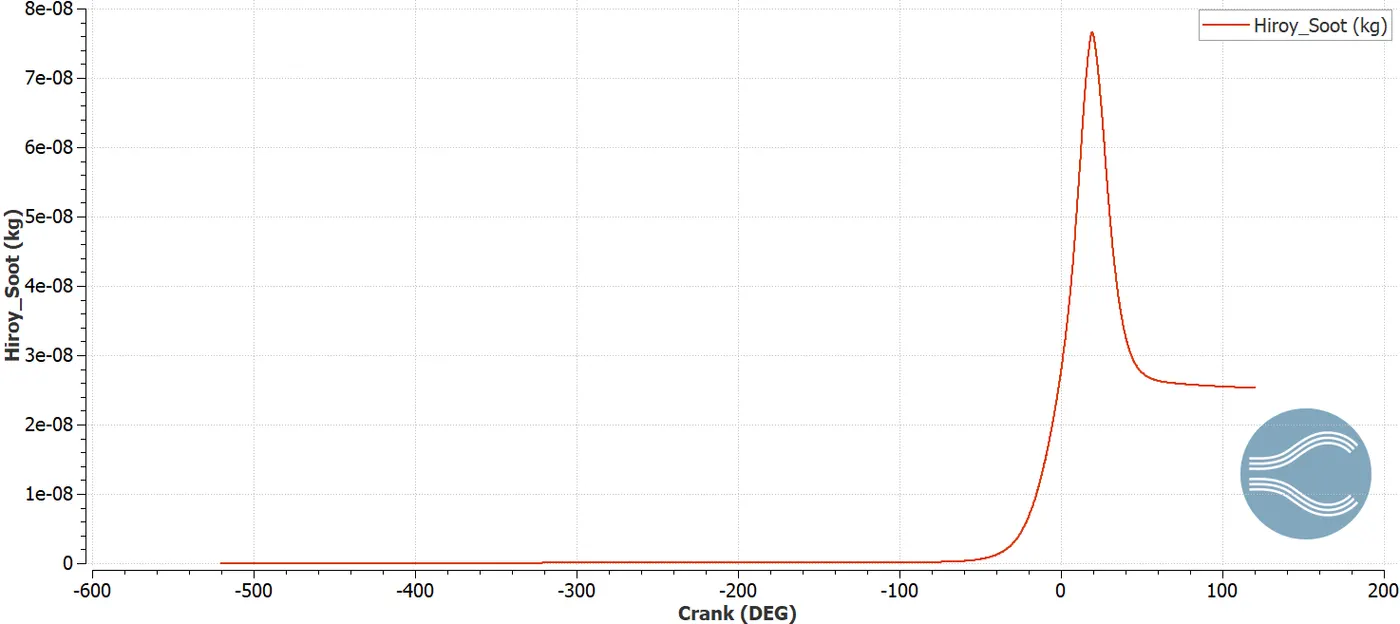
The above plot shows the pollutant soot formation during combustion process. There is increase in mass concentration of soot during combustion process indicated by the peak in the plot and later mass concentration decreases in the engine cylinder as the pollutant soot is passed through exhaust valve.
NOx plot
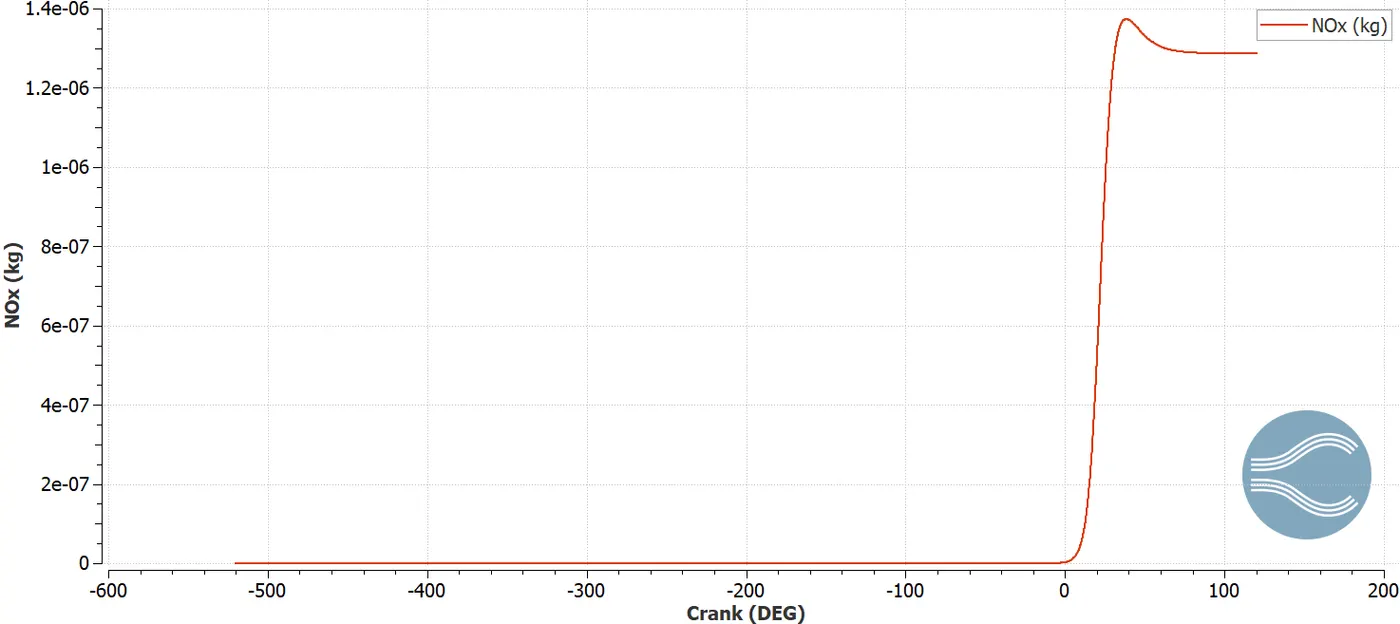
The above plot shows the pollutant NOx formation at different crank angles in the engine cylinder. The NOx is nothing but the oxides of nitrogen formed during combustion process.
Co plot
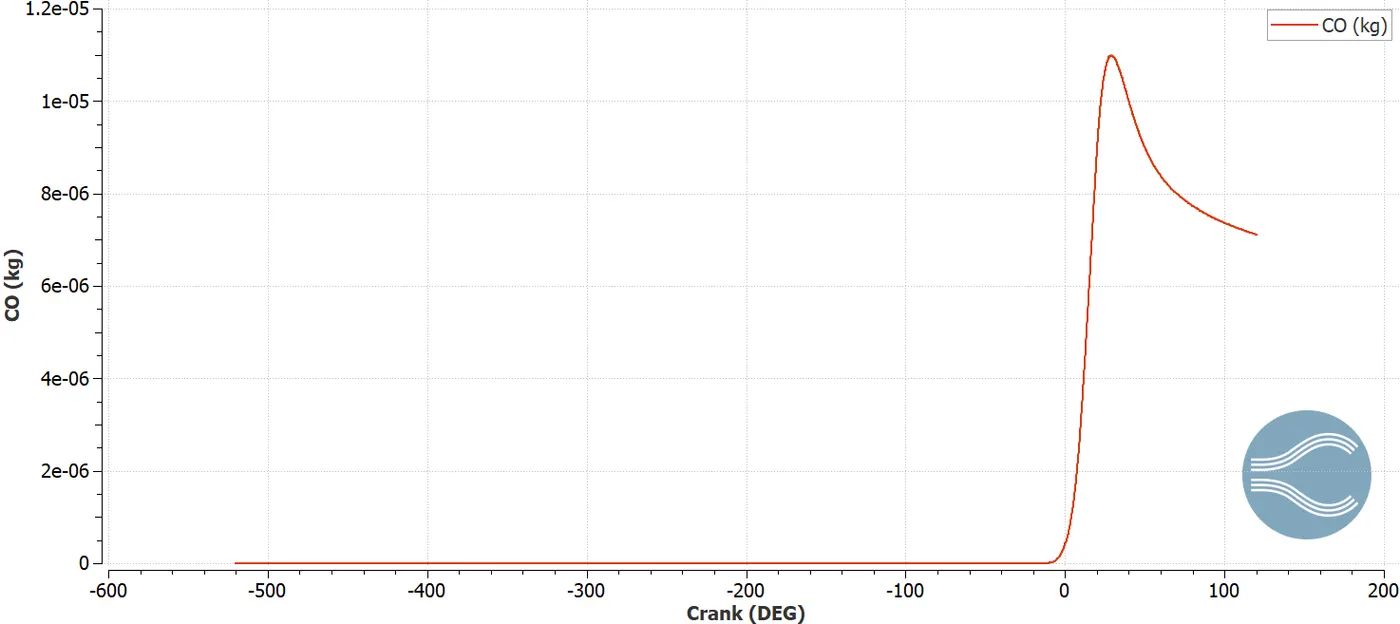
The above plot shows the formation of pollutant Co (carbon mooxide) at different crank angles.
Calculation of some engine parameters
1. Compression ratio of the given PFI engine:
Compression ratio = (swept volume + clearance volume) / (clearance volume) = Max volume/Min volume
Frpm the volume of cylinder plot,
Max volume of cylinder = 0.000574121 m^3
Min volume of cylinder = 0.0000575786 m^3
Thus, compression ratio = (0.000574121)/(0.0000575786) = 9.971
2. Combustion efficiency of the given PFI engine:
Combustion efficiency = (Total energy released by burnt fuel / theoretical energy content of fuel per cycle)*100
The integration of heat released plot gives the total energy released by the burnt fuel. From the integration of heat release plot,
Total energy released by burnt fuel = 1241.06 J
The theoretical energy content of the fuel is equal to the fuel mass flow rate per cycle multiplied with lower heat value of the fuel.
Theoretical energy content of fuel = (0.00003 Kg)*(43.44 MJ/Kg) = 1303.2 J
Thus, combustion efficiency = (1241.06 J/1303.2 J)*100 = (0.9524) = 95.24%
3. Determining the power and torque of the given PFI engine using engine performance calculator in converge software
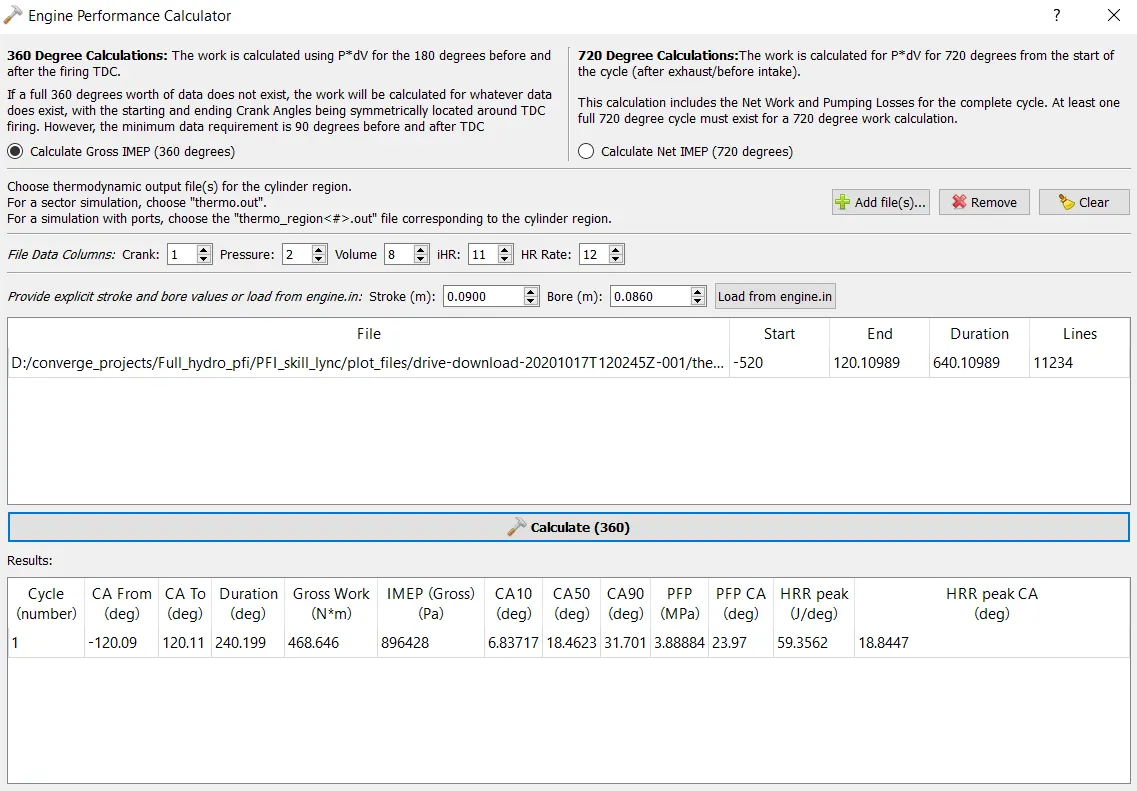
From the engine performance calculator,
Work done = 468.646 N-m
Combustion duration = 240.199 deg
Crank speed(N) = 3000 RPM = 50 RPS
Number of degrees per second = 18000 DPS
Time for one degree = 5.555556e-05 seconds
Time taken for combustion = 5.555556e-05*240.199 = 0.01334 seconds
Power = work done/time taken for combustion = 468.646/0.01334 = 35.13 KW
Torque = Power*60/2*pi*N = 35130*60/2*pi*3000 = 111.822 N-m
Why do we need heat transfer model? Why can't we predict the wall temperature from the CFD simulation?
In CFD simulation of PFI engine, the thermodynamic data of the species is provided as the input data which is used to predict the reaction rate of species in the domain and temperature change of species. But the thermodynaic data of the solid parts of the engine is not provided as input data for combustion simulation. Hence, the wall temperature of solid parts of the engine is not predicted in combustion simulation. Thus, a heat transfer model is required to predict the wall temperature of solid parts of engine where thermodynamic properties of solid is provided as the input data. The conjugate heat transfer model predicts the temperature of wall due to the interaction between the burnt species ans solid parts of the engine.
What is the significance of Ca10, Ca50 and Ca90?
The Ca10, Ca50 and Ca90 depicts the crank angle at which 10% of fuel is burnt, 50% of fuel is burnt and 90% of burnt. The Ca10 signifies the start of the ignition, the Ca50 signifies the phase change of fuel and Ca90 signifies the end of combustion process.
Conclusion:
The CFD simulation of given PFI engine is done using the converge CFD software. The spray model for injecting the fuel into the PFI engine cylinder via nozzles is setup and the SAGE detailed chemistry solver is used as combustion model to calculate the reaction rate of the species in the domain. The fixed embedding of different shape and adaptive mesh refinement is used to refine the grid cells at desired regions. The results and plots is obtained and engine parameters is calculated. Thus, by analysis of the data obtained from the CFD simulation, the engine geometric parameters can be modified for further development.