Week 1 Stress Concentration on a Plate with hole
Objective:
To Perform Static Structural Analysis of plate using the material Structural Steel to find out the Total deformation and Equivalent Stress for the given two cases using Ansys Workbench and suggesting which design to be used from analysis standpoint and manufacturing standpoint.
Setup and Execution:
- Static Structural Analysis on Plate is carried out in Ansys Workbench.
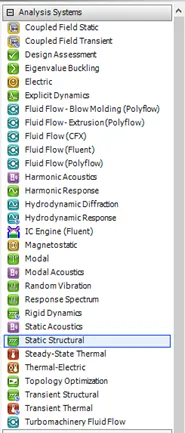
- Select Static Structural analysis from the Analysis System drop down menu.
- Select the type of material required from the Engineering Data.
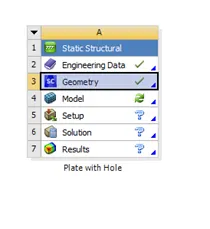
PROCEDURE:
Case – 1:
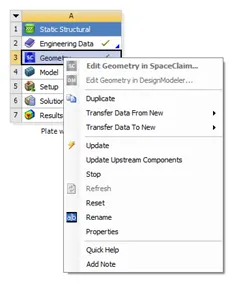
- Right Click on Geometry and Open Space Claim
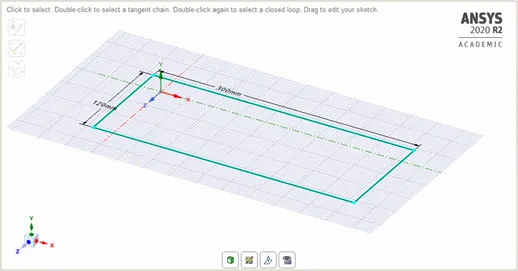
- In Space Claim, draw a Rectangle of Length 300mm and Height 120mm as given in the challenge.
- To draw a circle of diameter 60mm at the centre of the rectangle, use construction lines to generate the centre for the circle.
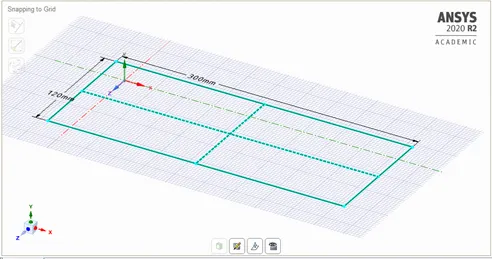
- Now, with the centre generated from construction lines, draw a circle of diameter 60mm.
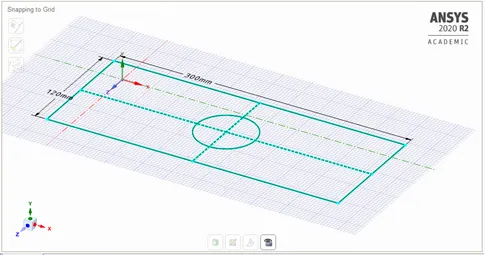
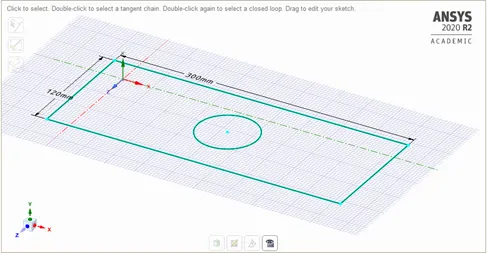
- After drawing the circle, delete the construction lines as they are no longer needed.
- Using Pull option from Space Claim, select the sketch to Generate a 3D model of the rectangular plate. To add thickness to the plate, pull the sketch in either of the direction. This will generate a 3D model of the plate with a thickness of 30mm.
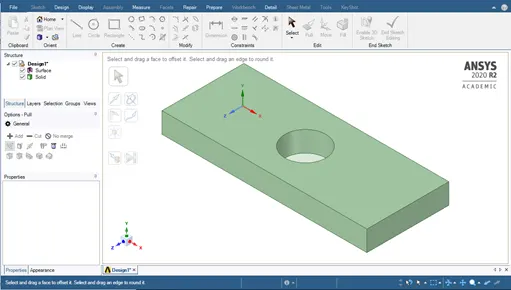
- Close Space Claim module and update the model.
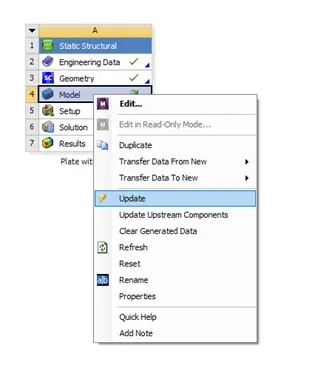
- After updating the model, open the model in Mechanical design module.
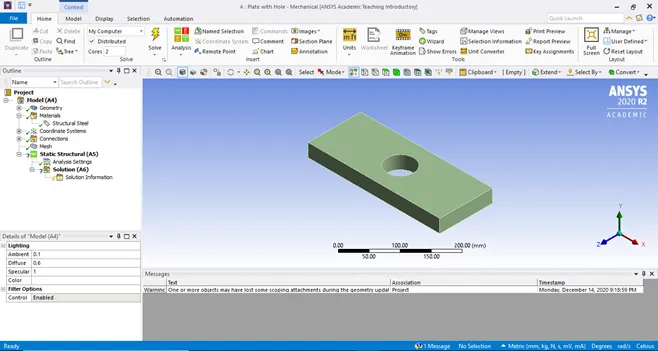
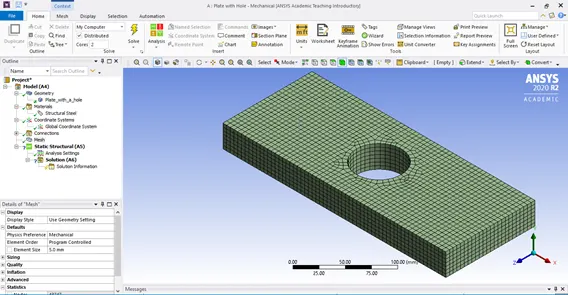
- Check for the units, material and geometry. A mesh is generated to the given geometry by keeping element size as 5mm.
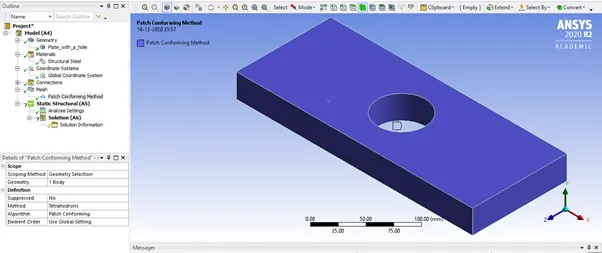
- For providing better result, the meshing is done using tetrahedrons method.
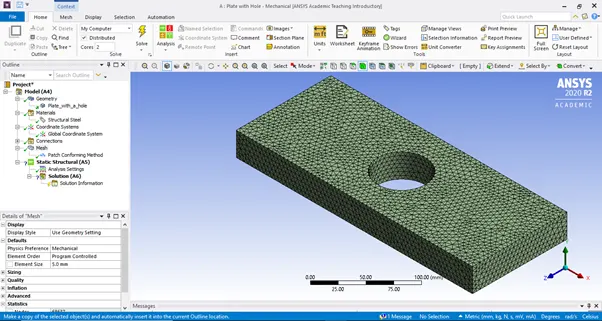
- As limitations are imposed to the software, a mesh for element size of 7mm is generated.
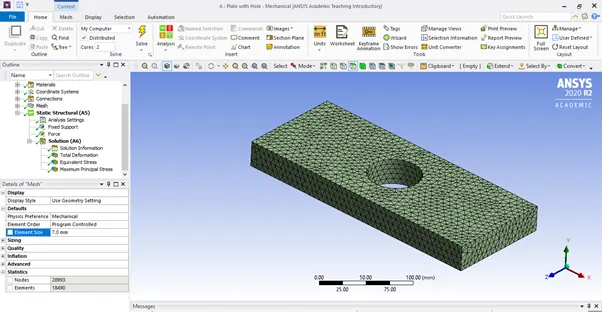
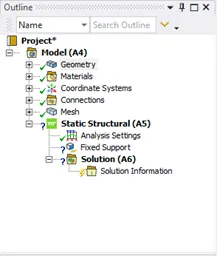
- Recheck for any errors, if no errors are found the tree diagram in “Outline section” would represent all green ticks for the specific name.
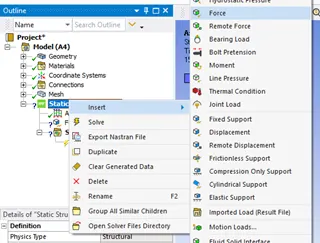
- To provide supports to the plate, right click on Static Structural and click on Insert. There we can find many types of supports, loads, forces, etc. that can be assigned.
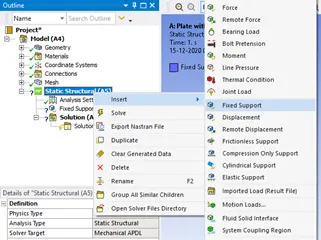
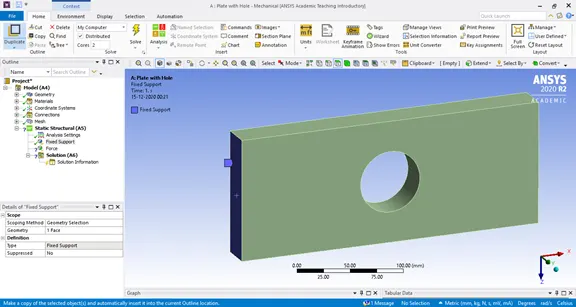
- Fixed support is provided to the left end of the plate.
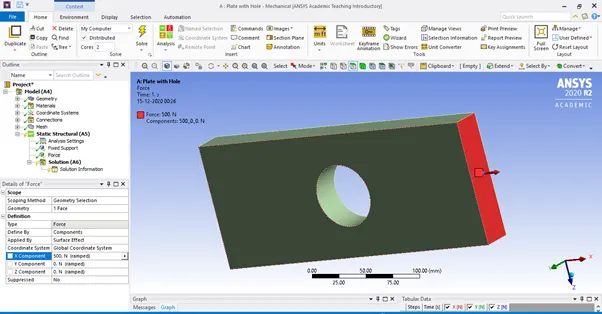
- Force load is provided to the right of the plate. Force load is defined by components to understand the direction of load being applied on.
- After the end boundary conditions are setup, solve the model and evaluate results for total deformation and Maximum Stress.
RESULT:
Total Deformation: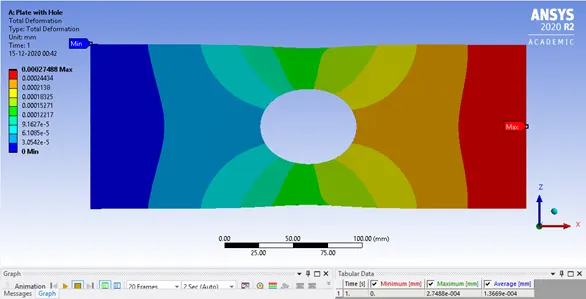
Equivalent Stress: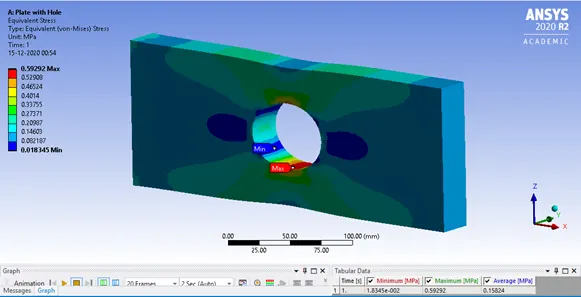
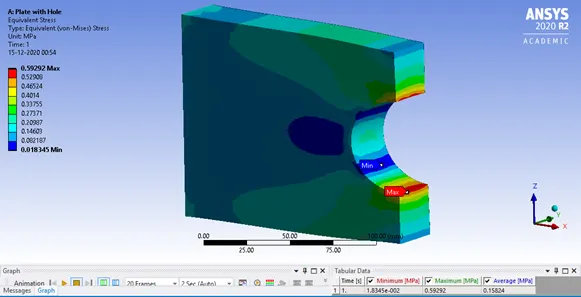
Case - 2:- Re-Edit the geometry by reopening the geometry in space claim.
- Select the surface of the geometry as reference drawing surface and draw two construction lines 90mm apart from the centre as mentioned in challenge.
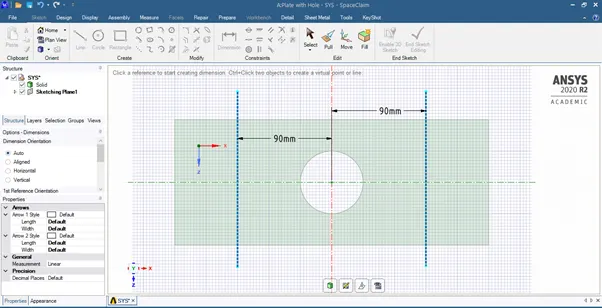
- Draw two circles of diameter 30mm at the point of intersection of the construction lines and axis.
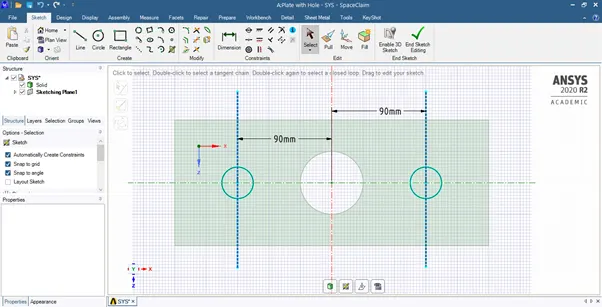
- After drawing the circles, remove the construction lines and remove the solid material of the circle using the pull option.
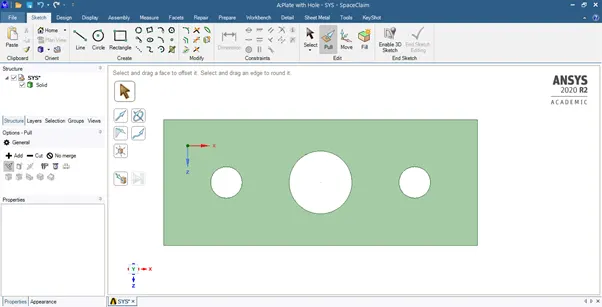
- Update the Geometry and Open Mechanical Design Module.
- Recheck for any errors, if no errors are found the tree diagram in “Outline section” would represent all green ticks for the specific name.
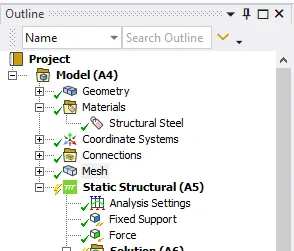
- Solve the model by maintaining the same conditions as used in Case – 1 such as:
- Mesh element Size (=7mm) and
- end boundary conditions (i.e. fixed support on left side and force load of 500N on Right Side).
- Evaluate the results for Total Deformation and Maximum Stress.
RESULT:
Total Deformation: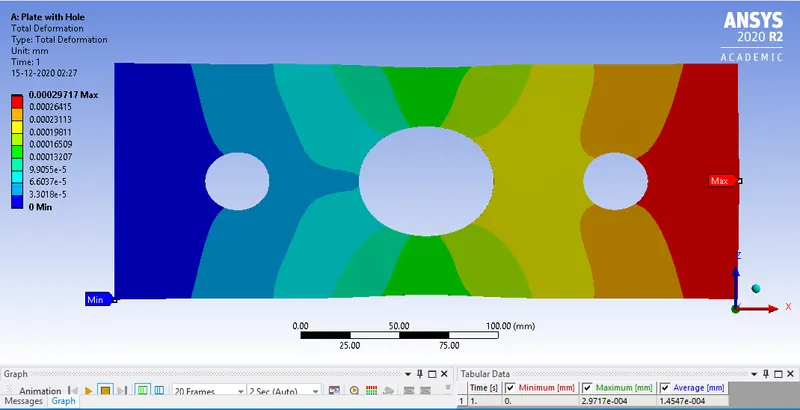
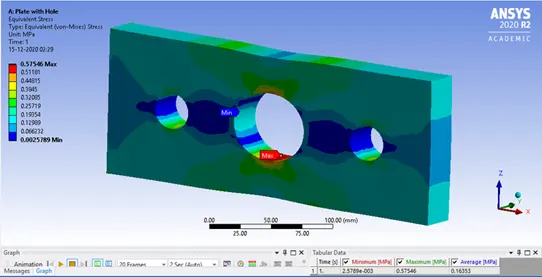
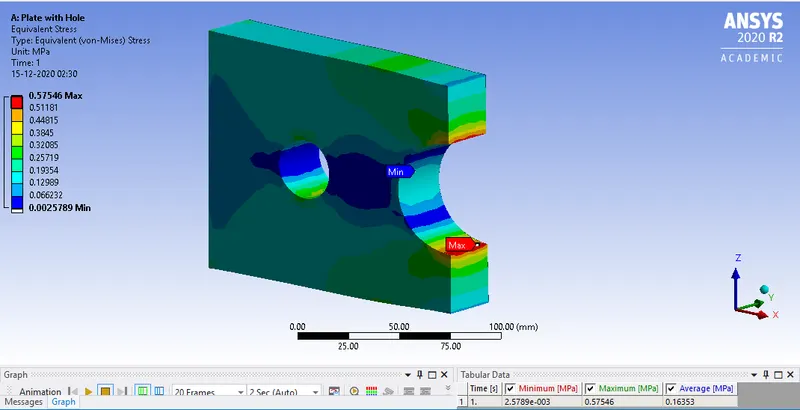
Equivalent Stress:
COMPARISON:
Total Deformation:Case Min. Deformation (mm) Max. Deformation (mm) Avg. Deformation (mm) 1 0 2.7488e-004 1.3669e-004 2 0 2.9717e-004 1.4547e-004
Equivalent Stress:
Case Min. Stress (MPa) Max. Stress (MPa) Avg. Stress (MPa) 1 1.8345e-002 0.59292 0.15824 2 2.5789e-002 0.57546 0.16353
CONCLUSION:
On comparing the results of total deformation, it can be inferred that the Average deformation in case 2 (i.e. 1.4547e-004mm) is slightly higher than the Average deformation observed in case 1 (i.e. 1.3669e-004mm). The Slightly higher value of deformation observed in case – 2 is due to the increase in no. of holes on the rectangular Plate.On comparing the results of Equivalent Stress, it can be inferred that the Maximum Stress in case 1 (i.e. 0.59292 MPa) is slightly higher than the Maximum Stress in case 1 (i.e. 0.57546 MPa). The Maximum stress distribution for both the cases is observed on the centre hole. The Slightly higher value of stress observed in case – 1 than case - 2 is due to better overall stress distribution in Case – 2 with the addition of two holes on the rectangular Plate.
Analysis point of view:
Manufactuirng point of view:
As an Automobile Engineer, according to Analysis Point of view I would recommend Case – 2 as the Max. stress induced in less in this case. Using Stress Flowline Theory, we can explain why case – 2 is considered as the best.
According to this theory, Stress flowlines when observed in Case -1, experience an abrupt change in the direction of flow around the 60mm circle. However, when observed in
Case – 2, stress flowlines are guided smoothly over the first 30mm circle, then on the 60mm circle and then over the other 30mm circle.
From this point of view, I would recommend the Case – 1 plate as it involves lesser no. of operations than Case – 2. In Case – 1, Drilling operation is used to drill one hole whereas in Case – 2, Drilling operation is used to drill three holes.
Moreover, in Case – 1, producing a single hole on a rectangular plate would require less Manpower, production cost, time, etc along with producing of lesser amount of production errors and scrap material.
- Right Click on Geometry and Open Space Claim