Week 1- Mixing Tee
The Aim, Introduction, Theory
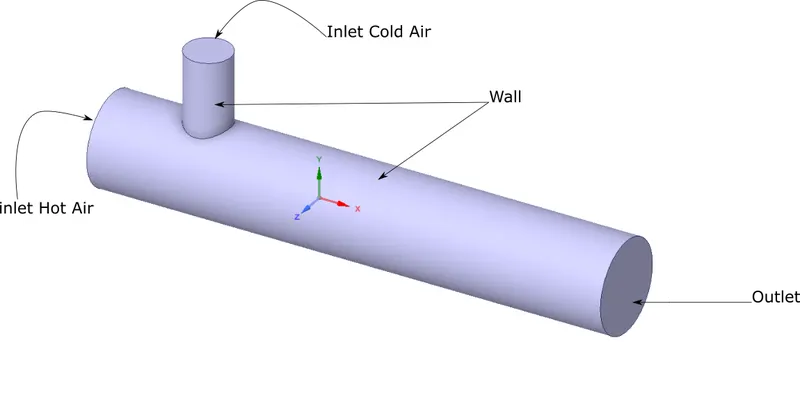
Mixing tee is an important engineering component, primarily used in mixing of different fluids of different conditions to achieve desired properties. In the present study, mixing of air at different temperatures is simulated. The configuration has two inlet valves and one outlet valve. One of the inlet valves allows hot air intake at 36 C whereas the other one with short diameter allows cool air intake at 19 C.
The objective of present study is to compare the k-epsilon vs k-omega turbulence modeling and observe the effect of momentum ratio as well as length of the main pipe in effective mixing of hot and cold air. The study has been accomplished by varying momentum ratio of intake fluid as well as length of the main pipe.
Setting up the case
Setting up the geometry
Space Claim as been used to prepare the geometry for further modelling.
The Initial Geometry of Tee Mixing joint.
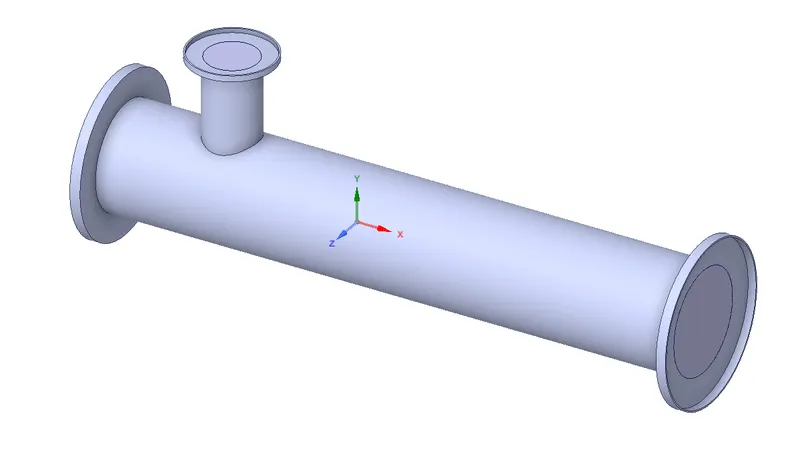
using Prepare -> Volume Extract - The un-necessary geometry is removed and volume region is defined.
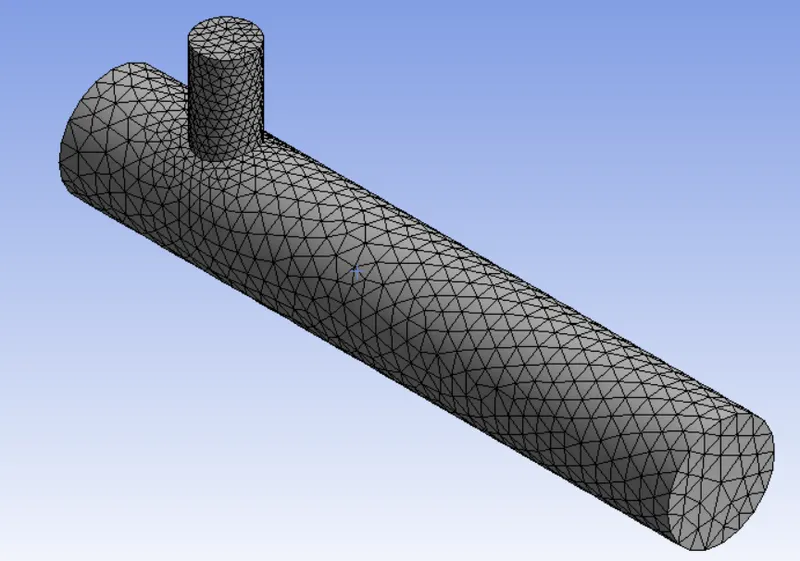
Meshing:-
Solving and Modelling Approach
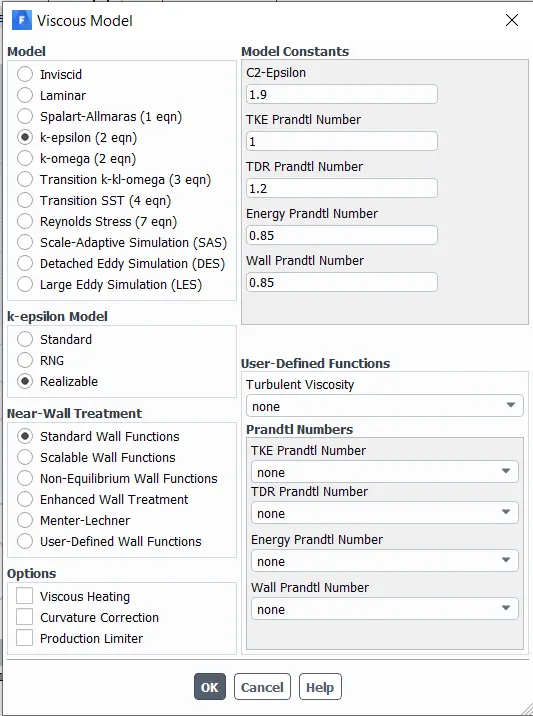
Turbulence Modelling
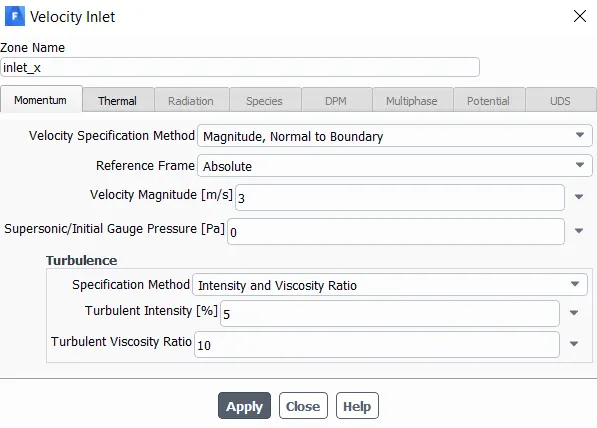
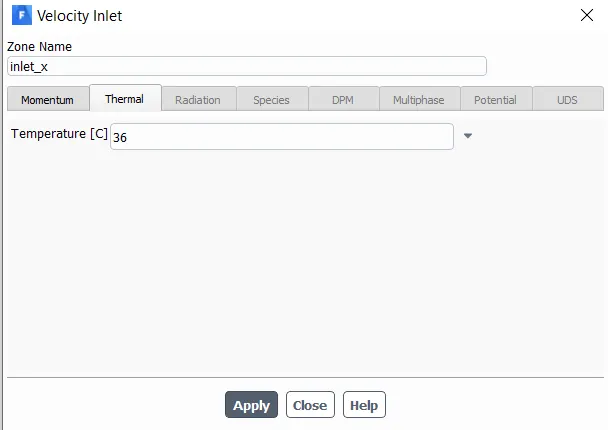
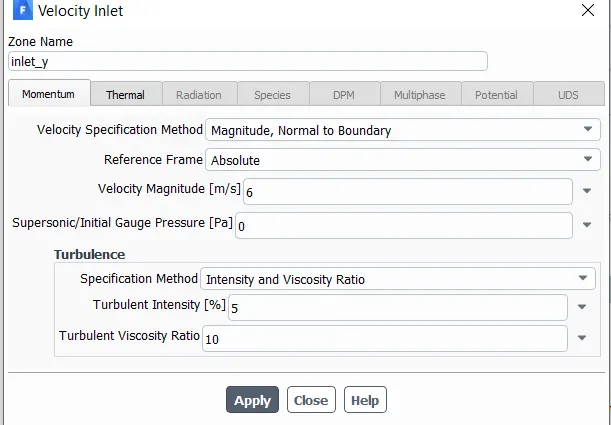
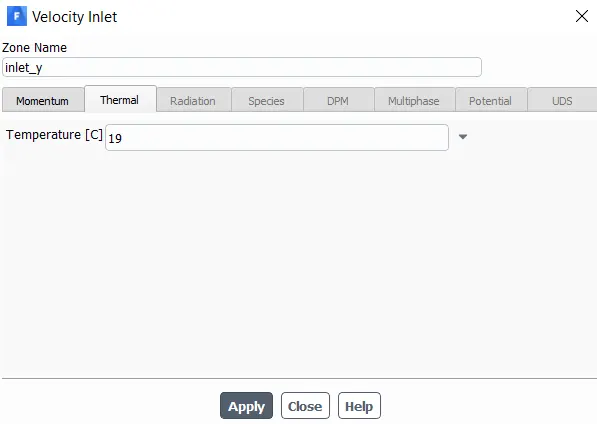
The model is run for 300 itterations.
Boundary Conditions
Turbulence Modelling
Ansys Fluent has been used to simulate the present physical model. For right turbulence modelling approach, the model with k-epsilon as well as k-omega is solved and compared.
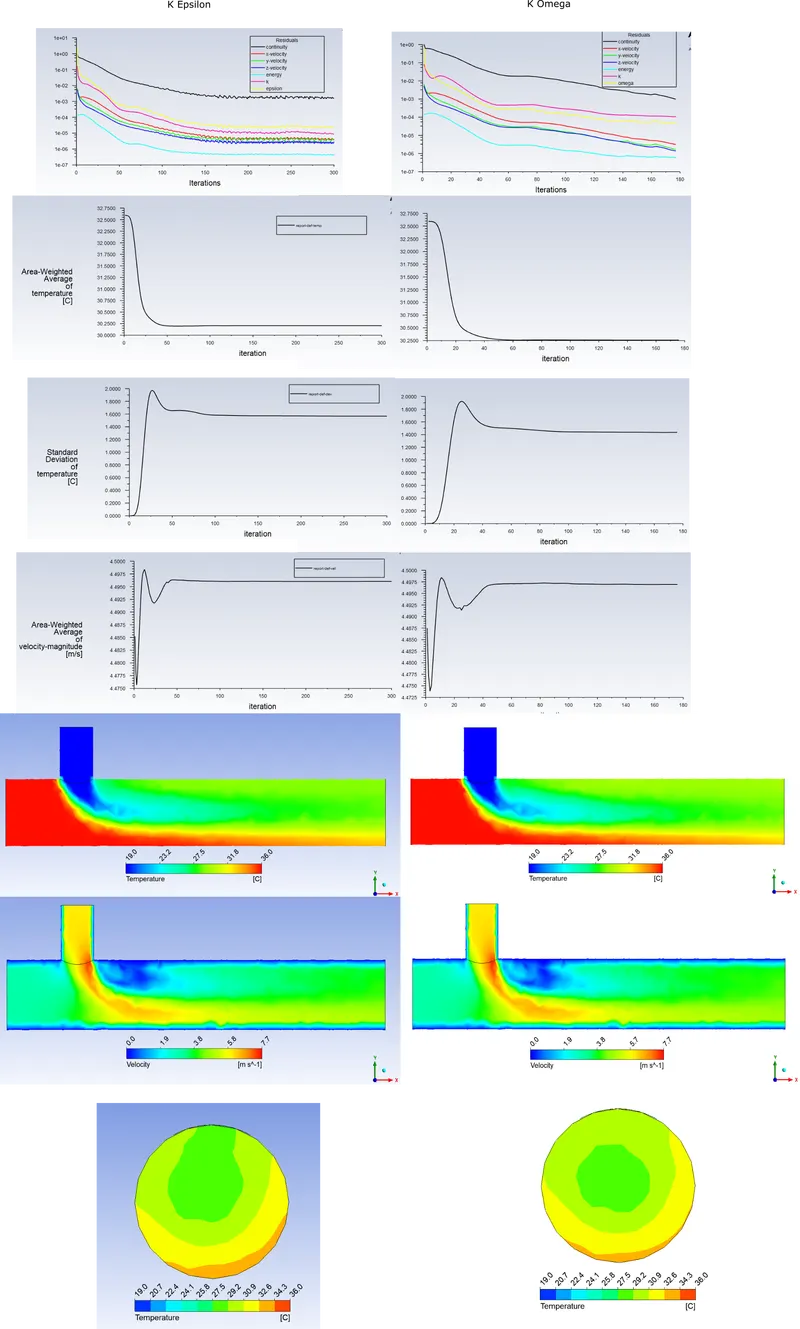
K omega turbulence model calculates well near wall region, whereas K-epsilon calculates better in the bulk. Though K omega Shear Stress Transport (SST) is a variant of the standard k–ω model combining the original Wilcox k-omega model for use near walls and the standard k–ε model away from walls using a blending function,its dependency on wall distance makes this less suitable for free shear flows.
In the present simulation we would like to go with K epsilon model as it gives better mixing results in the bulk
Mesh Independence Study
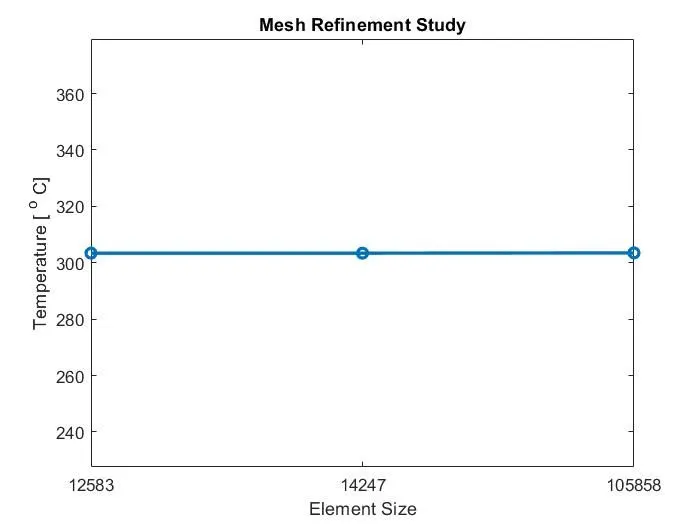
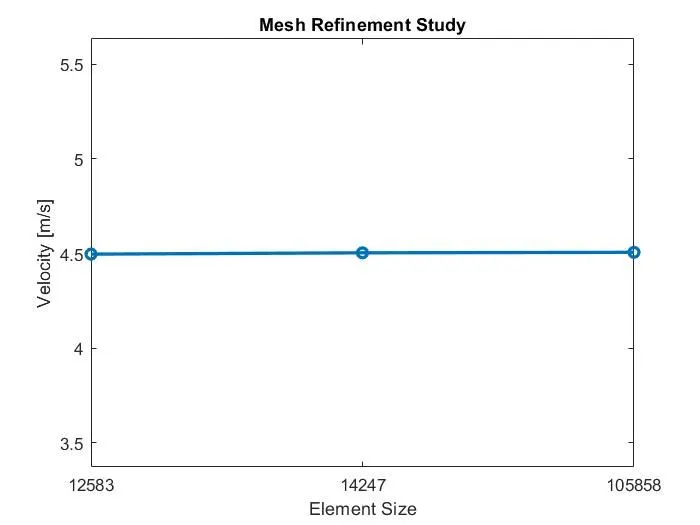
Increasing the element size in three levels, the surface average temperature at outlet and surface average velocity at outlet was plotted. There is very little to no variation in the result, so it would be wise idea to go with the smaller element size for further simulation.
Results and Discussions
Velocity and temperature contour plots on the cut planes along and across the pipe.
Velocity contour Plot
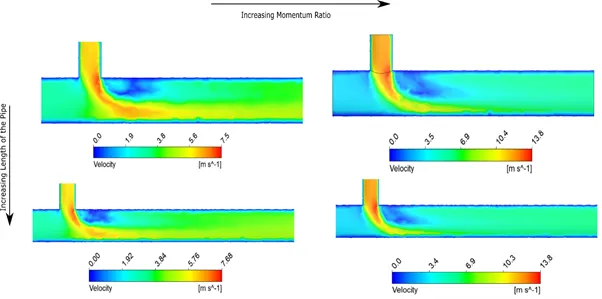
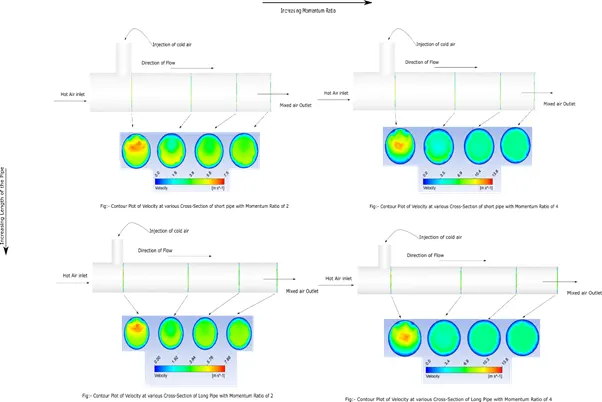
Velocity Contour Plot at various Cross-Section
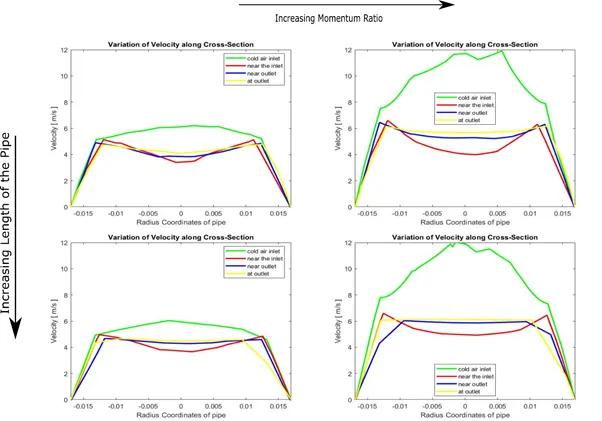
Velocity Line Plot at various Cross-Section
The Contour plot of velocity on increasing the momentum ratio and length of the pipe is presented.
Effect of Momentum Ratio
On increasing the momentum ratio, we see less banded contour near the exit of the pipe, which relatively suggests that particle posse near to average velocity magnitude. The same can be confirmed by visual observation of cross-section velocity plots.
Effect of Length of the main pipe
On increasing the length of the pipe, the velocity profile doesn’t have much effect as compared to increase in momentum. The same can be confirmed upon visual observation of line plots.
Velocity Line Plot along the length of the pipe.
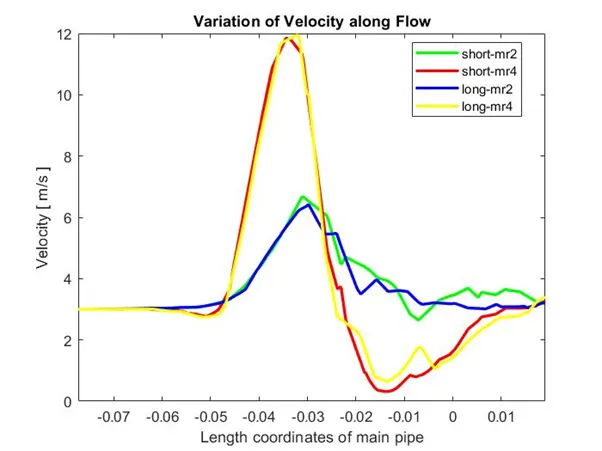
Line plot of variation of velocity in flow direction of the main pipe is presented.
The plot suggests the similar profile for similar momentum ratio. This its evident that the velocity profile is not much affected by the length of the pipe as compared to the momentum ratio.
Temperature
Temperature Contour Plot
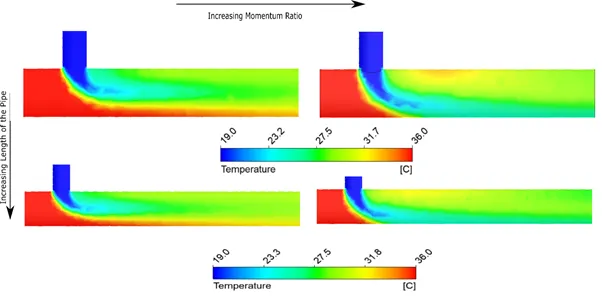
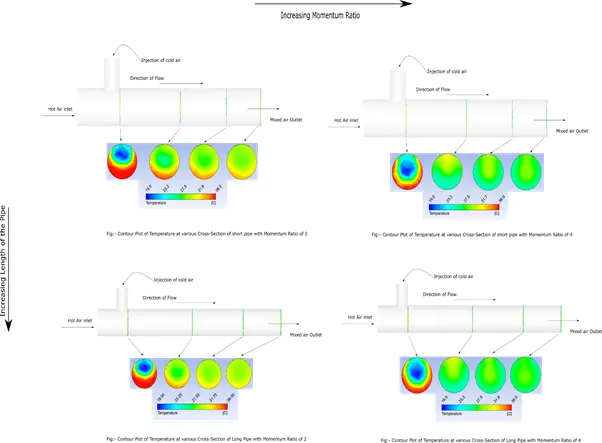
Temperature Contour plot along the cross-section
Temperature Line plot at cross-sections at different length of pipe
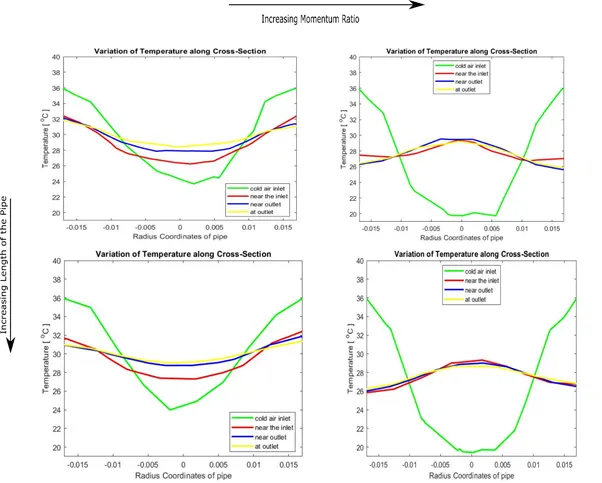
Effect of Momentum Ratio
With increase in momentum ratio, upon visual inspection of contours, its quite evident that the banding decreases. Same can be confirmed by the cross-section line plots. At higher momentum ratio, there is a sudden dip in the temperature in the mud region then it averages out as the length of travel increses.
Effect of Length of the main pipe
There is not much appreciable change in the temperature profile as the length of the pipe increses, but we can see the banding decreses to a much less region at higher momentum ratio of long pipe.
Temperature Line plot along the flow direction
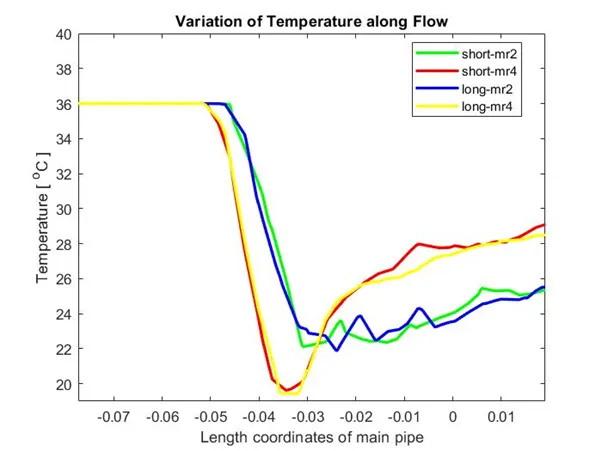
The line plot along the flow suggests the similar behaviour, the momentum ratio as much effect on the average temperature at the outflow.
| Short MR-2 | Short MR-4 | Long MR-2 | Long MR-4 | |
| Cell Count | 12728 | 12728 | 15483 | 15483 |
| Avg. Outlet Temperature in deg C | 30.22 | 27.54 | 30.309 | 27.48 |
| No. of Iterations | 300 | 119 | 231 | 159 |