Week 1- Mixing Tee
A mixing tee is a type of pipe fitting where two fluid streams come together to form a single stream. This geometric configuration is commonly encountered in industrial processes, such as chemical engineering applications, where different fluids need to be mixed. The efficiency of mixing is crucial in these scenarios, and computational fluid dynamics (CFD) simulations can be employed to analyze and optimize the mixing process in a mixing tee.
1. k−ε (k-epsilon) Model:
Description: The k−ε model is one of the most widely used turbulence models. It solves for two additional transport equations: one for turbulent kinetic energy (k) and another for the turbulent dissipation rate (ε). These equations help capture the turbulence characteristics of the flow.
Applicability: The k−ε model is suitable for a wide range of turbulent flows, including those with shear layers and recirculation zones. It is computationally efficient and works well for many industrial applications.
Limitations: The k−ε model may struggle with certain flow conditions, such as separating flows and flows with strong streamline curvature.
2. k−ω (k-omega) Model:
Description: The k−ω model is another widely used turbulence model that, like the k−ε model, solves for turbulent kinetic energy (k) but replaces the dissipation rate (ε) with the specific rate of dissipation (ω). The k−ω model is known for its improved performance in flows with adverse pressure gradients and near-wall regions.
Applicability: The k−ω model is often preferred for boundary layer flows and situations where the k−ε model may encounter difficulties. It is suitable for a variety of flow conditions, including separating flows and regions with strong streamline curvature.
Limitations: The k−ω model may require more computational resources compared to the k−ε model. It may also be sensitive to grid resolution.
Selection of turbulence model:
- k−ε is more suitable for this type of simulation since during comparison since it was found that k−ε used less resources and gave similar results to k omega.
- Less Iterations were required for k-epsilon and the results were found to be in same range.
| Sr. No. | Model | Temperature (c) | Velocity(m/s) |
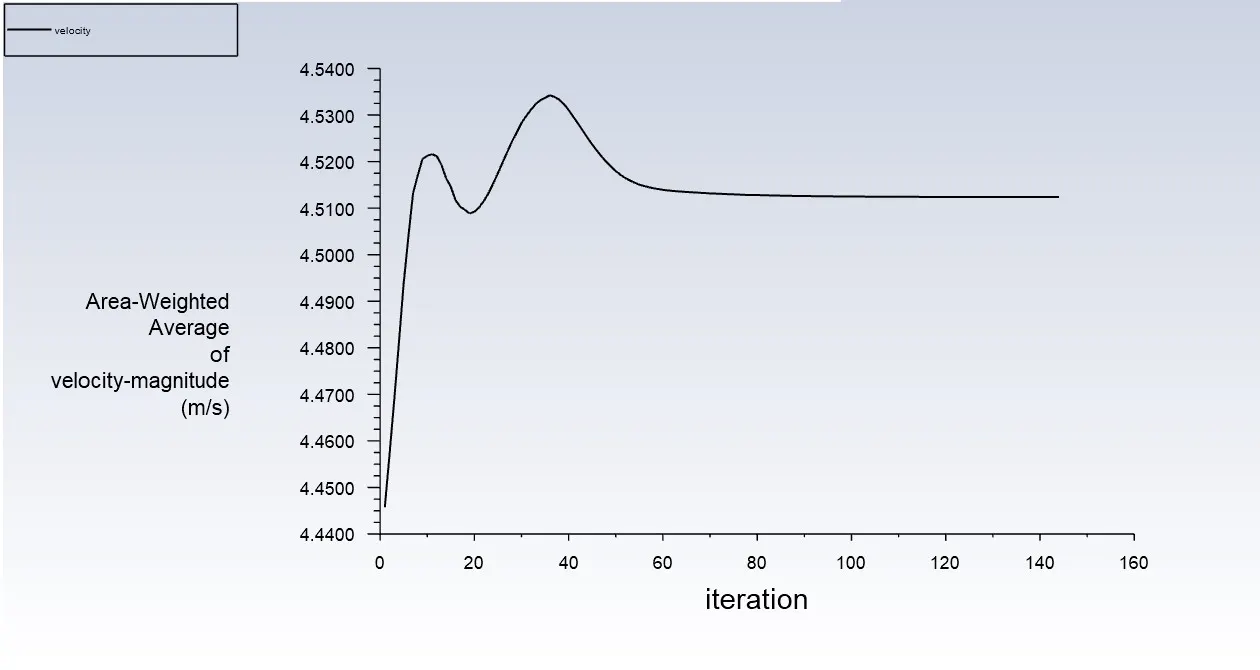
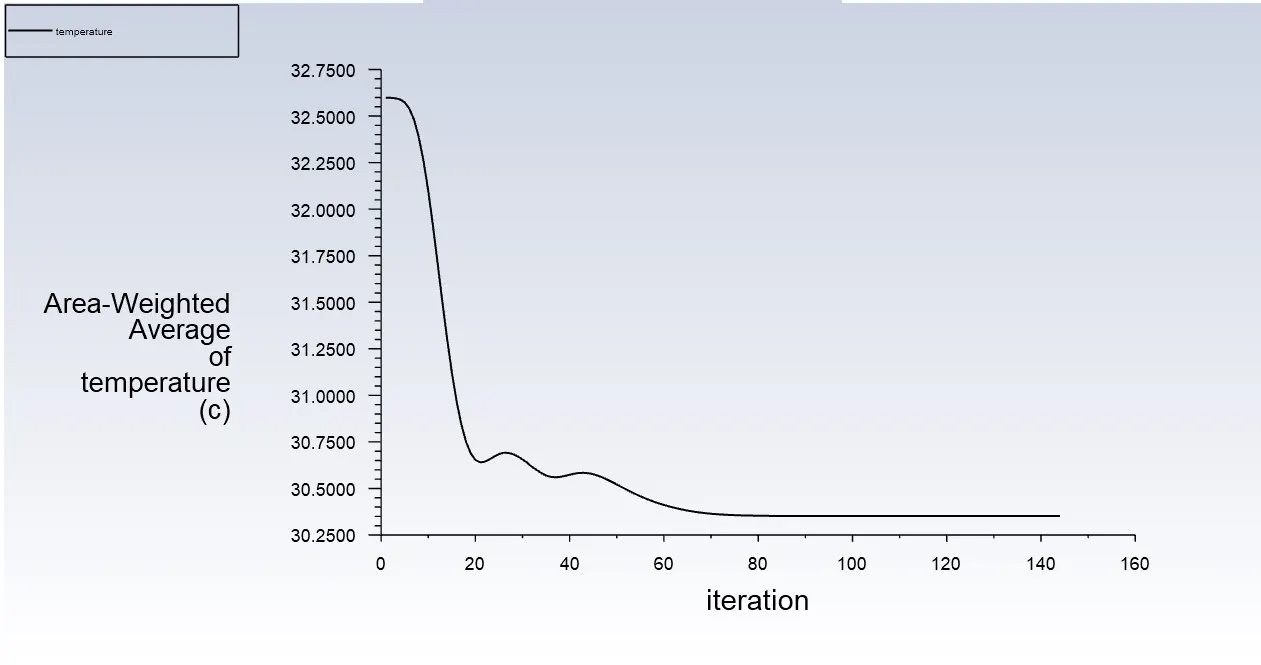
| 1 | k-epsilon | 30.353 | 4.513 |
| 2 | k-omega | 30.361 | 4.527 |
The table presents results from simulations using different turbulence models (k-epsilon and k-omega) and reports the corresponding temperature and velocity values.
Temperature:
- The temperature values for both models are very close, with the k-omega model slightly higher than the k-epsilon model.
- The difference in temperature between the two models is minimal (0.008 °C).
Velocity:
- The velocity values for both models are also very close, with the k-omega model slightly higher than the k-epsilon model.
- The difference in velocity between the two models is minimal (0.014 m/s).
In summary, based on the provided results, there is no significant difference in temperature and velocity between the simulations using the k-epsilon and k-omega turbulence models. The small variations observed could be within the expected range of numerical accuracy or may indicate that, for the specific conditions tested, both turbulence models provide similar predictions for temperature and velocity.
Case 1 : Short mixing tee
For momentum ratio: 2
Cell count
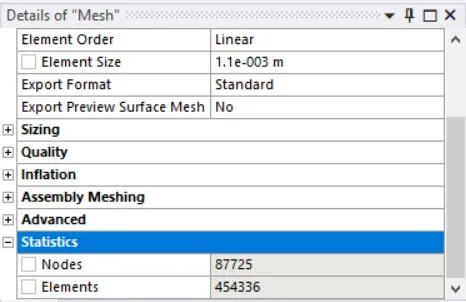
Average outlet temperature

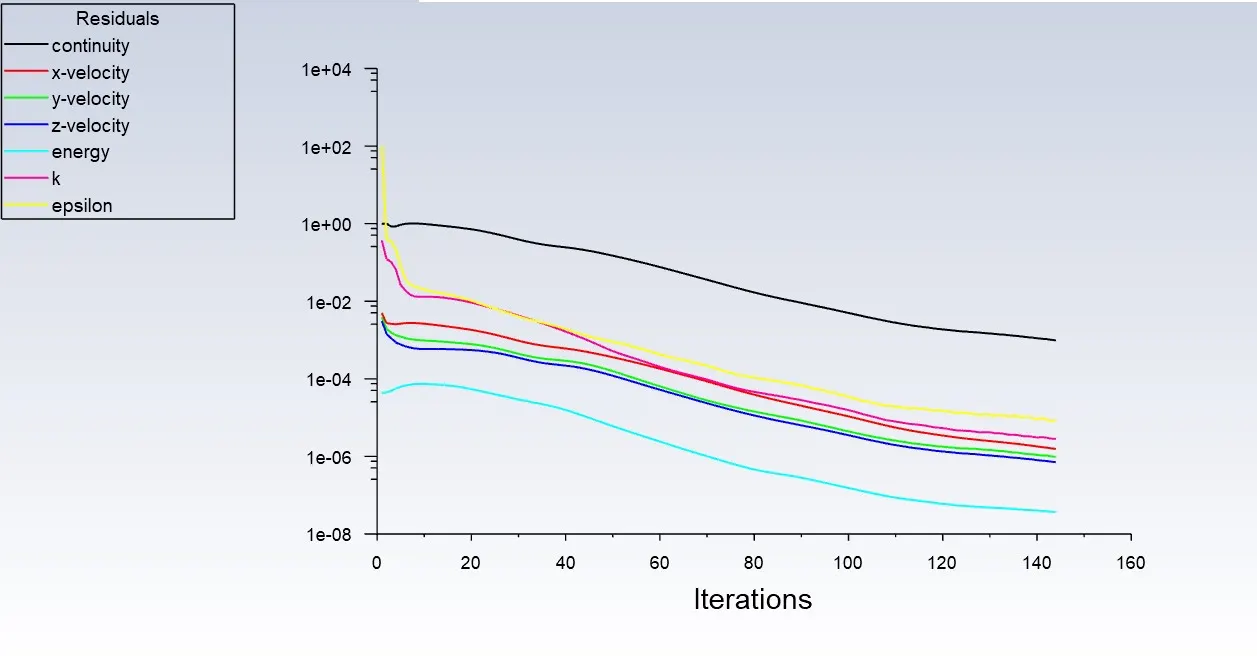
Number of iterations for convergence
Velocity plot
Temperature plot
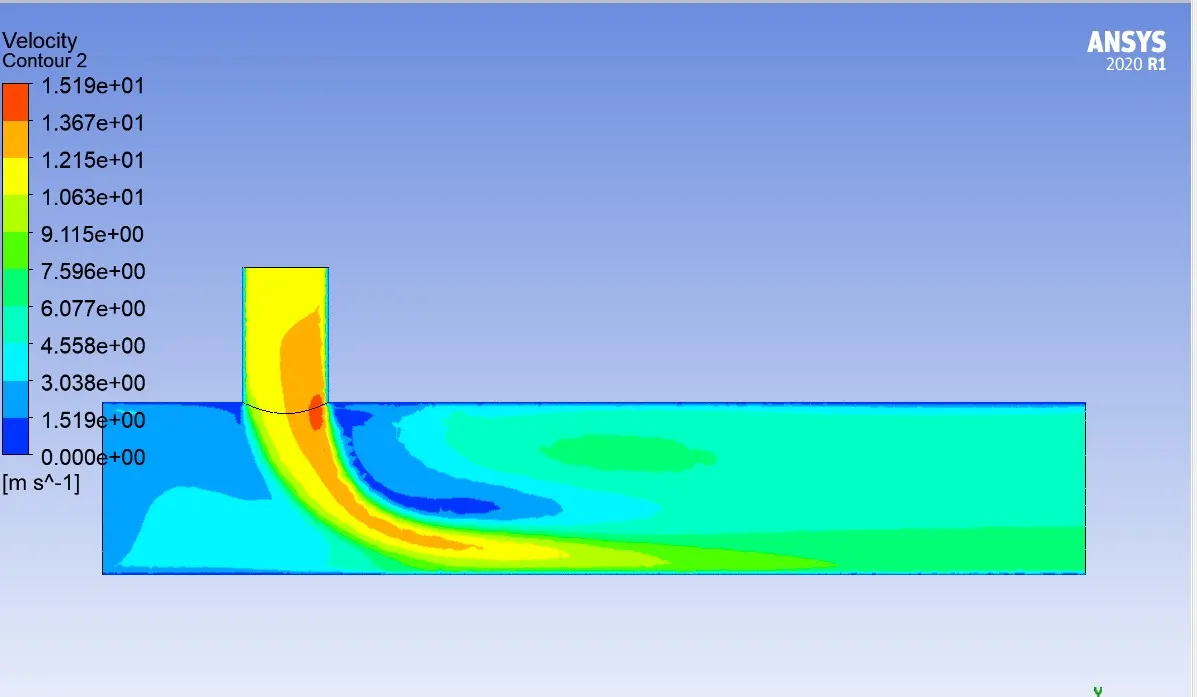
Velocity contour
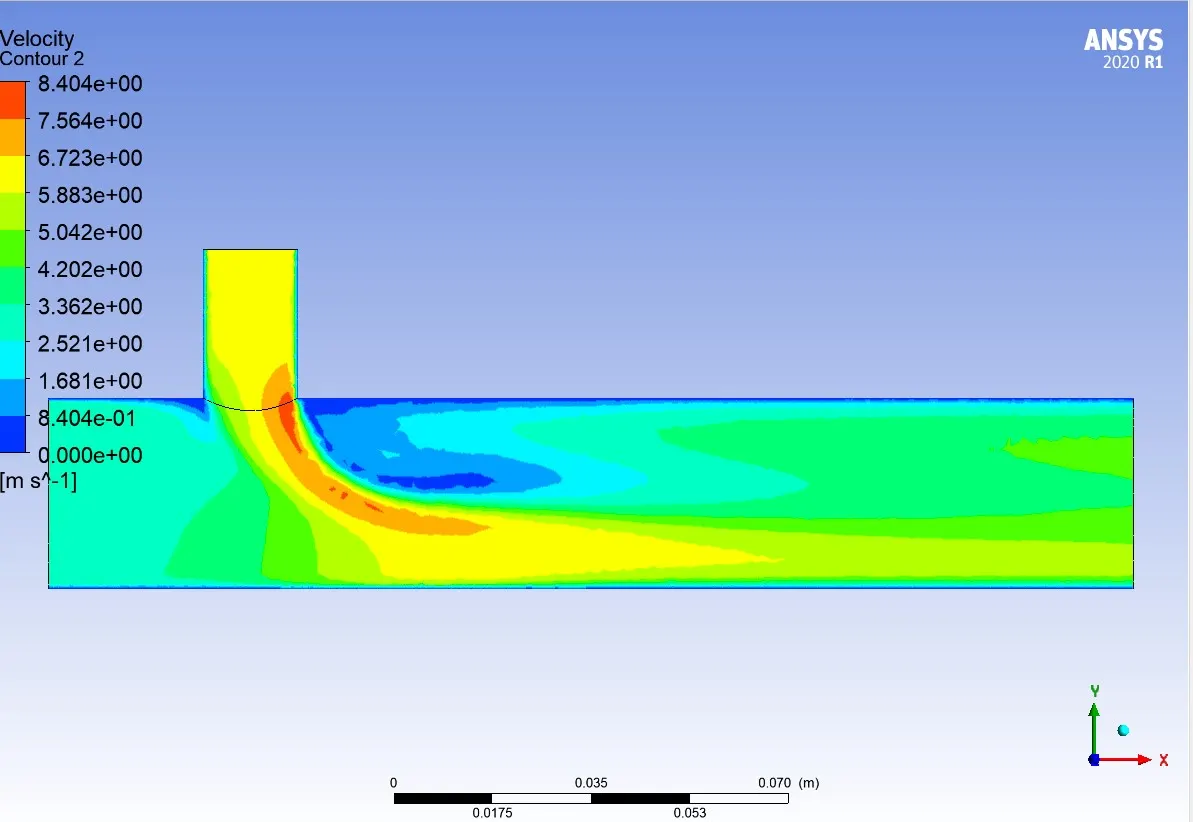
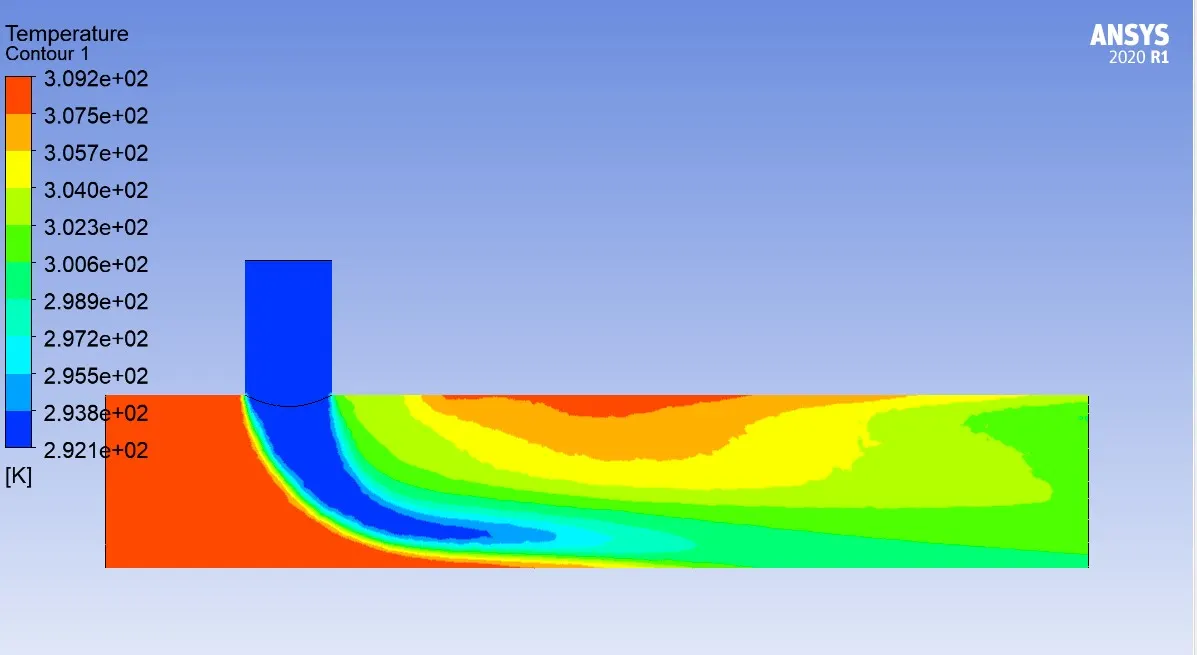
Temperature contour
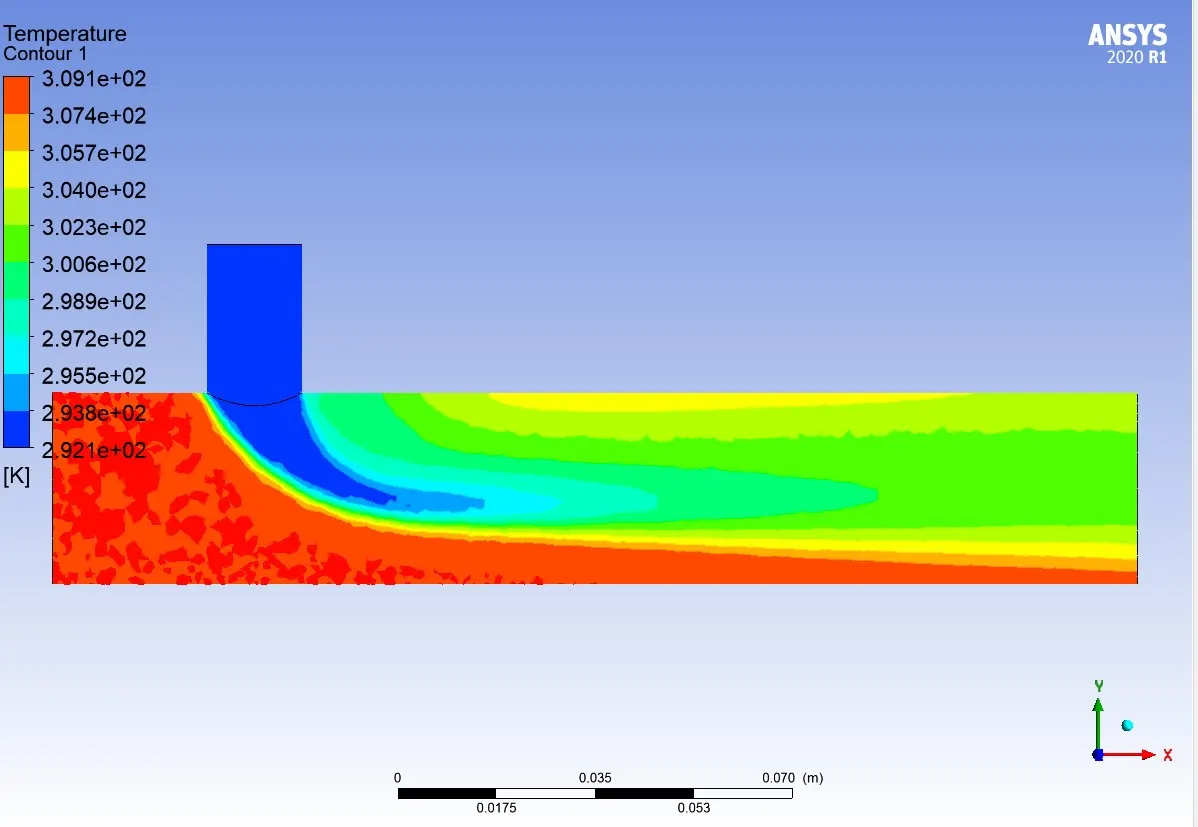
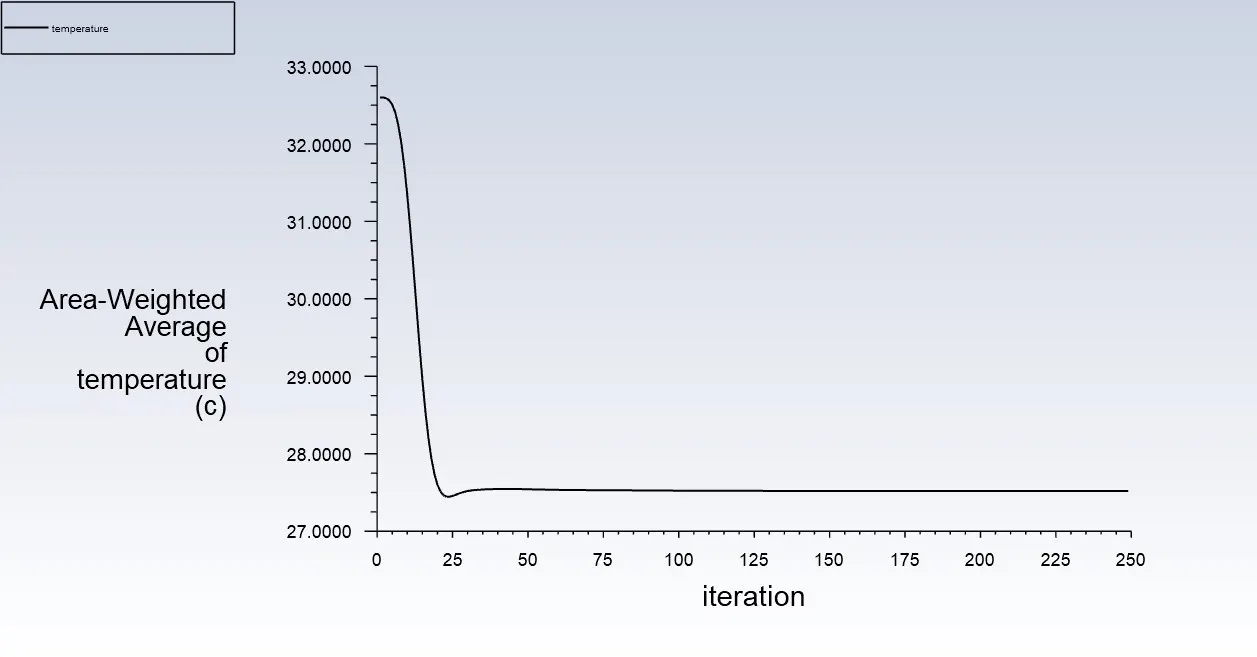
For momentum ratio : 4
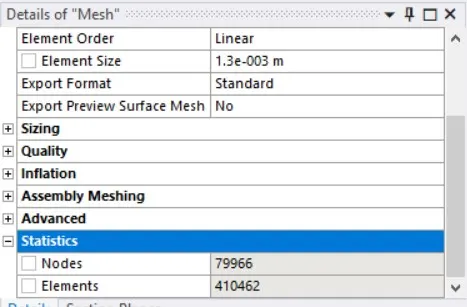
Cell count
Average outlet temperature

Number of iterations for convergence
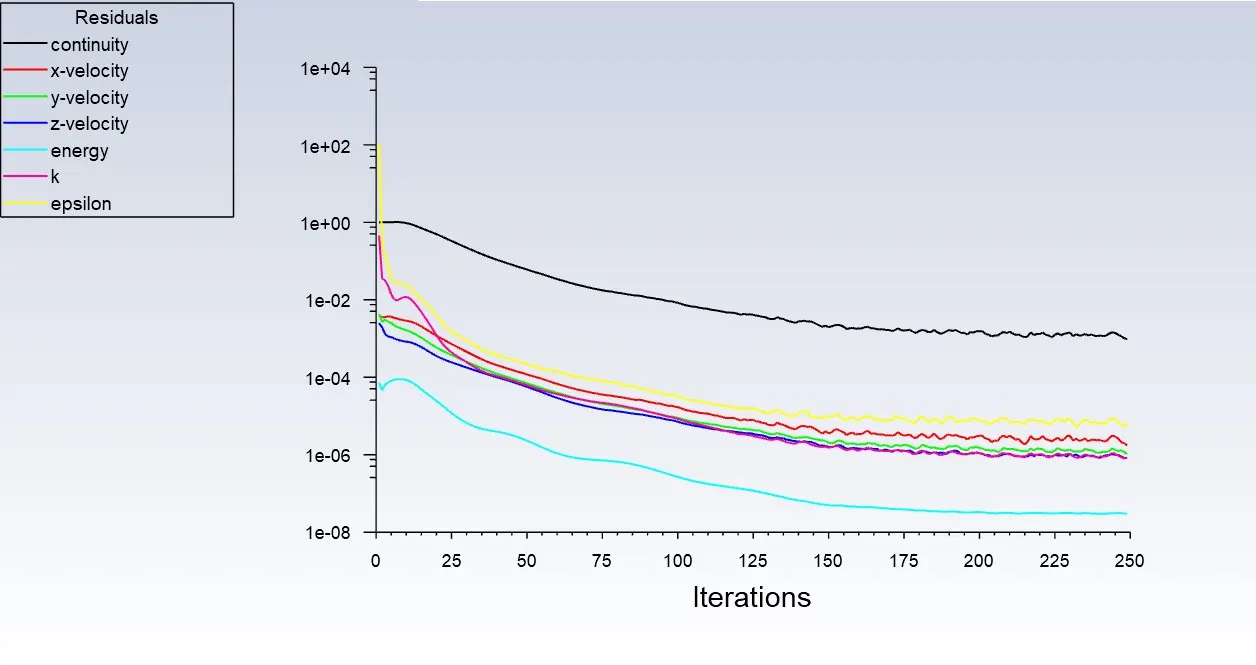
Velocity plot
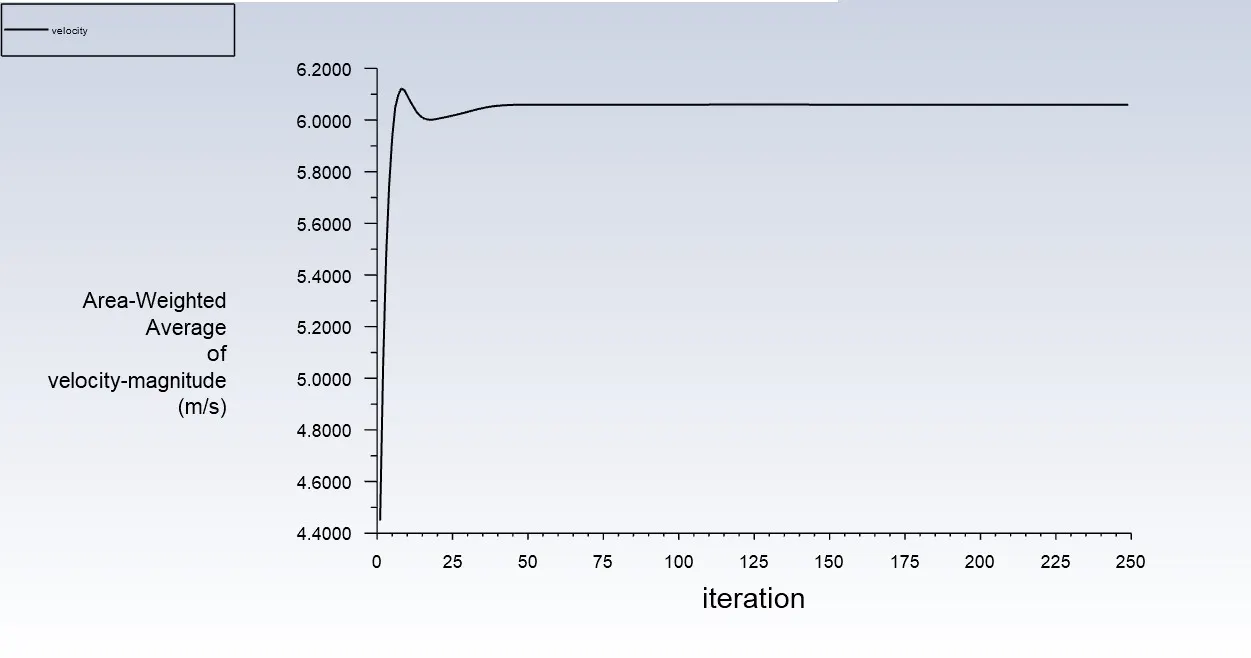
Temperature plot
Velocity contour
Temperature contour
Case 2 : Long mixing tee
For momentum ratio: 2
Cell count
Average outlet temperature

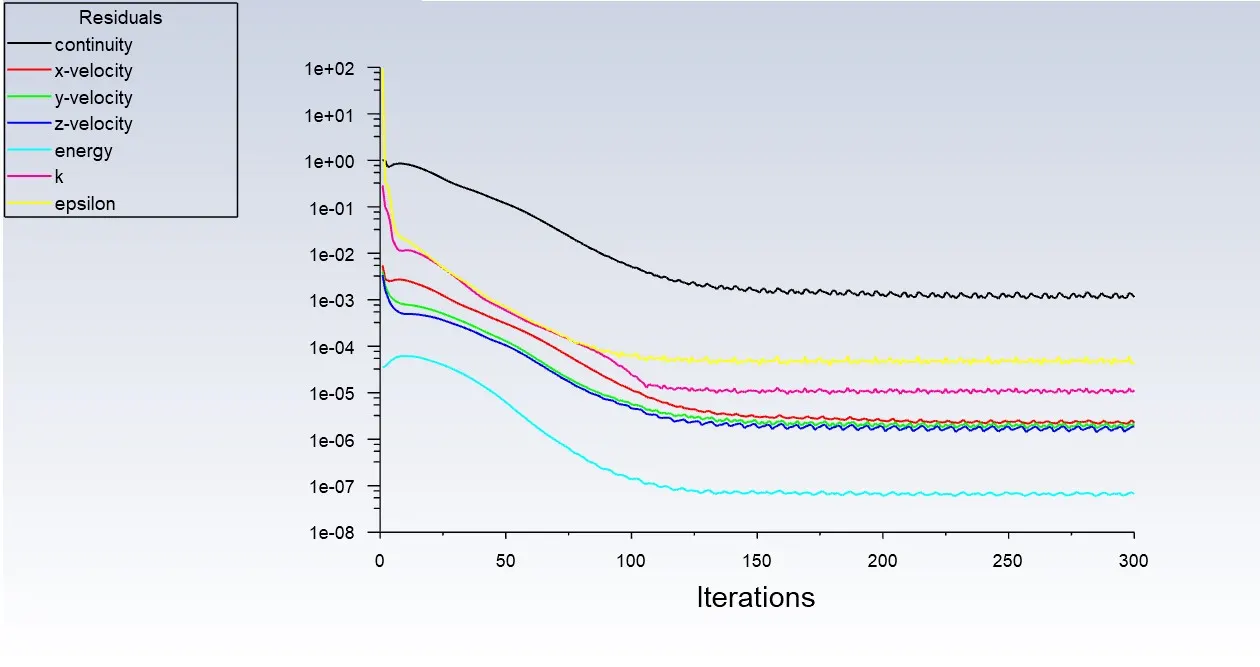
Number of iterations for convergence
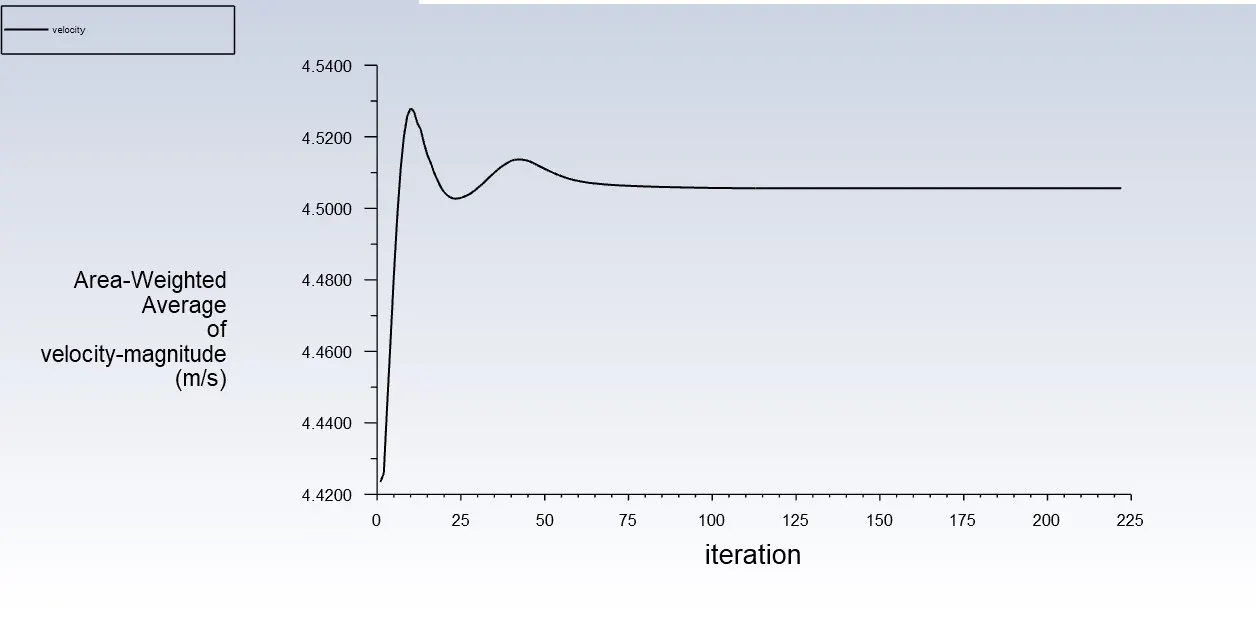
Velocity plot
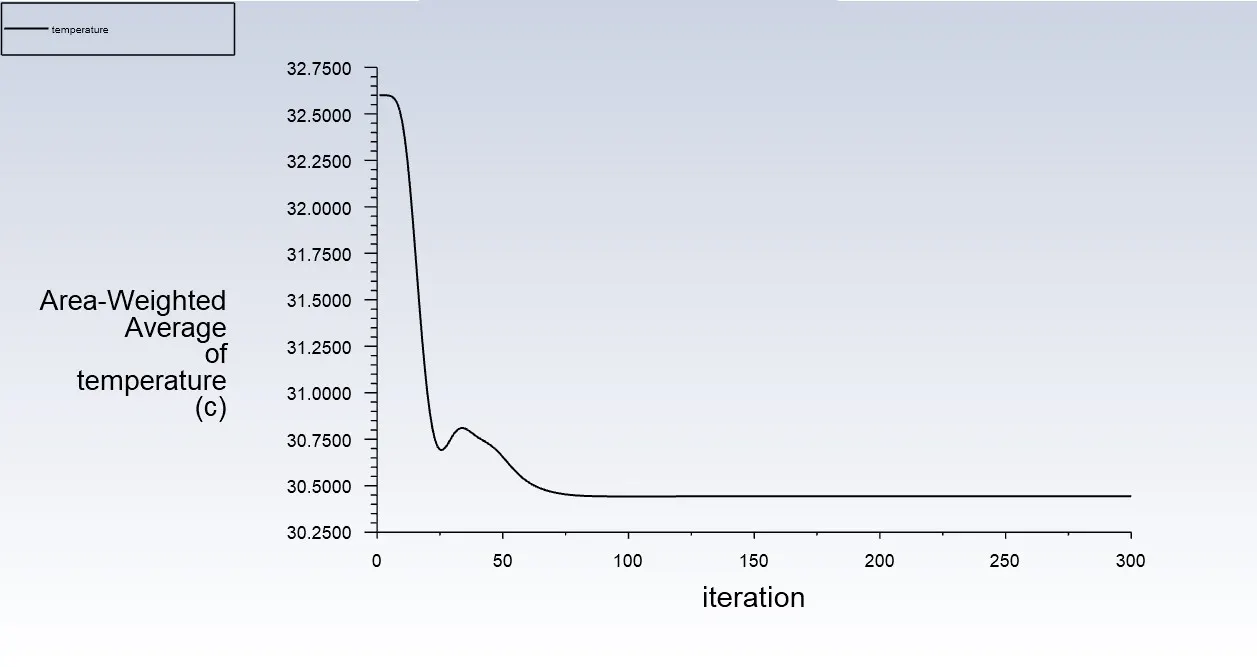
Temperature plot
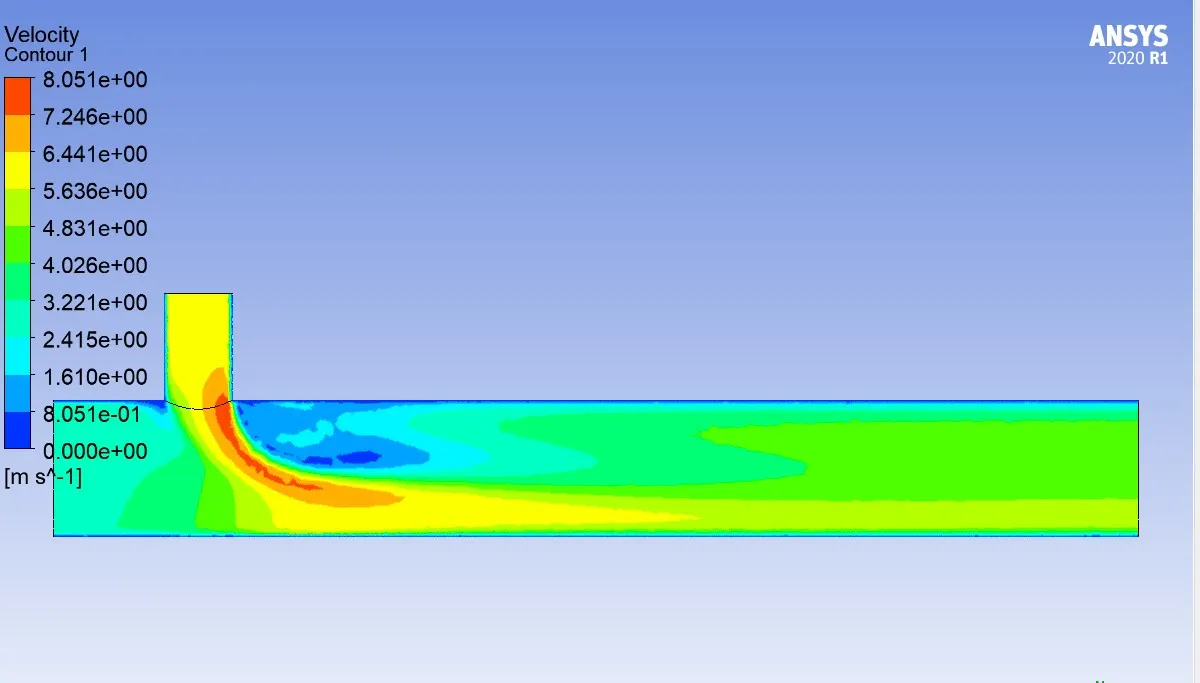
Velocity contour
Temperature contour
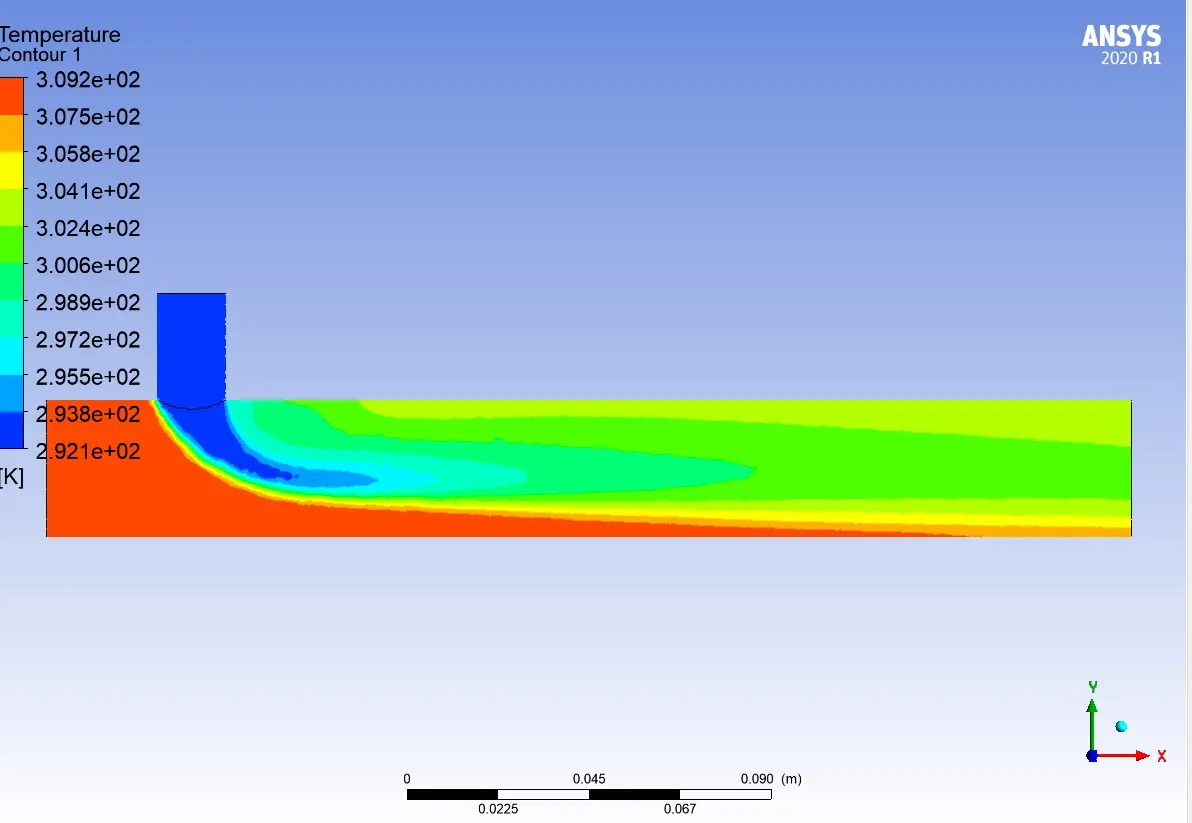
For momentum ratio : 4
Cell count
Average outlet temperature

Number of iterations for convergence
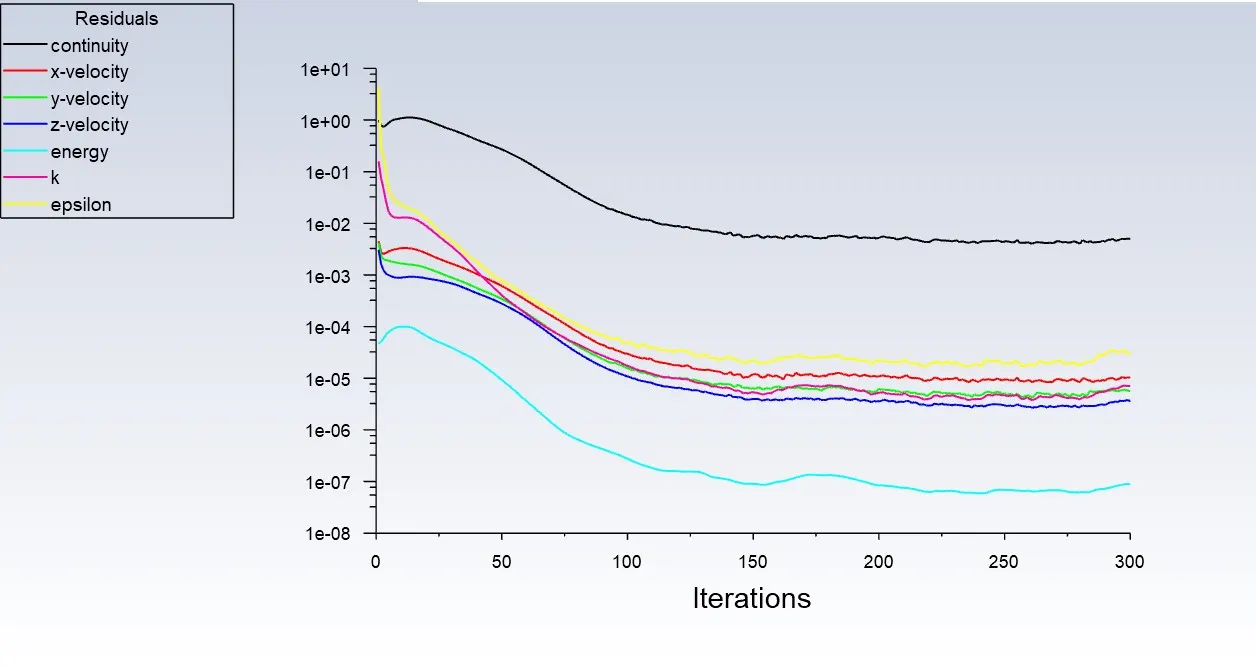
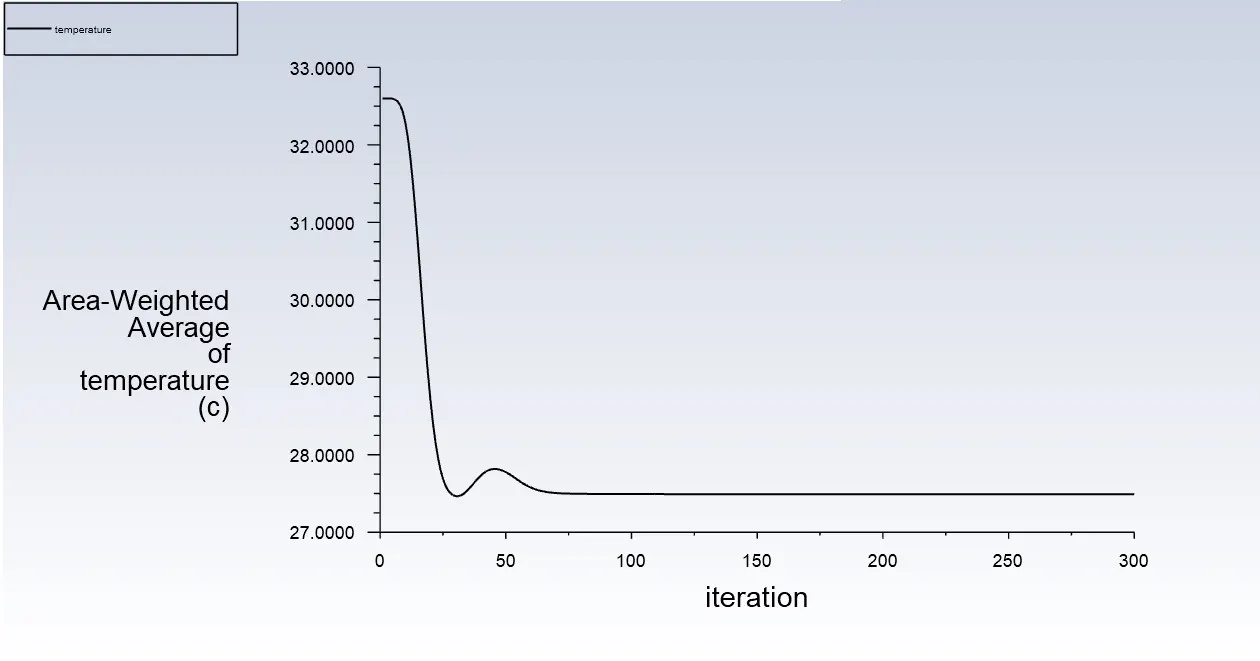
Velocity plot
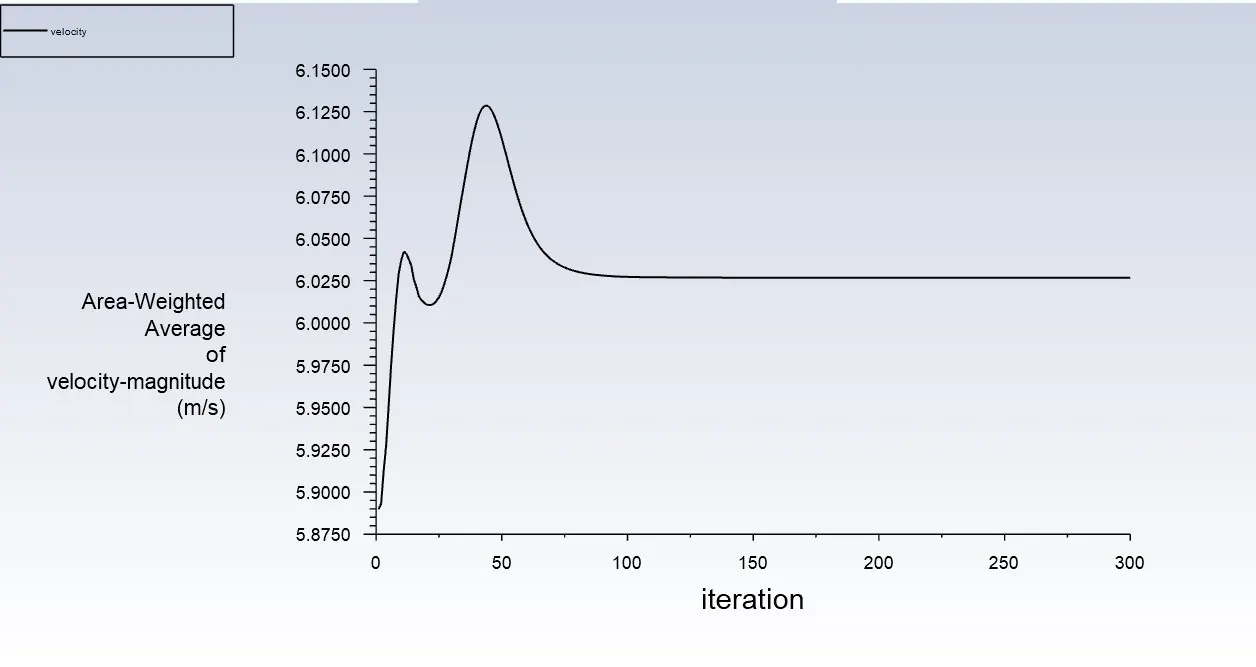
Temperature plot
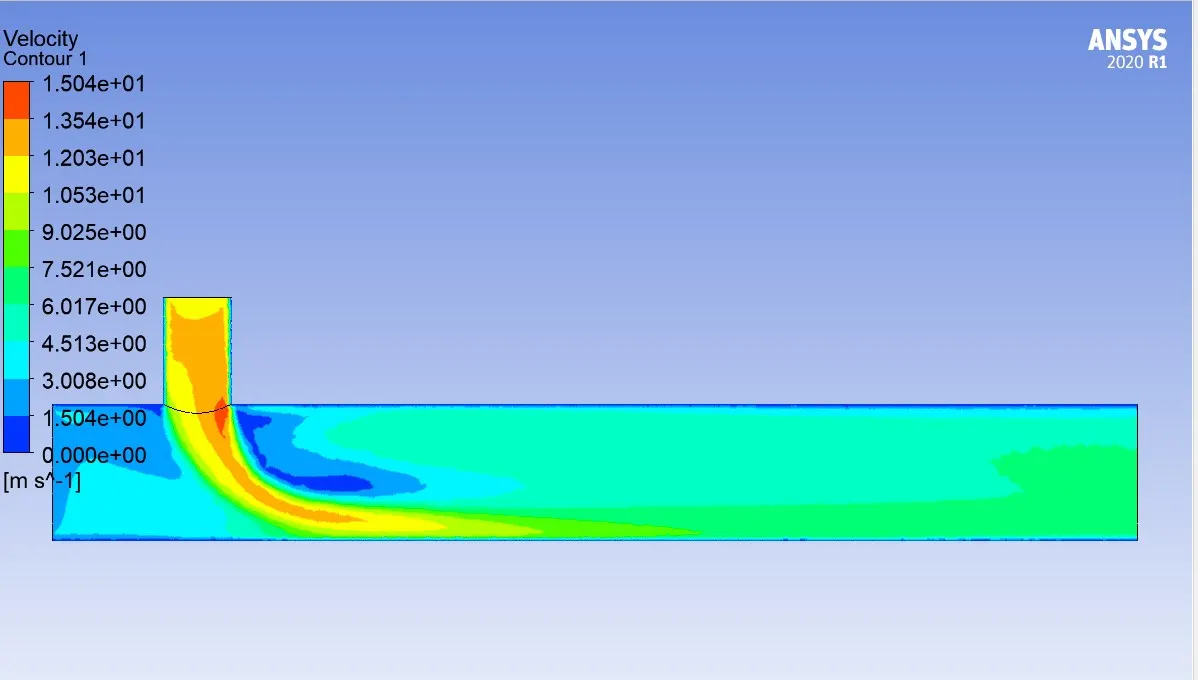
Velocity contour
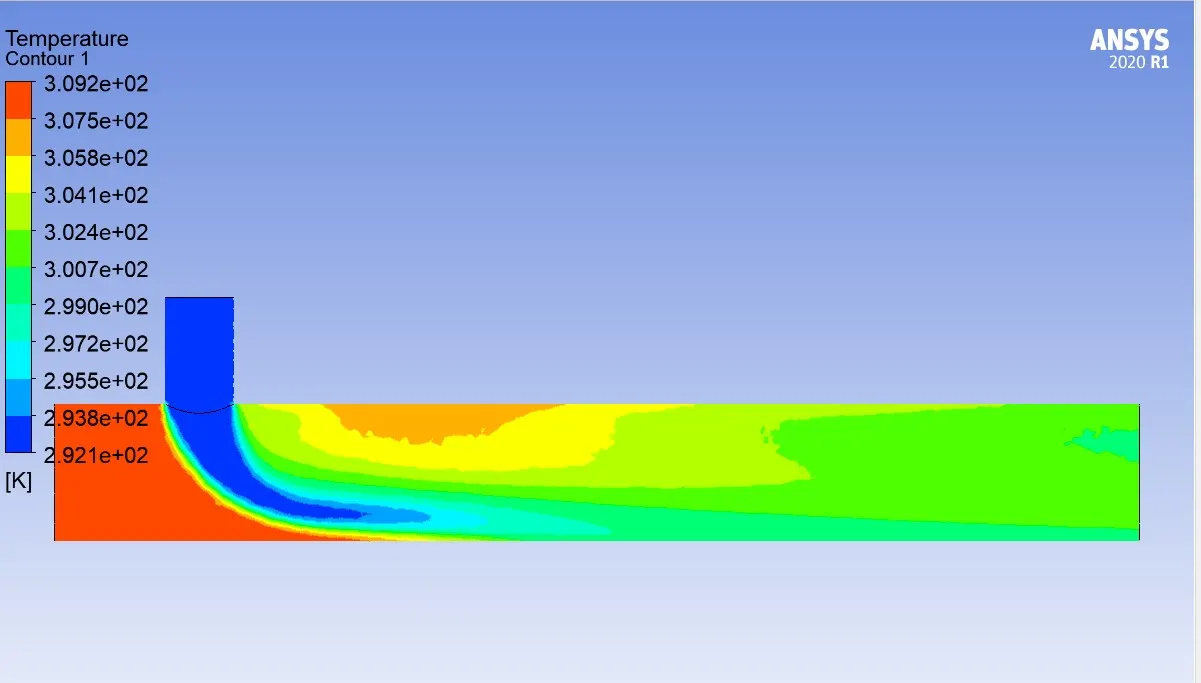
Temperature contour
Mesh Independency test :
| Sr. No. | Mesh | No of Elements | Temperature |
| 1 | Baseline mesh | 119841 | 27.5738 |
| 2 | 1st refinement | 253241 | 27.55 |
| 3 | 2nd refinement | 454336 | 27.531 |
Baseline Mesh:
Number of Elements: 119,841
Temperature: 27.5738
1st Refinement:
Number of Elements: 253,241
Temperature: 27.55
2nd Refinement:
Number of Elements: 454,336
Temperature: 27.531
Key observations:
- The baseline mesh has the fewest elements, while the 2nd refinement has the most.
- The temperature values seem to be in a relatively close range, with the baseline mesh having a slightly higher temperature than the refined meshes.
- It's essential to consider the purpose of the simulation and the expected behavior. While the temperatures are close, the differences could still be significant depending on the context of the simulation.
- The increase in the number of elements with refinement indicates an effort to capture more detail in the simulation.
Effect of length and momentum ratio on temperature :
| Sr. No. | Length | Momentum ratio | Temperature (c) | Velocity(m/s) |
| 1 | Short | 2 | 30.35262 | 4.5125 |
| 2 | Short | 4 | 27.531 | 6.02 |
| 3 | Long | 2 | 30.44 | 4.509 |
| 4 | Long | 4 | 27.49 | 6.0254 |
The table presents results from a simulation study investigating the effects of two factors, namely the length of a mixing tee and the momentum ratio, on temperature and velocity.
Key observations:
Length of Tee: Two different lengths of the mixing tee were considered - "Short" and "Long."
Momentum Ratio: Two different momentum ratios were tested - 2 and 4.
Temperature:
- Generally, the temperature is higher for the higher momentum ratio and shorter tee length.
- The longest tee with a momentum ratio of 2 has the highest temperature (30.44 °C).
- The short tee with a momentum ratio of 4 has the lowest temperature (27.531 °C).
Velocity:
- The velocity is higher for the higher momentum ratio and shorter tee length.
- The short tee with a momentum ratio of 4 has the highest velocity (6.02 m/s).
- The longest tee with a momentum ratio of 2 has the lowest velocity (4.509 m/s).
These results suggest that both the length of the tee and the momentum ratio have a significant impact on the temperature and velocity within the mixing tee system. The specific relationships and trends observed can provide valuable insights into the fluid dynamics and heat transfer characteristics of the system under consideration.