Week 1- Mixing Tee
Observing flow patterns and its kinetics (Motion) of fluid is a complex phenomenon when it comes to analyse the behavioural change of various variables of the flow. Particularly when the flow is in transition stages from LAMINAR to TRANSIENT and to TURBULENT. Behaviour of fluid flow can be best described in Two approaches.
1) EULERIAN APPROANCH-(FLOW FIELD OBSERVATION)
2) LEGRANGIAN APPROACH-(FLUID PARTICLE MOVEMENT OBSERVATION)
Flow variables behavior can be calculated in different ways especially Numerical Analysis, Experimental Analysis,and Computational Simulation analysis. In Numerical analysis we use certain flow governing equations and Mathematical models which gives best results for flow analysis. But, it takes longer times to calculate with no visualization of flow. inorder for better understanding of the flow we use Experimental methods by building a physical model which give a closer results to real time scenario. In experimental setups it is very much hard to change the design of the system or any other changes to the system of obervation. Econometrics of above models is sometimes cost ineffective and we cannot go for Experimental setups for smaller problems.
At this stage, certain computational methods came into handy for analysis of the system known as COMPUTATIONAL FLUID DYNAMICS(CFD Packages) which gives us a cost effective Commercially available CFD code packages which helps in analysing a simple system to complex system. Here we are using ANSYS FLUENT CFD software to analyse the mixing eficiency and homogenity of mixture of fluid which is air over here.
AIM: To understand the mixing efficiency in a TEE junction where the mixing of hot inlet air which is at 360C entering horizantally with cold inlet air which is at 190C which is entering verically. Also we have to observe certain aspects of the like diffusion, temperature and velocity contours across and along the flow of the fluid.
For this challenge, we have created two versions of the mixing tee. One of them is longer than the other.
Your job is to set up steady-state simulations to compare the mixing effectiveness when hot inlet temperature is 360C & the Cold inlet is at 190C.
Use the k-epsilon and k-omega SST model for the first case and based on your judgment use the more suitable model for further cases. Giving the reason for choosing a suitable model is compulsory.
- Case 1
- Short mixing tee with a hot inlet velocity of 3m/s.
- Momentum ratio of 2, 4.
- Case 2
- Long mixing tee with a hot inlet velocity of 3m/s.
- Momentum ratio of 2, 4.
Momentum ratio = velocity at cold inlet / velocity at hot inlet
In a table, compare the following values from the 2 cases.
- Cell count
- Average outlet temperature
- Number of iterations for convergence
Expected results:
- Velocity and temperature contour plots on the cut planes along and across the pipe.
- Velocity and temperature line plots along and across the length of the pipe.
- Perform Mesh independent study for any one case.
- Discuss the effect of length and momentum ratio on results.
MIXING TEE: A mixing tee is a type of fluid mechanics device used to combine two or more inlets of fluids into a single outlet.The design of the mixing tee allows for efficient mixing of the incoming fluids and a homogenous mixture to be output from the outlet. The mixing tee is used in a variety of different industries, such as in chemical processing, food production, and pharmaceutical manufacturing, HVAC.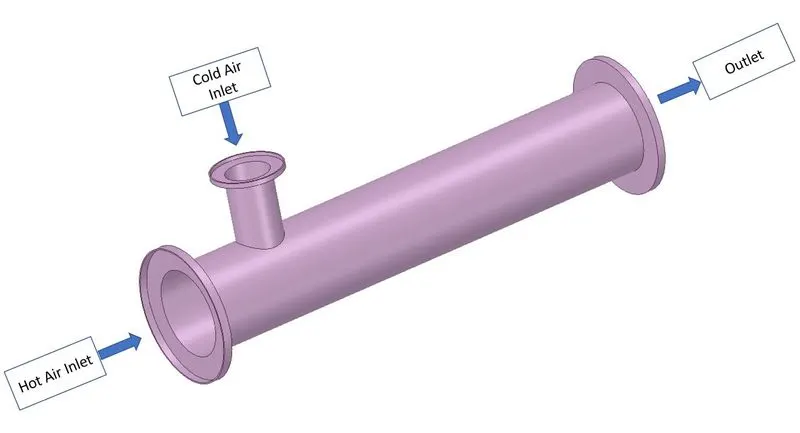
The homogenity of the mixture is also depend on the momentum ratio of fluids. We can alter the output by changing the velocites of fluids.
NOTE: Viscosity of gasses is directly proportional to temperature.
Modelling & Solving Approach:
In CFD study, it is divided into three stages viz;1) Pre-Procesing
2) Solving
3) Post-Processing.
Here we are using ANSYS FLUENT as a CFD software for analysis.
Setting up of physics:
As per the given statement a TEE model of varying length of 0.192m and 0.264m is given with area of cross-section for hot-fluid inlet (360C) of 0.0901m^2 and cold-fluid inlet(190C) of 0.025m^2. Assuming the flow is a steady state flow which gradually turns into Turbulent flow at the instance when both fluids interact with each other for mixing. Here on confronting of both fluids there will be dissipation
In CFD study, it is divided into three stages viz; 1) Pre-Procesing
2) Solving
3) Post-Processing.
Here we are using ANSYS FLUENT as a CFD software for analysis.
ANSYS FLUENT Setup:
ANSYS is aa commercially available CFD code package which is preferred by most people/companies in this segment. As it contains most of the required analysis tools required for CFD study.
From ANSYS workbench>Analysis System used FLUENT FLOW tool.The CFD study is divided into parts to work for it. 1)Geometry, 2)Mesh, 3)Setup, 4)Solution, 5)Results.
1)Geometry:
CFD is a domain where fluid flow and its behaviour is analysed which flows internally/externally. So, first geometry preperation of the model has to be done in such a way only for flow analysis. unnecesssary parts of the geometry can be removed.
It is important and relevant that unnecessary parts of the model should not be considered for Meshing stage. As it only increase the computational time and increass the wastage of resources.
SHORT TEE
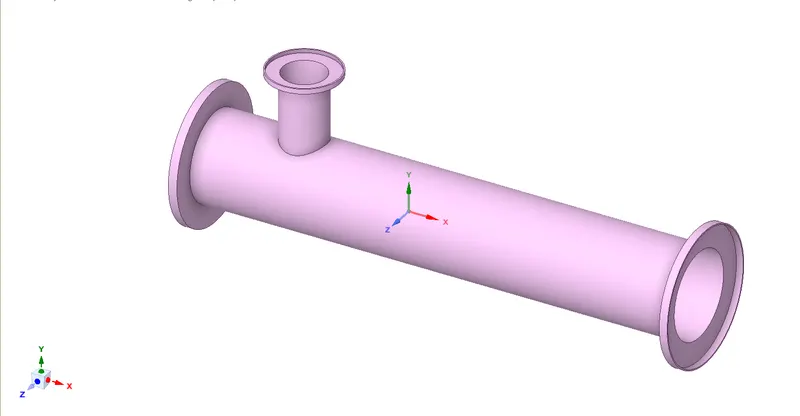
LONG TEE
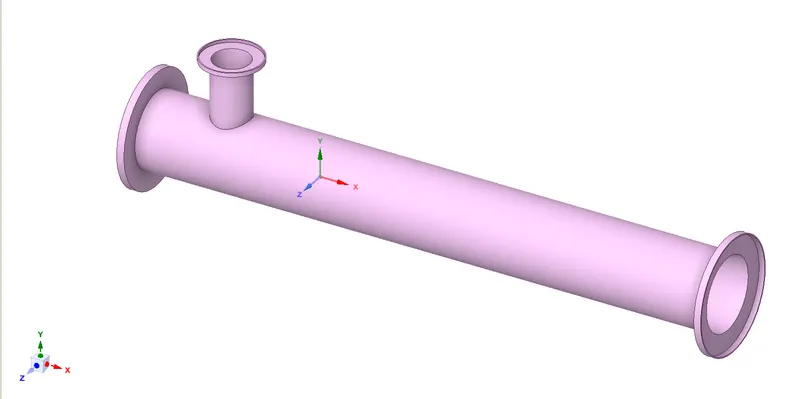
Above are given models, those are edited with Space-claim tool in ANSYS.Here we are only considering wetted surface or flow volume only for analysis.As the flow is completely internal and as walls are adiabatic there is Heat Transfer through conduction.
In Space-claim, by using Prepare>Select Edges selected the inlet, and outlet of the TEE. As it creates new volume for flow analysis. By using Supress for Physics option seperated the unnecessary part from whole given model.
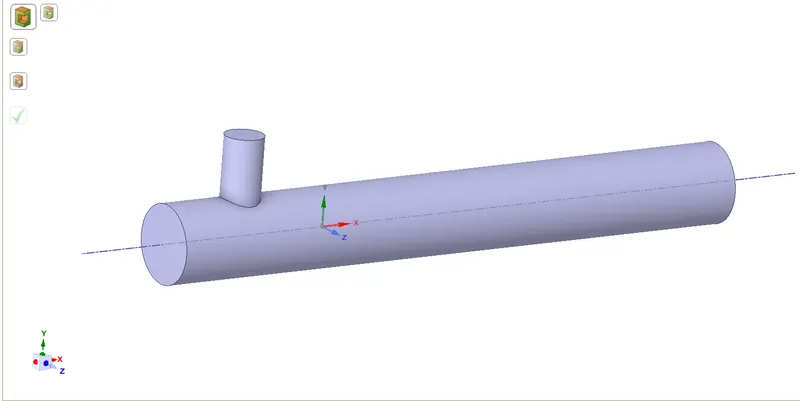
2) Meshing:
Here Named selection is given to identify the boundaries. As Cold Inlet, Hot inlet, Outlet & Walls.
To analyze the flow behaviour, the whole model should be divide into number of small elements. Then solve the governing equations of flow on each element and check for convergance of equations. Based on it we can obtain some results. out of which we need analyse the results for required results.
For proper consideration of geometry as it is cylindrical i nature, used Triangle mesh elements with 3mm Mesh element length.
Short Tee Meshing
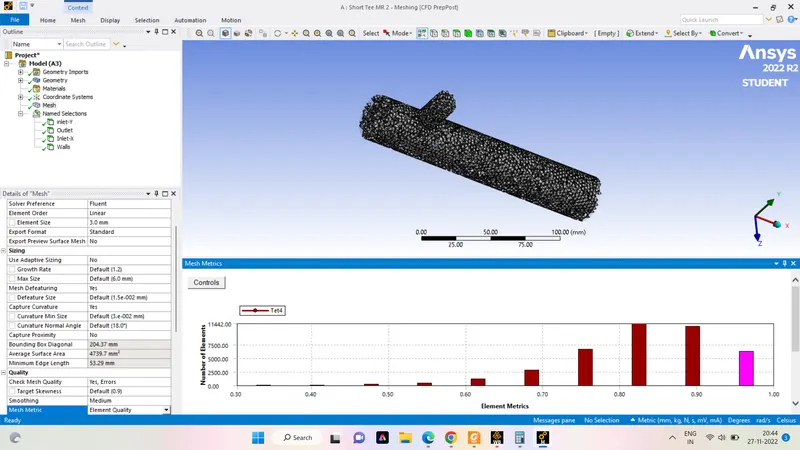
Number of Mesh elements obtained -39725 elements. Checked for quality criteria of mesh elements. Observed that >80% of mesh elements are of good quality.
Long Tee Meshing
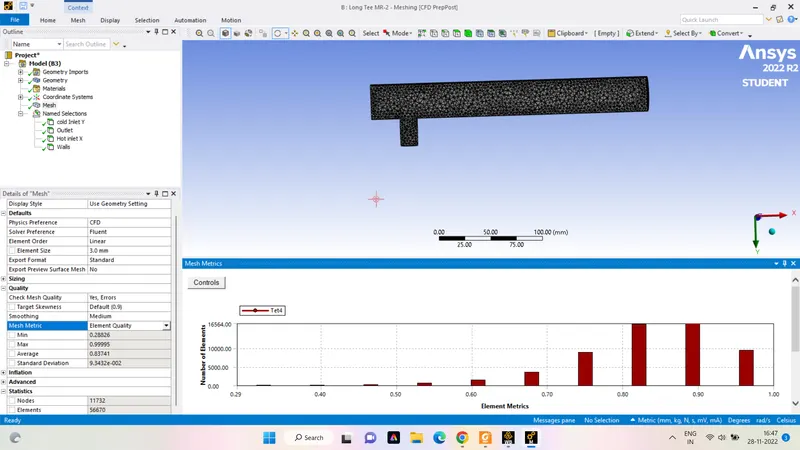
Number of Mesh elements obtained -56670 elements. Checked for quality criteria of mesh elements. Observed that >80% of mesh elements are of good quality.
3)Setup:
In setup we will define the Boundary conditions, type of working fluid, solver model based on flow type.
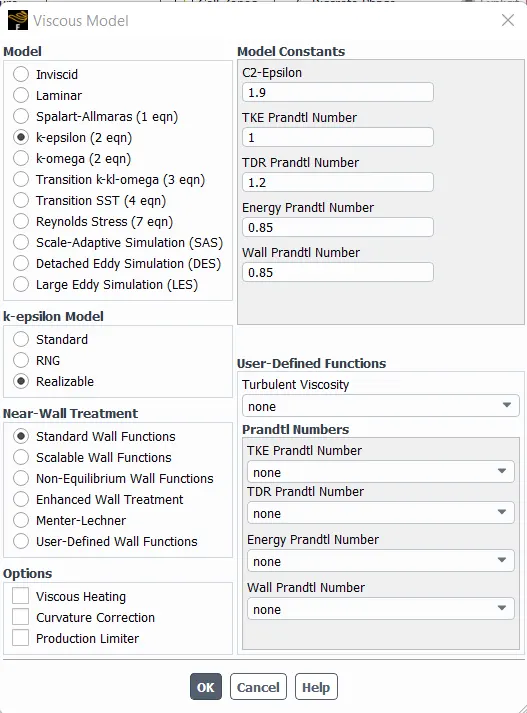
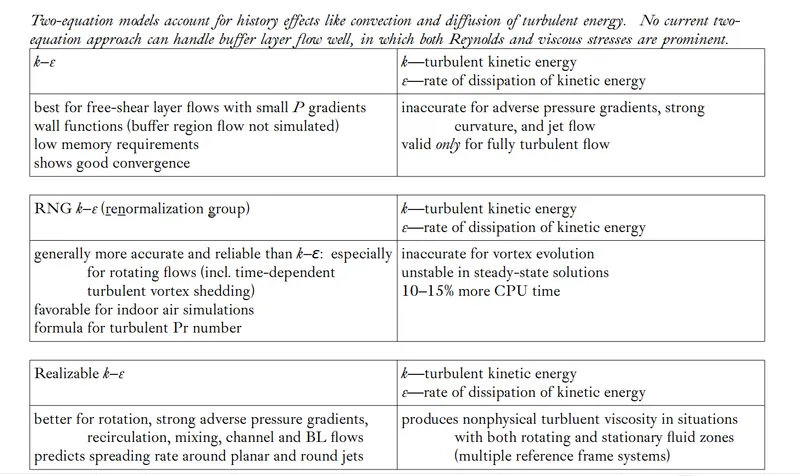
Used k-epsillon Realizeable model with Standard Wall Functions. Working fluid Air is set with defaault values provided in ANSYS FLUENT. Boundary Conditions were given as stated Hot fluid Inlet through HOT FLUID-X direction 3m/s with 360C & the Cold inlet is at 190C with 6m/s.
our main goal is to observe the mixing efficacy across the TEE and observe Temperature of fluid at outlet. So few reports were created such as Area Weighted Average of Temperature, Standard Deviation of Temperature.
4)SOLUTION:
Solution is Initialized with Hybrid model which contains default settings for it. And given with 300 number of iterations. As it is a Fluid Flow , when measuring the fundamental equations for each element , we need to check for the imbalance of the equations we need to check for convergence after each iteration. Also, certain residiual contours can be observed for convergence. The convergence values are given for 0.001 which is default, so that we can stop iteration when the values reached till that value or near to it.
Short Tee Observations for Momentum Ratio-2
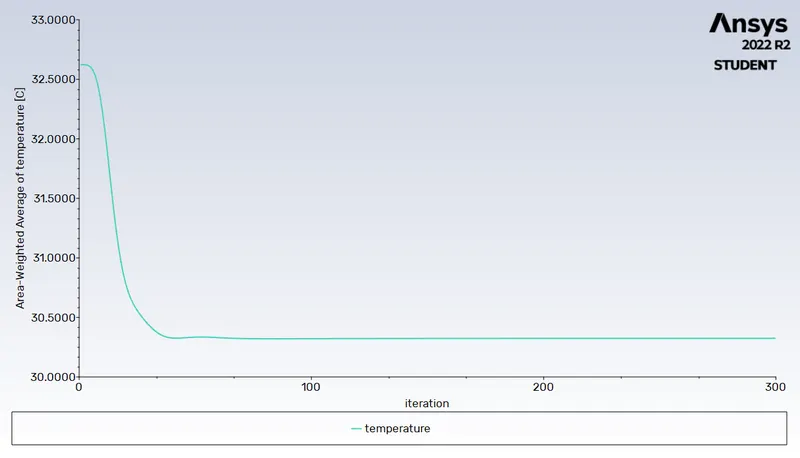
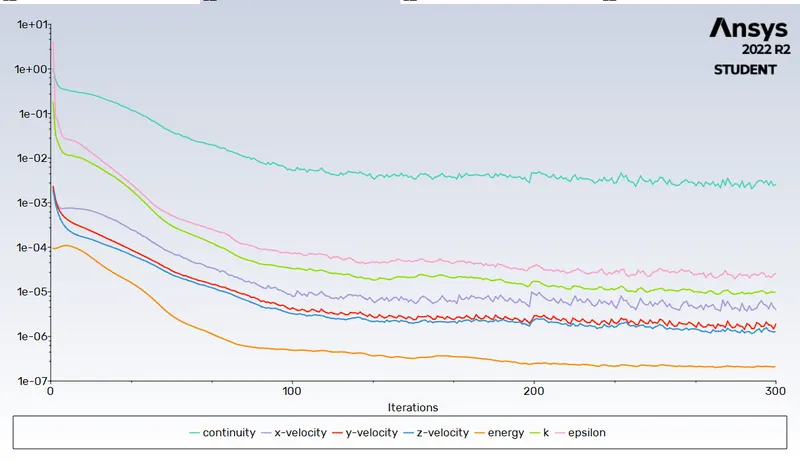
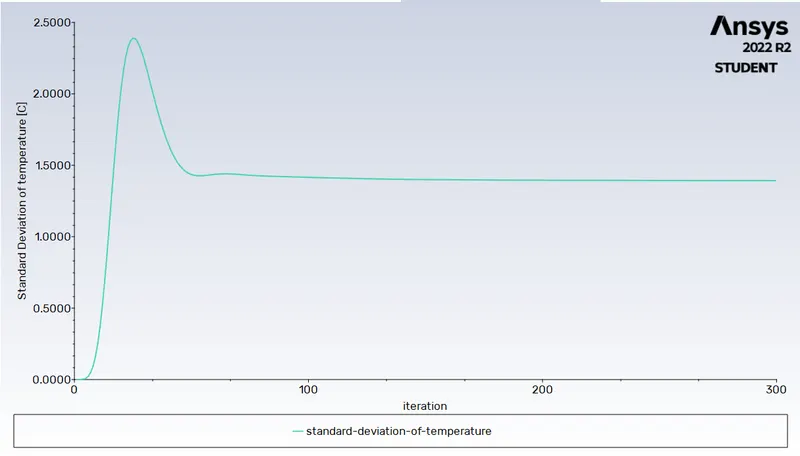
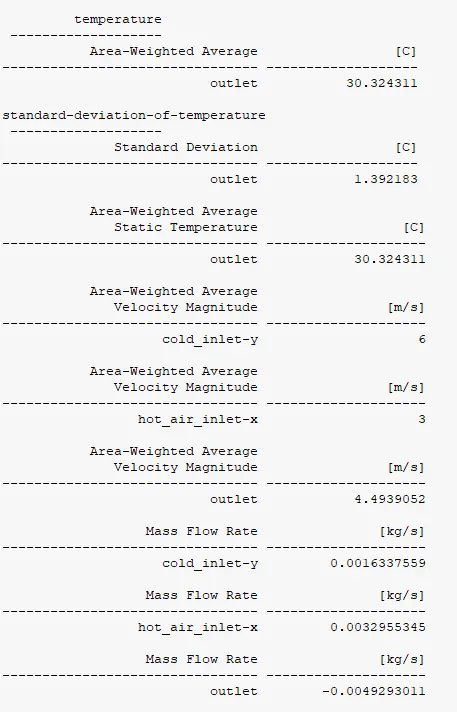
From the above observations, we can see that Temperature converged in between 45-50th iteration achieved a temperature of 30.2340C.
The same has been repeated for the same model with Momentum Ratio of 4 and also for Long Tee with momentum ratio of 2&4. Following were the results oberved.
| CASES | MODEL |
LENGTH OF GIVEN MODEL in meters |
MOMENTUM RATIO |
HOT INLET VELOCITY in m/sec |
COLD INLET VELOCITY |
OUTLET TEMPERATURE |
STANDARD DEVIATION of Temperature |
| 1 |
Short Tee |
0.1924 | 2 | 3 | 6 | 30.32 | 1.39 |
| 2 | Short Tee | 0.1924 | 4 | 3 | 12 | 27.58 | 1.55 |
| 3 | Long Tee | 0.2634 | 2 | 3 | 6 | 30.31 | 1.56 |
| 4 | Long Tee | 0.2634 | 4 | 3 | 12 | 27.53 | 0.57 |
5)RESULTS:
In ANSYS there is a tool called CFD-POST. With the help of this we can obtain further understandings by manipulating the data obtained from previous precesses.
By using this feature/module, observed the Temperature distribution, Velocity (Flow Varibale) contours across the region and at end point of outlet in the form of contour graphs & Charts.
Below are the post Procesed results of Short Tee- MR(momentum Ratio)-4.
STREAMLINE Creation:
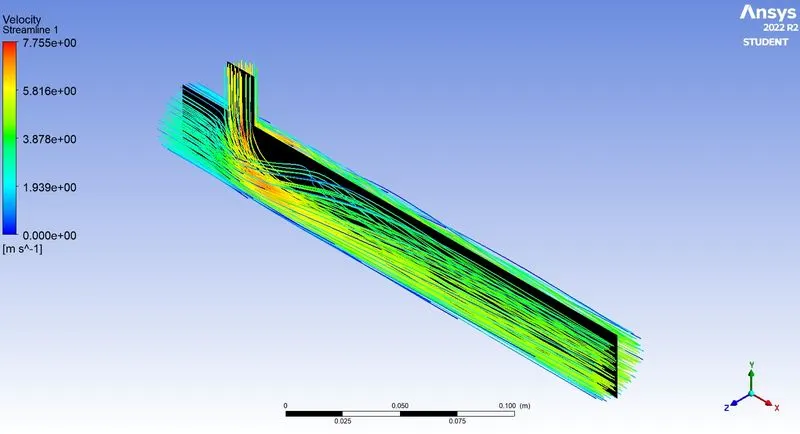
To observe fluid flow visually, STREAMLINES will help much better and in instant way. So Streamlines were created to represnt the flow. By observing the pattern, the region at which were the cold fluid enters into the channel, thre is a wake regin which means near ZERO pressure zone. In this juncture, there is no flow observed(Not Zero Flow).
TEMPERATURE CONTOUR:
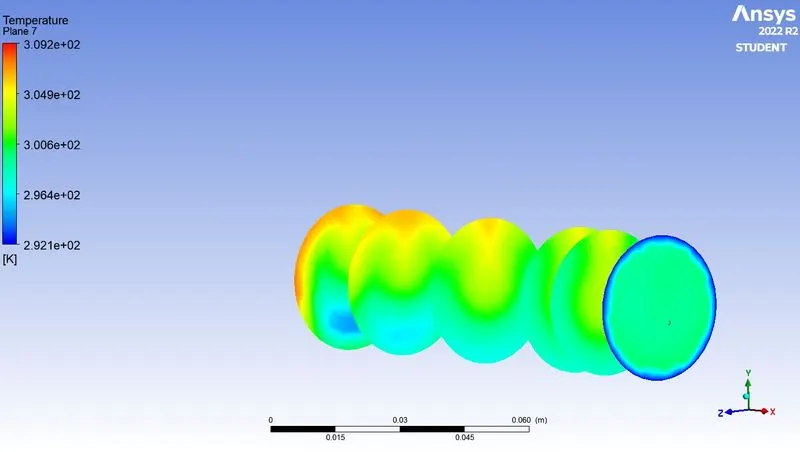
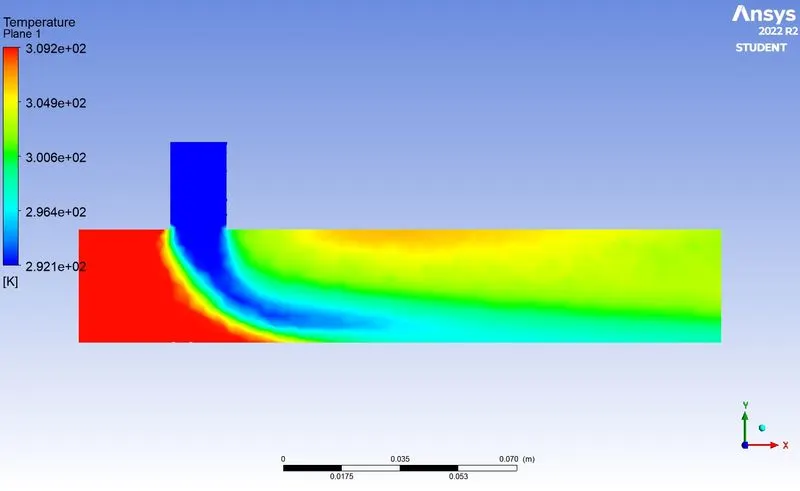
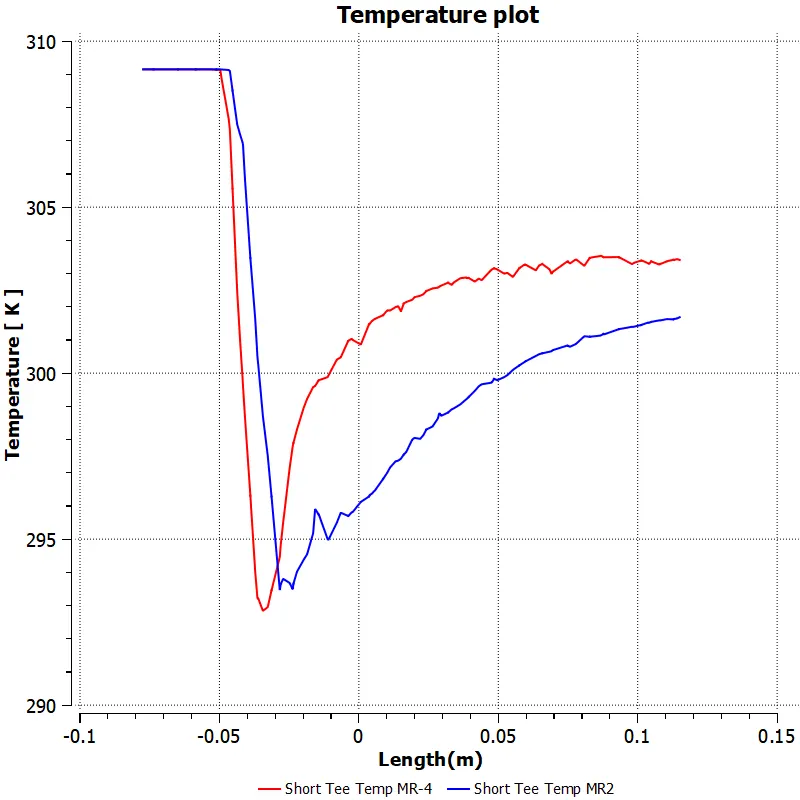
To observe the temperature distribution across the flow INSERTED a PLANE into model. On the plane a contour plot has been plotted. It helped in understanding the following: Temperature Distribution, Dissiption of Heat,Boundary temperature conditions, also the main concern of the problem statement which is MIXING EFFICACY of FLUID with respect to temperatue.
VELOCITY CONTOUR:
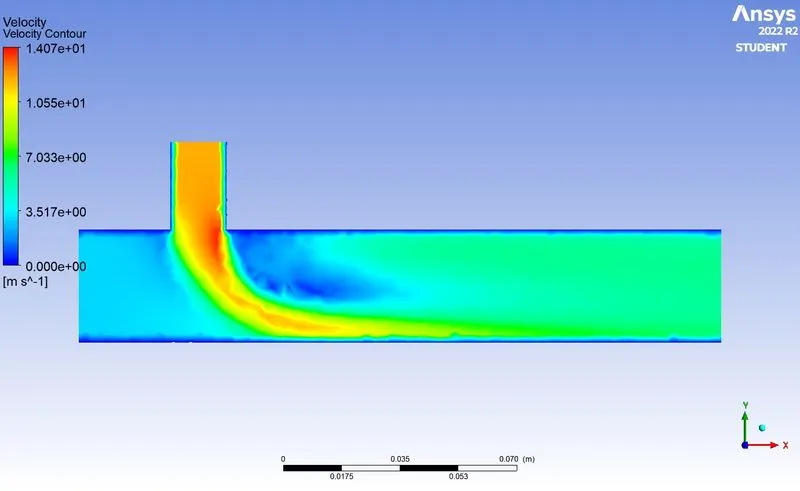
To observe the Velocity distribution across the flow INSERTED a PLANE into model. On the plane a contour plot has been plotted. It helped in understanding the following: Velocity Distribution, Dissiption of Velocity,Boundary Velocity conditions, also the main concern of the problem statement which is MIXING EFFICACY of FLUID with respect to Velocity.
Observations From Contours:
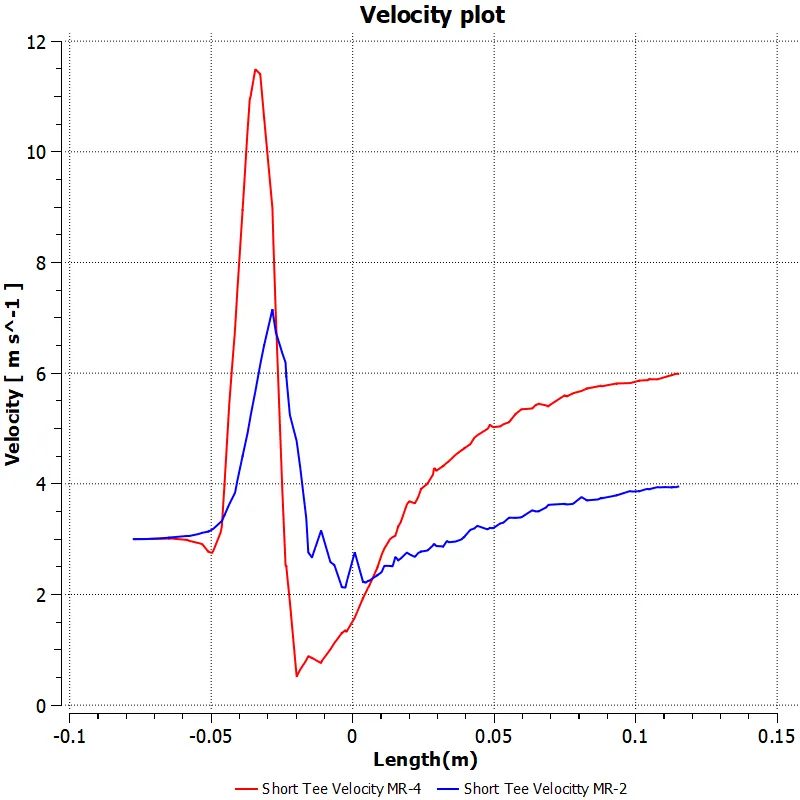
From the above contours and from we can say that, as the velocity of cold fluid is high, when it entering into the Tee perpinduclar to Hot fluid , a wake region has been created. Resulting in low presure zone. At that region Temperature and velocity distribution is low. Wake region may cause EDDIES which results in undesired results. (As of now we need not concern about that region. It is not creating any huge difference).
in velocity contour we can see that on Walls of the channel, the fluid moves with LOW VELOCITY beacause of viscous nature of fluid.
CHART CREATION:
To observe the obtained data in the form of graph used CHARTS option.
To observe the temperature and velocity phenomenon across the Tee , inserted a LINE across the TEE channel which will act as a reference line.
CONCLUSIONS:
From the above obtained results, there is not much difference between output Temperatures of two models with same momentum ratios. But, standard deviation of results are varying at minimal range. We can see that mixing efficacy is good in LONG TEE with Momentum Ratio of 4(Velocities with Hot Inlet 3m/s and Cold Inlet 12m/s).
it is said that by observing the standard deviation results which is 0.57.