Week 1- Mixing Tee
Objective
- To run the case for different turbulence model, and different momentum ratio
- To generate the contour plots and to compare the resuts with grid indepennce study
Introduction
Mixing Tees are widely used in petrochemical and HVAC industries , in which two fluid streams with different chemical or physical poparties mix together into one combined stream.
Procedure
Cad Cleanup
The Cad model is imported in to the SpaceClaim to extract the fluid volume from the model.
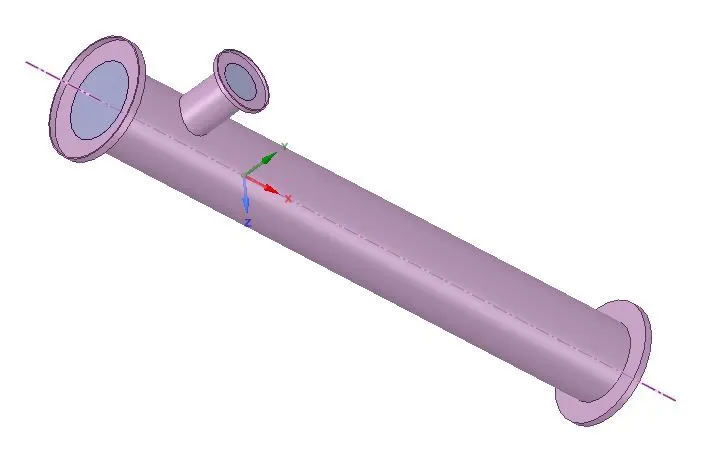
Fig.1
Figure 1 shows the cad model without volume extraction
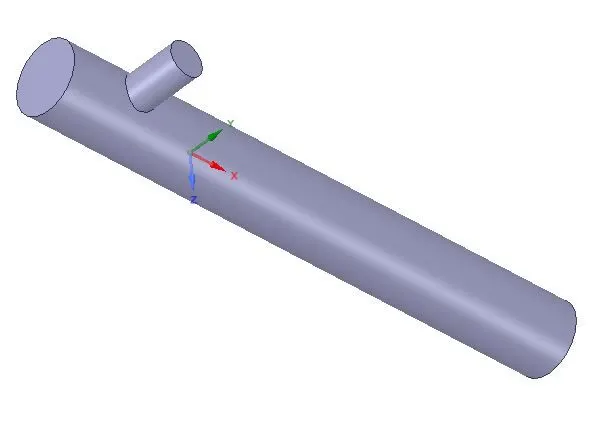
Fig.2
Figure 2 shows the CAD model with volume extraction
Mesh
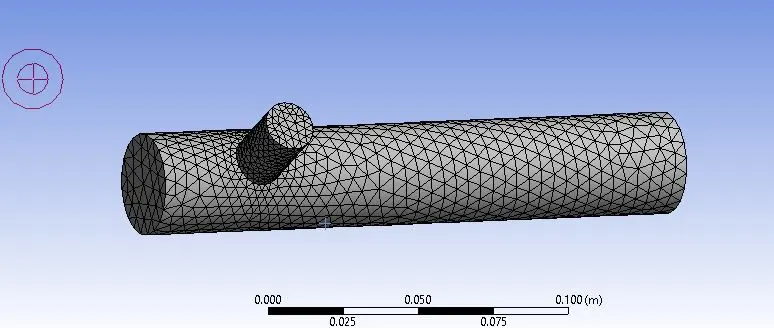
The specific boundary names are applied in this section, and mesh is generated
Case setup
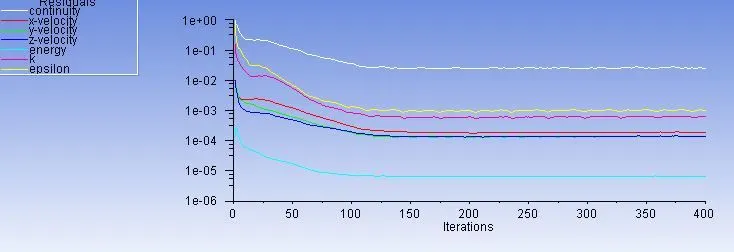
In this section , Suitable boundary condetion are applied like inlet, outlet and wall. Turbulence model is set up for solving the equation and number of iteraions are fixed in this section.
Postprocessing
In postprocessing section, contours are plottrd to visualize the proparies like temperature , velocity for which simulation is run
Case-1 (a)
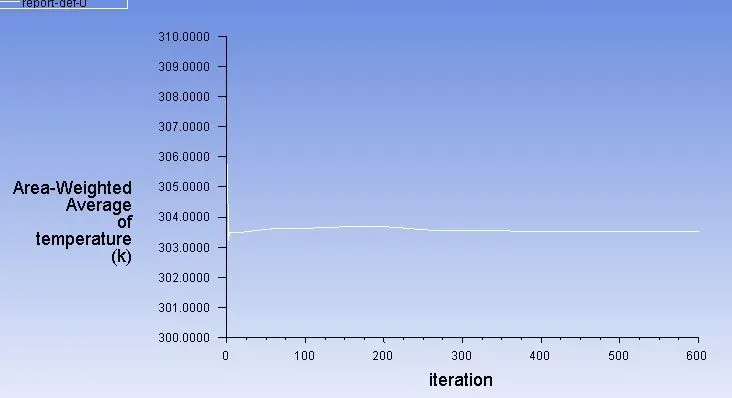
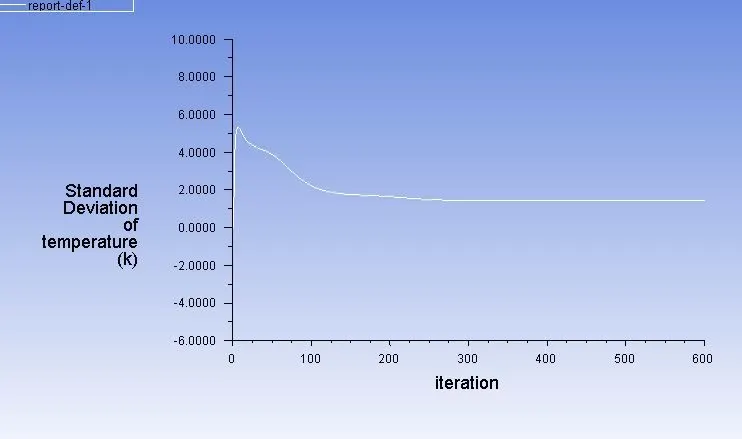
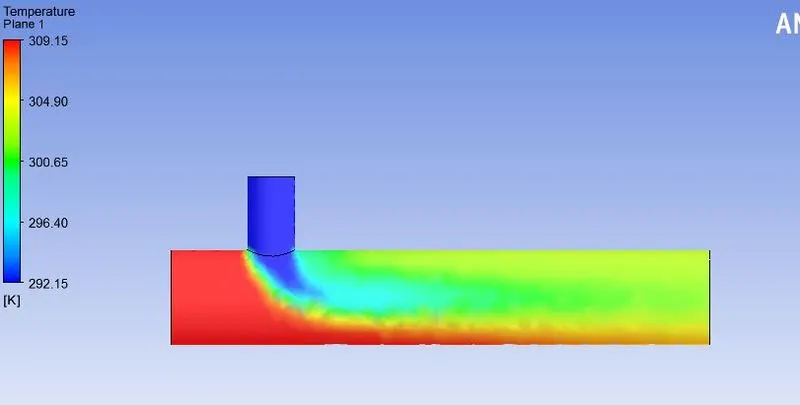
- Short-tee geometry is used
- Mesh is generated with element size 0.010187
- Ran the case with inlet velocity 3m/s and momemtum ratio 2
- Turbulence model is set to K-epsilon model
MESH:
Residual Plot
Average Weighted Average of Temperature
Standard Deviation of Temperature
Contour
Case-1 (b)
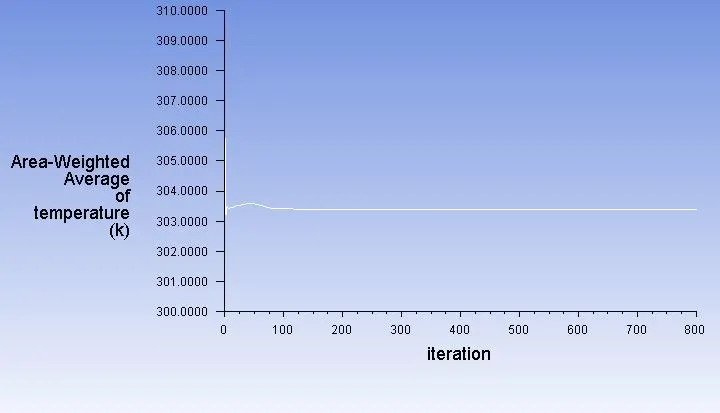
- short-tee geometry is used
- Mesh is generated with element size 0.010187
- Ran the case with inlet velocity 3m/s and momemtum ratio 2
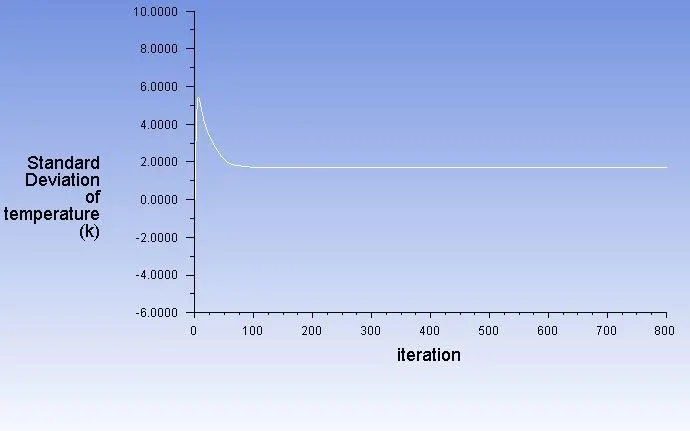
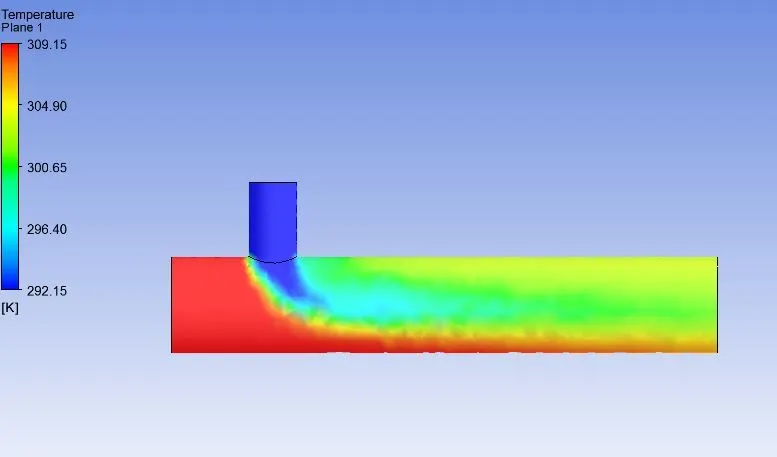
- Turbulence model is set to K-omega-sst model
Average Weighted Average of Temperature
Standard Deviation of Temperature
Contour
Turbulence Model Effect
K-epsilon model predicts well away from the boundaries and K-omega model predicts predicts the flow behaviour well near the wall boundaries .For free flow k-epsilon is model is recommended. There fore K-epsilon model is used for further cases.
Case 1(C)
- Short-tee geometry is used
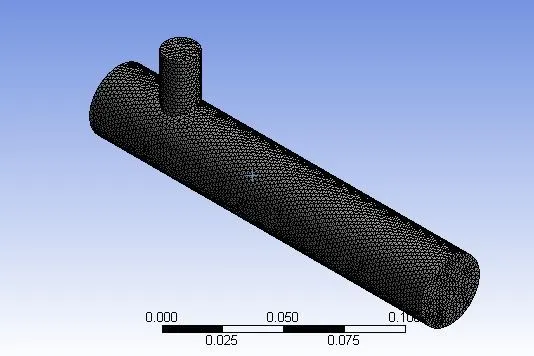
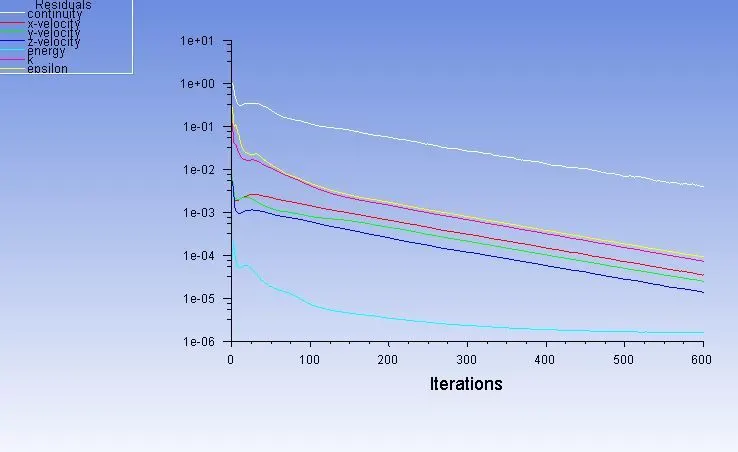
- Mesh is generated with element size 0.002
- Ran the case with inlet velocity 3m/s and momemtum ratio 4
- Turbulence model is set to K-epsilon model
Mesh
Recidual
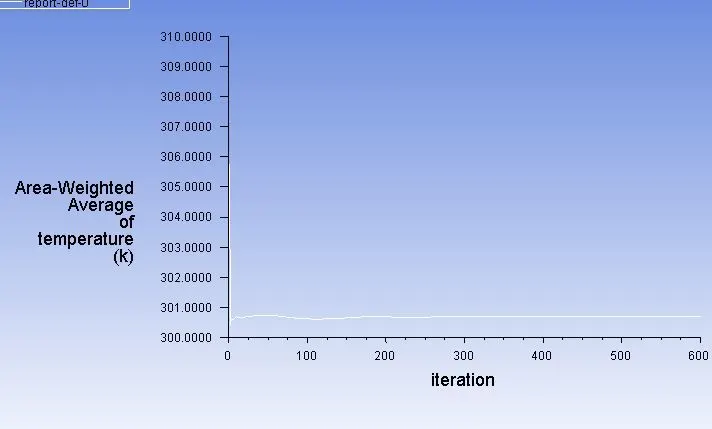
Area -Weighted Average of temperature
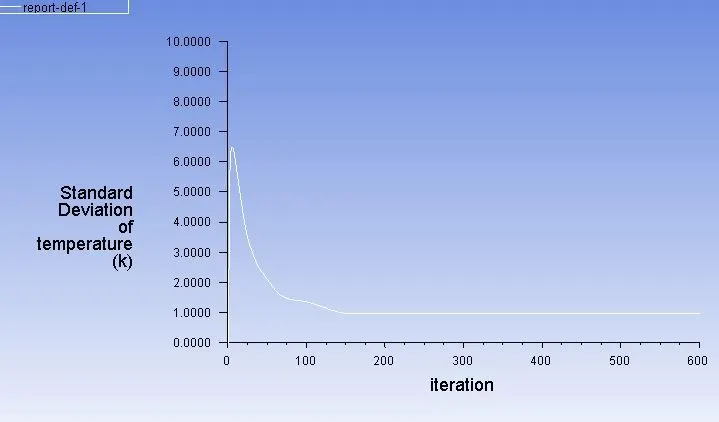
Standard Deviation of temperature
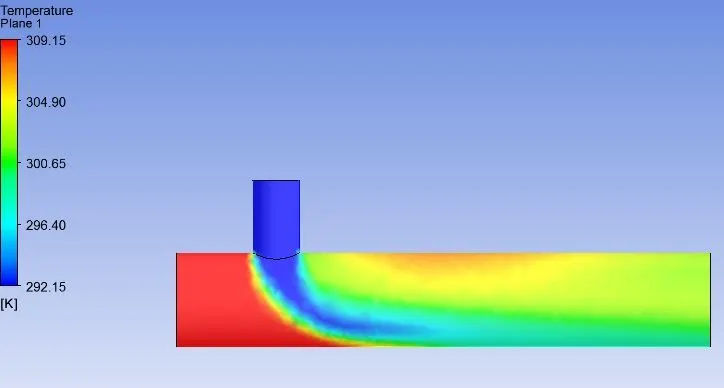
Temperature Contour
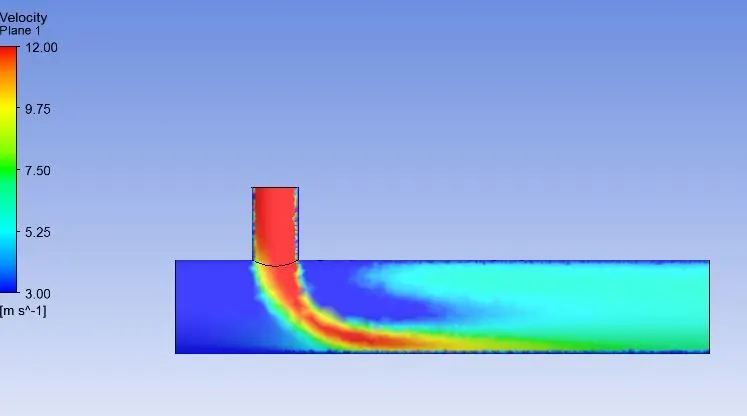
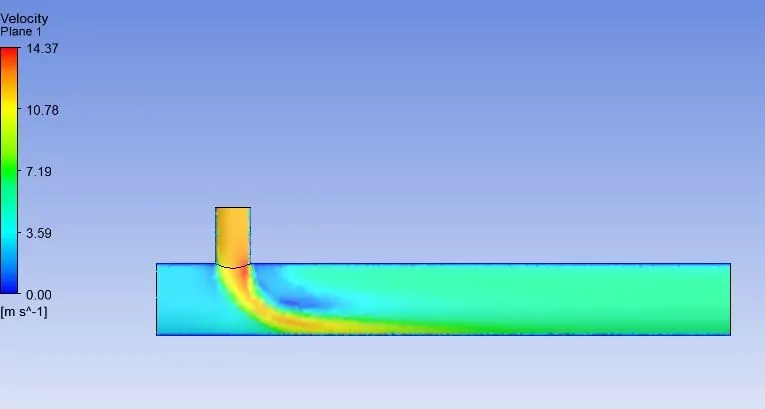
Velocity Contour
Grid independent study
The grid size of 0.002m gives better results than the grid size of 0.01087m. But very fine refinement of mesh is not affecting any result in this case . therefore the grid size 0.002 m is considered for further cases.
Case-2 -(a)
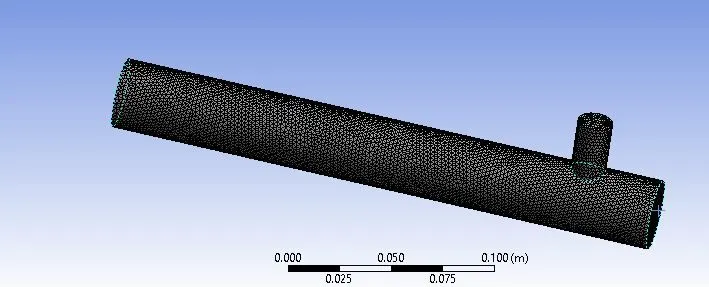
- Long-tee geometry is used
- Mesh is generated with element size 0.002
- Ran the case with inlet velocity 3m/s and momemtum ratio 2
- Turbulence model is set to K-epsilon model
Mesh
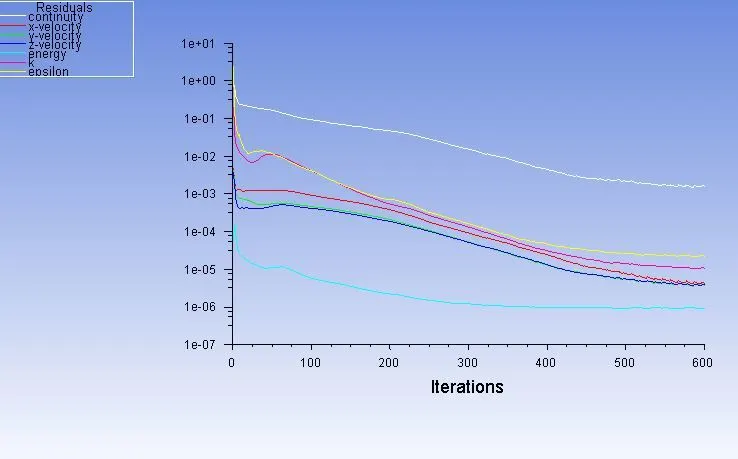
Recidual Plot
Area Weighted Average of Temperature
Standard Deviation Temperature
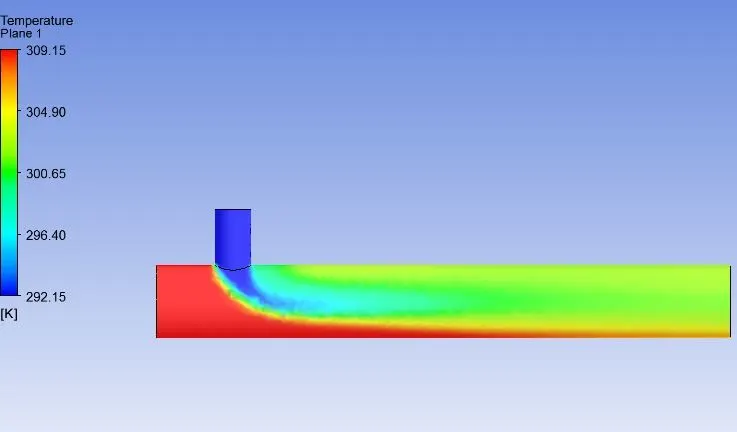
Temperature Contour
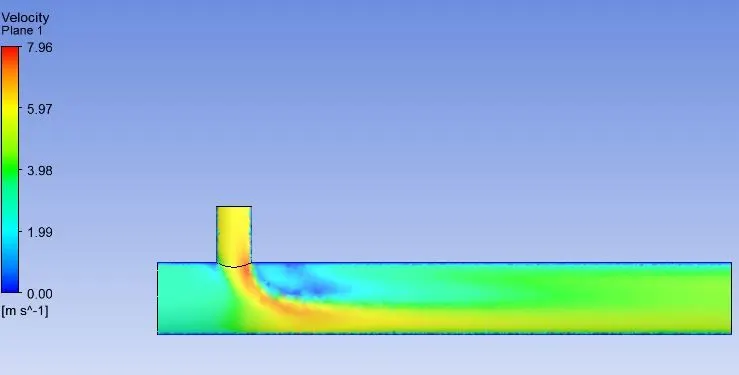
Velocity Contour
Case-2-(b)
- Long-tee geometry is used
- Mesh is generated with element size 0.002
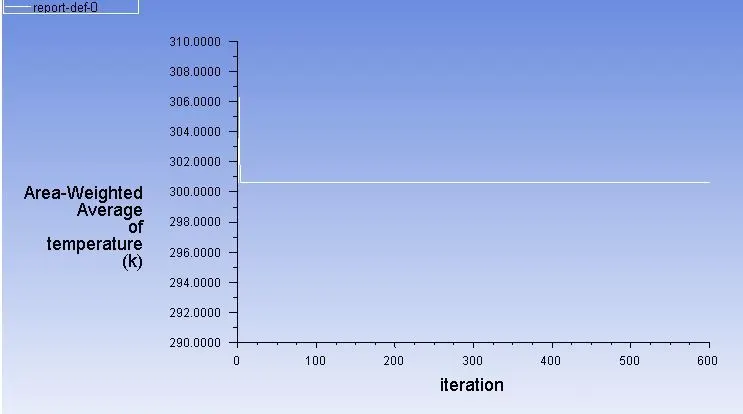
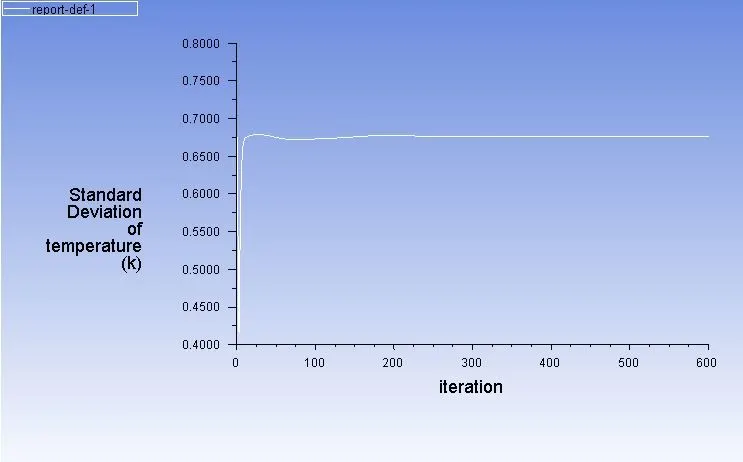
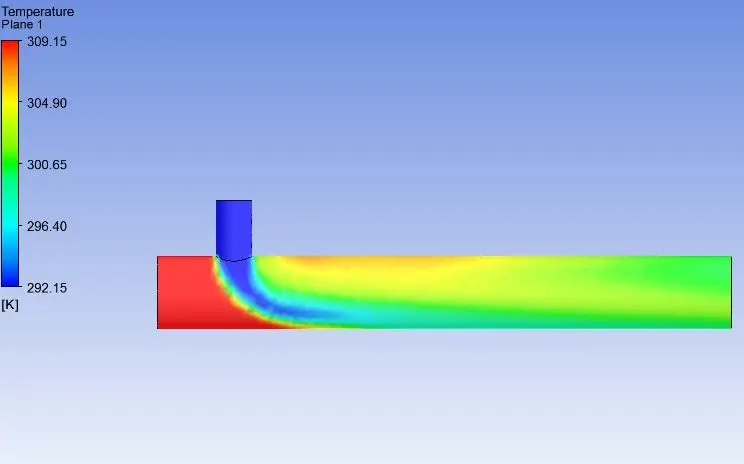
- Ran the case with inlet velocity 3m/s and momemtum ratio 4
- Turbulence model is set to K-epsilon model
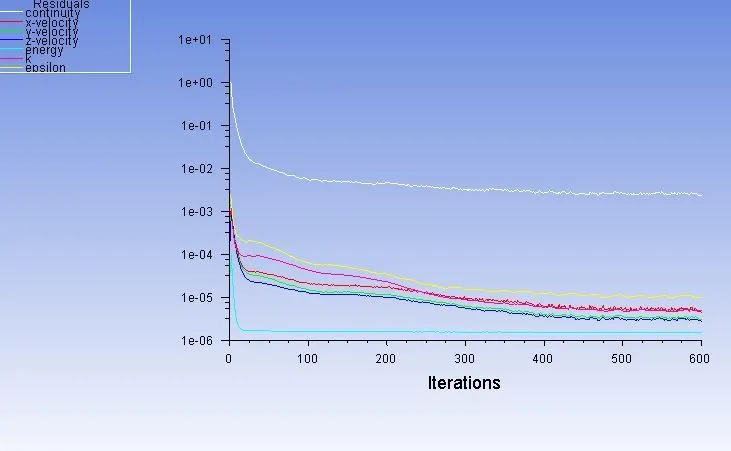
Recidual Plot
Area Weighted Average Temperature
Standard Deviation of Temperature
Temperature Contour
Velocity Contour
Conclusion
By Analysing the results we came to know that if momentum ratio increased, there is decrease in the outlet temperature. And there is no effect of velocity if length is increased.