Literature Review of Research relevant to Energy Chain Analysis
Literature review of research relevant to energy chain analysis
Introduction:-
- The persistent belief in the inefficiency of Power Plants has led to the widespread assumption that EV is less efficient than ICE for the entire energy chain
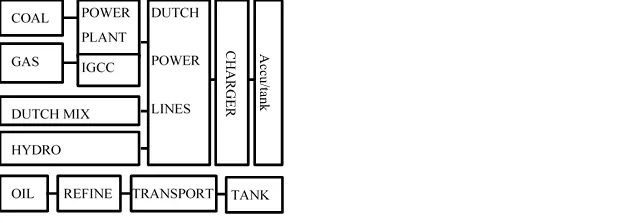
- In this paper oil, natural gas, coal, wind and water form the bases of the energy chains for operational vehicles which are used in Rotterdam, the Netherlands.
Methods:-
- The energy chain is divided in Well-to-Tank (WTT) and Tank-to-Wheel (TTW). Both parts contain different possibilities and their specific energy losses.
- The oral information from the president of Shell Netherlands BV [5] that the current energy costs are 0.2 barrel for the production of 1-barrel oil,
- In the TTW analysis the brakefactor (BF) as proposed by Van Sterkenburg et al. is used. The BF indicates the possible regenerative brake energy (Wbrake) of the vehicle in a certain trip based on a measured drive cycle.
- The figures used for the estimations were based on middle class cars (1050 – 1350 kg exclusive batteries) in urban traffic of Rotterdam. Because of usability in other energy pathways or drive cycles the efficiency is expressed in terms of percentage rather than in energy per unit distance. The energy losses by evaporation of petrol and the self-discharging of batteries were left out. They are small and depend on the conditions of use.
Result:-
ICE (Internal Combustion Engine):-
Well To Tank :-
- Crude Oil has an efficiency of 0,025 MJ/MJ with a variation in the range from 0,01 – 0,04 MJ/MJ
- Oil transportation has a loss of 1 % including the empty return of the tanker. Refining in Europe has a loss of about 6 %. This is a conservative figure because the EU-report [3] gives 0,08 MJ/MJ for gasoline and 0,10 MJ/MJ for diesel. However, the side-products of the refining are disturbing a clear view on the energy needed. Distribution of petrol and diesel takes about 20 kJ/MJ
- In urban traffic the useful energy for middleclass cars is 11% to 18% of the energy of the raw material. From the energy of the raw materials 83% to 88 % reaches the tank. The biggest energy loss of 80% to 85% is due to the poor mechanical efficiency of the ICE engine
Tank To Wheel:-
- For the TTW-efficiency the engine losses are the most dominant, for urban traffic an efficiency range from 13 % to 20 %.
- The introduction of start-stop systems will increase the efficiency, Bosch claims 8%. The practical profits and use of this system are not known yet.
- City cars with a lower mass are also more efficient. Nissan has co-developed Advanced High Tensile Strength Steel and claims that extensive use of this material can reduce mass by 15% for all its models in 2017
Electric Vehicle:-
Well To Tank:-
- The WTT for EV highly depends on the choice of the type of Fossil Energy Power Station or Green Energy source
- The coal power plant has an efficiency of 39%. With integrated gasification combined-cycle (IGCC) an efficiency of 44% to 55% is possible. In case of CO2 Capture and Storage (CCS) a loss of efficiency of 8% is expected.
- A gas power plant has an efficiency of 43%, with a combined cycle this can increase to 55%., gas and some nuclear and renewables has an efficiency of 42%
- Despite Renewable energy have less negligible running cost, it have the energy losses whilw transporting to the tank of car.
- Loss of Energy due to transportation is as below
|
Cause: |
Loss [%] |
|
Extra high voltage line 380/250k |
0,9 |
|
High voltage line 150/110 kV |
0,6 |
|
Medium voltage line 10/50 kV |
0,1 .. 2,7 |
|
Transformer high/medium voltage |
0,5 |
|
Transformer medium/low voltage |
1,1 .. 2,6 |
|
Low voltage line 230/400 V |
1,4 |
- By local circumstances the efficiency of the power line will vary from 92% to 96%. The battery charger can, depending on the Electric Vehicle application, be part of the grid or of the vehicle and is available in different qualities
Tank To wheel:-
- For EV the TTW-efficiency is much better than for ICE. Overall driving efficiency of the Tesla Roadster is 88%
- In practice the driving efficiency of EV’s will strongly depend on the amount of regenerative braking, and the efficiency and mass of the battery. The efficiency of the motor depends more on the costs rather than on the physical possibilities. Regenerative braking has a direct positive effect on the WTW-efficiency. In urban traffic the use of regenerative braking will offset the mass effect
- The built-in safety limitations in the converter still give significant possibilities to optimize the regeneration process if you compare the relative low negative current for deceleration with to the higher positive current for acceleration
- Following are the actual efficiency of electric car:-
|
part |
Energy efficiency TTW |
|
|
pessimistic |
optimistic |
|
|
Battery |
0,80 |
0,99 |
|
Inverter |
0,94 |
0,96 |
|
Motor |
0,85 |
0,92 |
|
Transmission |
0,94 |
0,96 |
|
Mass effect/ regenerative braking |
0,82 |
0,94 |
|
Total |
0.49 |
0.83 |
Discussion:-
Even it might be debatable that some of the values used were estimated instead of actually measured the main findings will not change because it concerns little contributions. Only the best case for ICE is only just more efficient than the worst case for EV. This is mainly due to the positive TTW of EVs in urban traffic. Especially EV’s that are dedicated to Urban use will benefit from maximum regenerative braking and do not need high driving ranges. For highway use the efficiency for ICE is not studied, but will be probably better. For long distance traffic the advantage of generative braking is less and the need for more battery energy storage will increase the mass and therefore decrease the efficiency of EV.
Conclusion:-
In urban traffic the use of energy for EV is more efficient than then for ICE. The type of the power plant largely determines the benefits. The EV fed by old coal power plant hardly differs from ICE. The green certificate source is superior.
Referance:-
- https://www.mdpi.com/1996-1073/4/2/324/pdf#:~:text=The%20energy%20chain%20analysis%20consists,includes%20the%20energy%20consumption%20for
- https://www.osti.gov/etdeweb/servlets/purl/424842
- https://zero.sci-hub.do/3198/7d6c43b7ee753498945a04a223f8e5cb/righolt2013.pdf#view=FitH