Unsupervised Learning - Kmeans Week 11 Challenge
# Question 1
Similarly in categorial data is not as direct when itcomes to numerical data. The categorial data is first transformed to numerical values and both are standardised to make sense of the similarity and dissimilarity between among those features.
# Question 2
There were a lot of car related datasets so i decide to take car mileage dataset which i used got PCA.
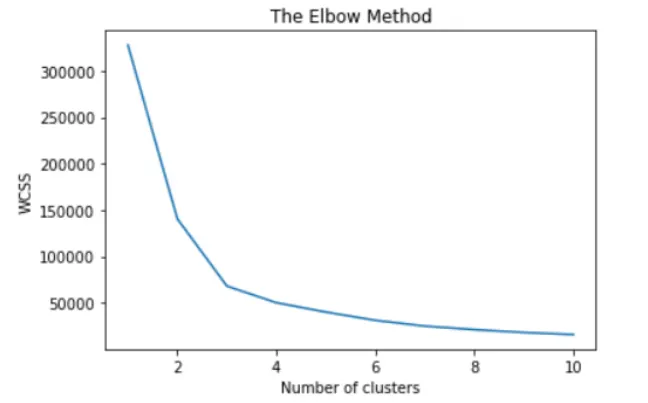
The data was imported and WCSS (or) SSE was done to perform the elbow method to find the optimum number of cluster.
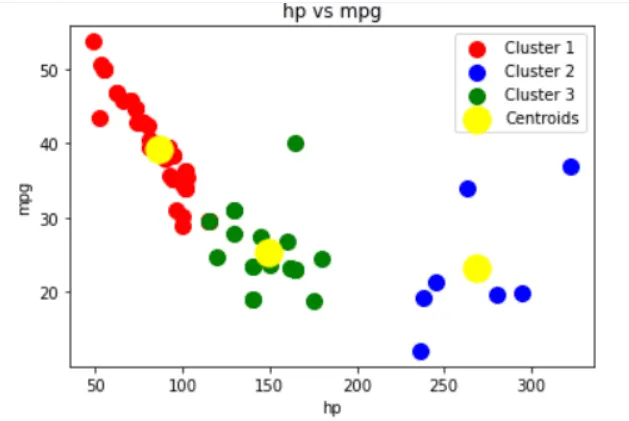
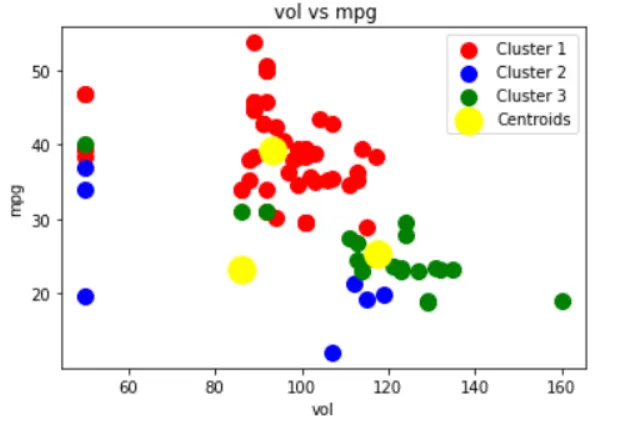
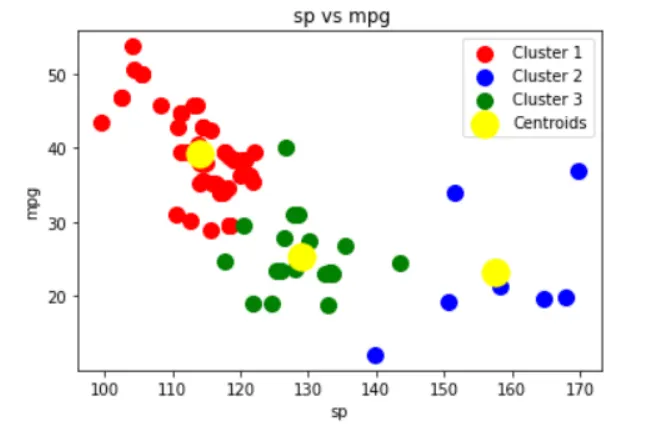
Then the model was trained for 3 clusters and multiple graphs we plotted to observe each feature's influence on mileage.
Mileage vs horse power
Mileage vs volume
Mileage vs SP:
Mileage vs weight:
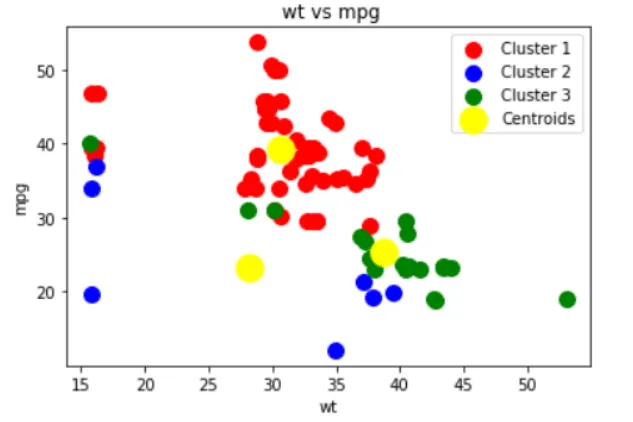
from these graphs we can arrive at few conclusions
The relationship between horse power sp and mileage are very clear the higher the value the lesser the mileage.
weight and volume dont seem to follow a simple correlation with mileage like the other 2. They appear to be the peripherals which affects the other 2 features relationship with mileage lie between the average values of the 2 features.
The cars with more mileage seem to focus less on HP and SP, and finds a balance between weight and volume to achieve the mileage.
The cars with more horse seem to aachieve a little more mileage by sacrificing volume and reducing weight.
Insights:
If a company wants to achieve maximum fuel economy they have to focus mainly on HP and SP. If their target audience doesn't care about space then they can reduce volume which with proportionally reduce weight and can increase the mileage of the vehicle.