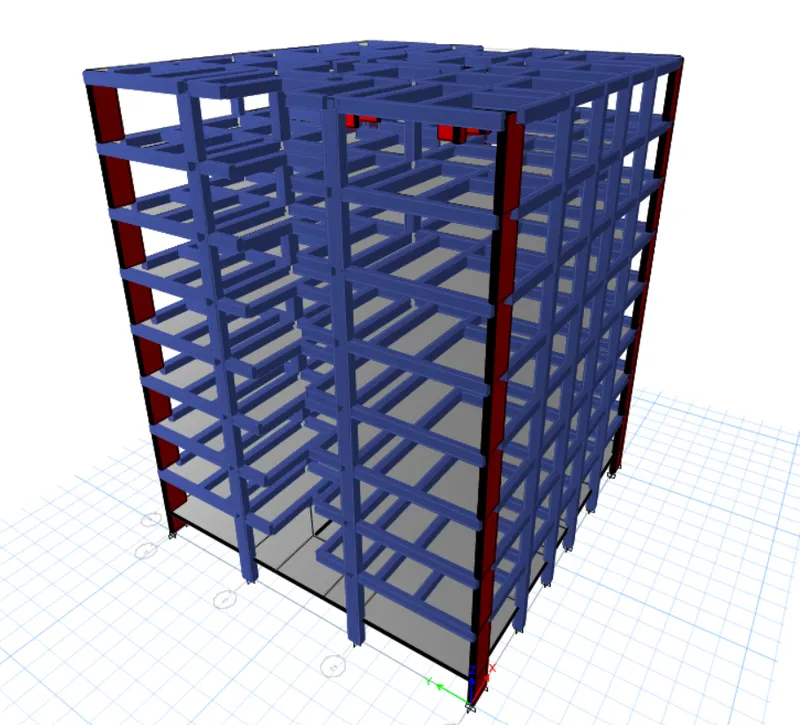
Structural Modelling using Etabs 2018
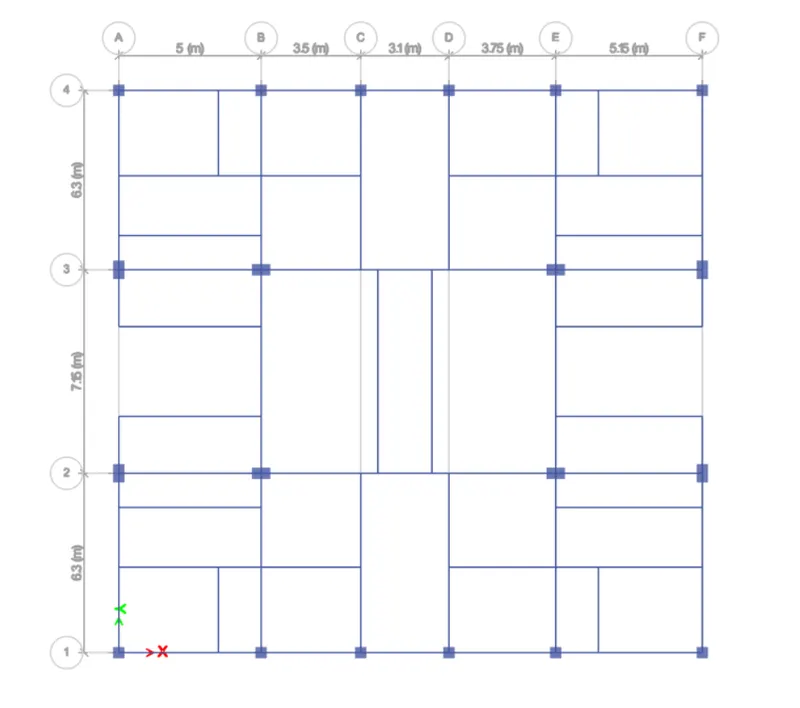
The architectural drawings for a G+7 residential building in zone 5 has been provided. The floor plan is the same for all 7 floor levels. Possible column positions have also been provided. Conceptualize a framing plan layout and then model the building in Etabs. The following architectural drawings have been provided:
- Typical floor plan – The location and thickness of the brick walls and the use of the
space (for estimating live load) can be obtained from this plan - A building section through the staircase and lift core is provided
- Parking layout in the ground floor – the column/shear wall arrangement must not
obstruct entry/exit of vehicles.
The following loadings are to be taken into account: - Brickwall made of AAC blocks
- Finishes – floor tiles of 75 mm thickness
- Live loads as per IS 875 part 2
- Water tank of 20 KL above the staircase at Mumty level
- Lift Machine room at mumty level above lift core
The structural model must comply with provisions of IS 1893 and IS 13920.
Run a modal response spectrum analysis and check analysis results of the etabs model for inter-storey drift requirements, vertical & planar irregularities, minimum shear wall requirements,maximum axial load ratio for column and shear walls, effective moment of inertia for beams
and columns etc.
Please note that the column positions shown in the architectural typical floor plan are only to provide an initial starting point for modelling. Participants will have to change its size, introduce shear walls, and add new vertical elements after running the analysis. You will have to run the analysis multiple times until a structural model is obtained that meets structural code requirements without compromising architectural functions. Also, there is no one ‘correct’ structural system for this challenge. There can be multiple possible solutions for this problem.
Answer
- ETABS is one of the most powerful software tools for structural analysis.
- 3D modeling, visualization, and automatic code-based learning are some of the unique features of this software.
- ETABS also supports several analytical models like response spectrum analysis, time-history analysis, and line direct integration time-history analysis.
Aim :-
- To model and analyze G+7 residential plan from given architectural drawings using Etabs 2018.
- To Run a modal response spectrum analysis and check analysis results of the etabs model.
Procedure :-
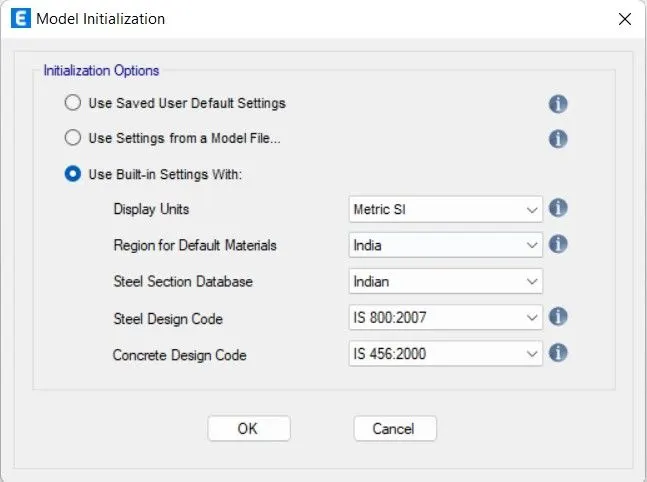
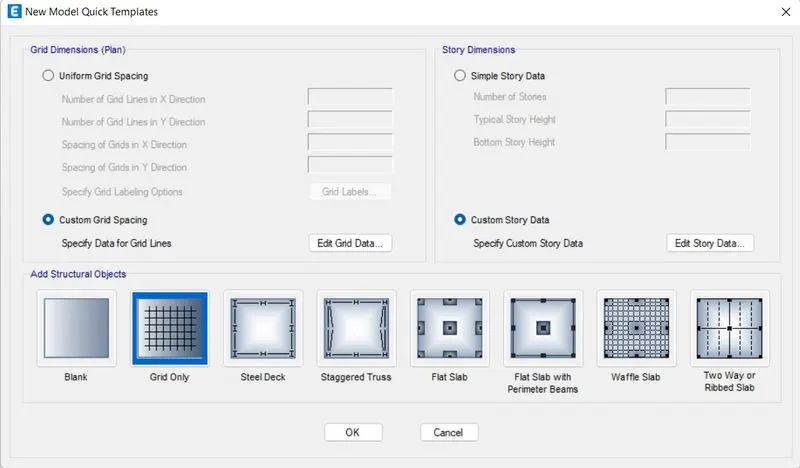
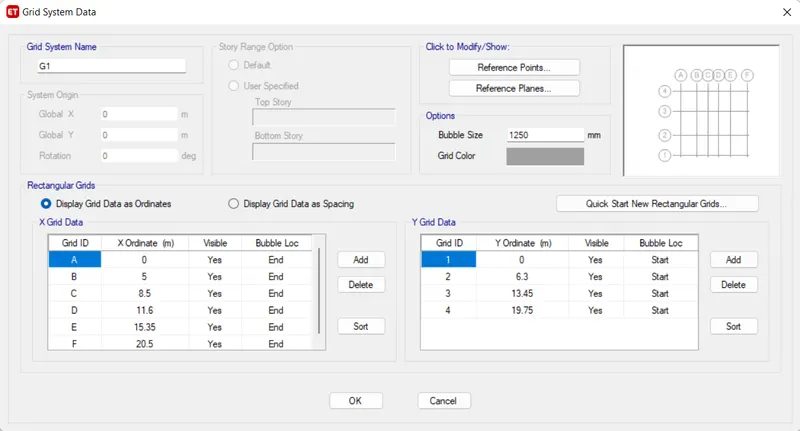
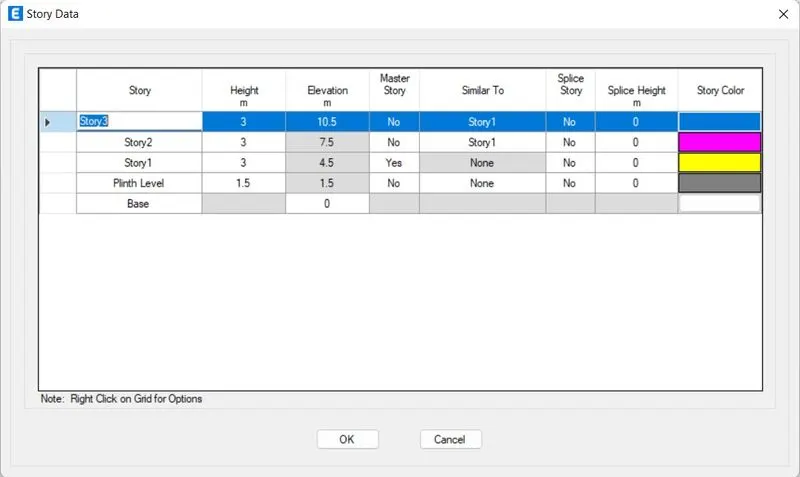
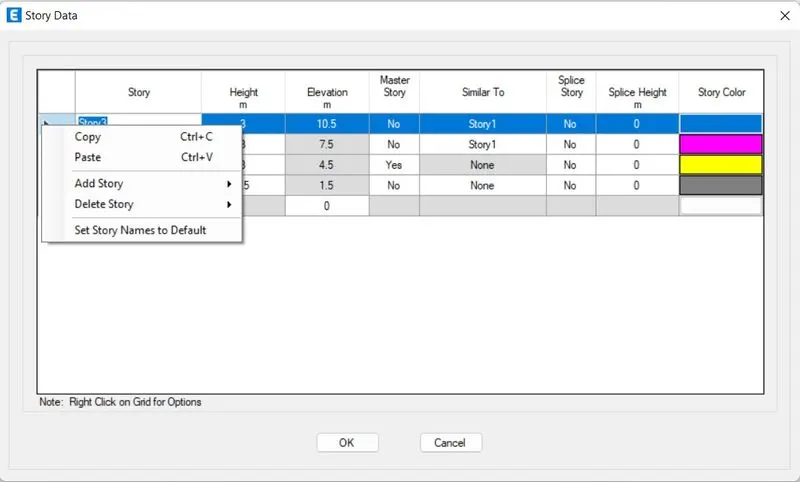
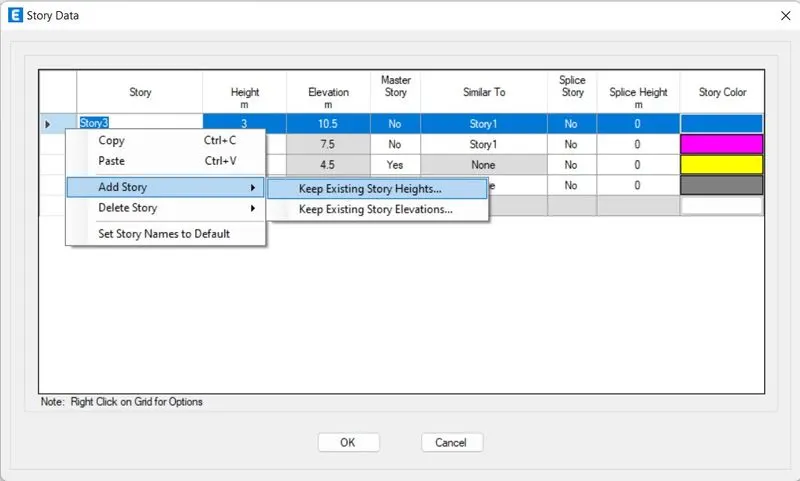
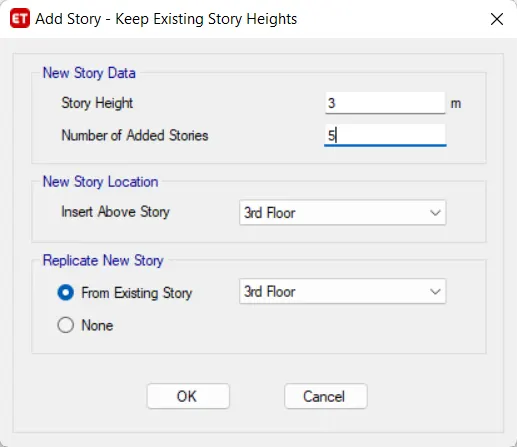
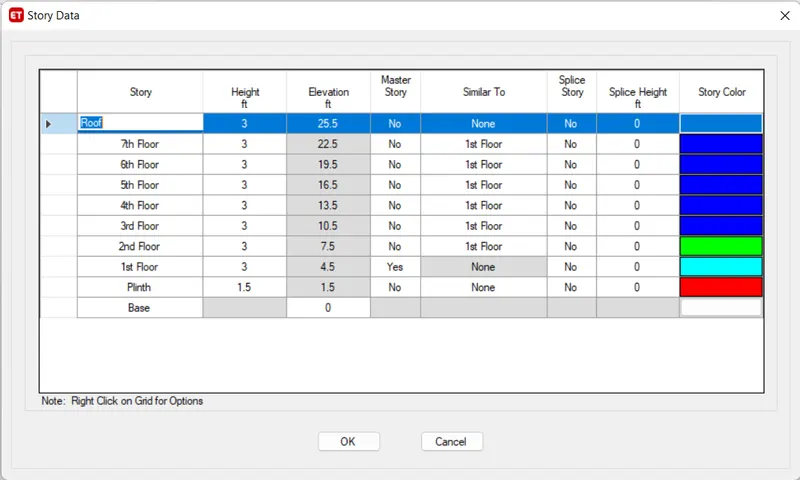
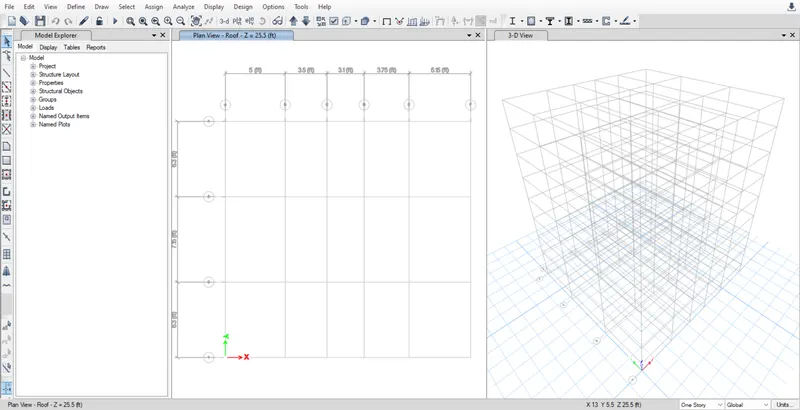
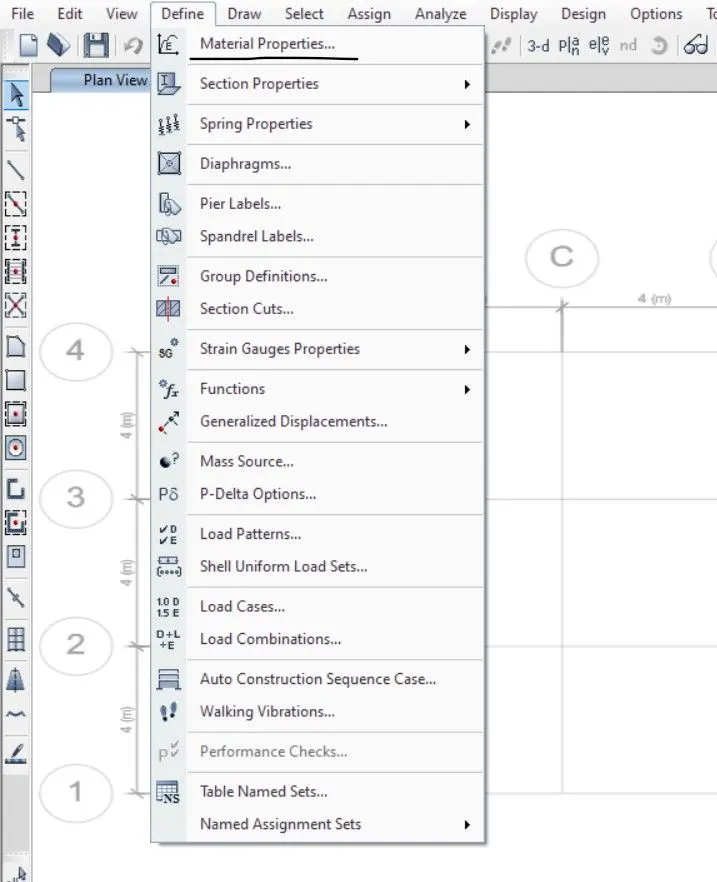
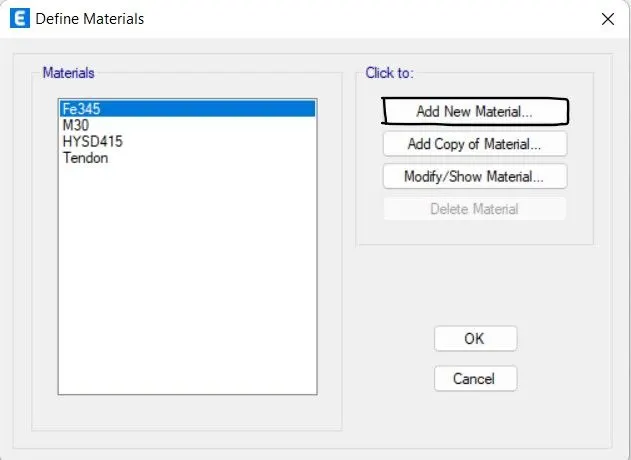
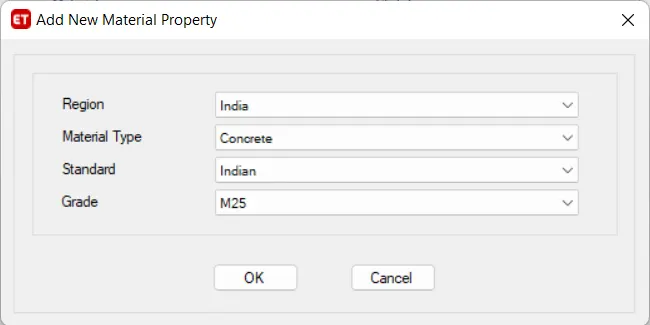
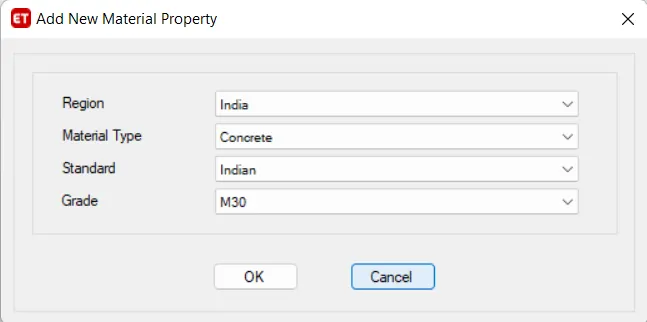
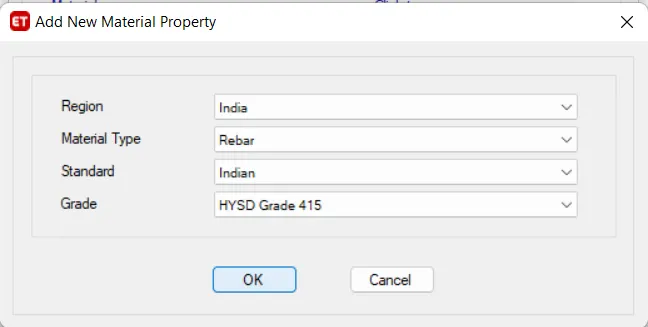
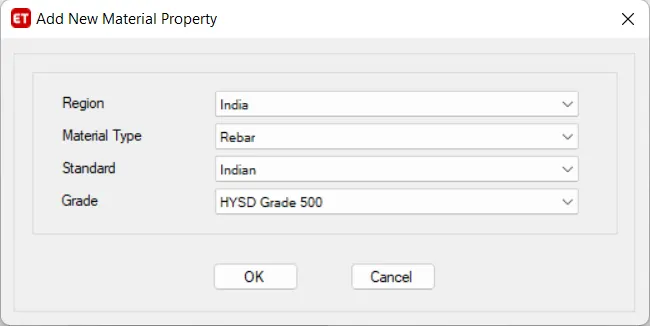
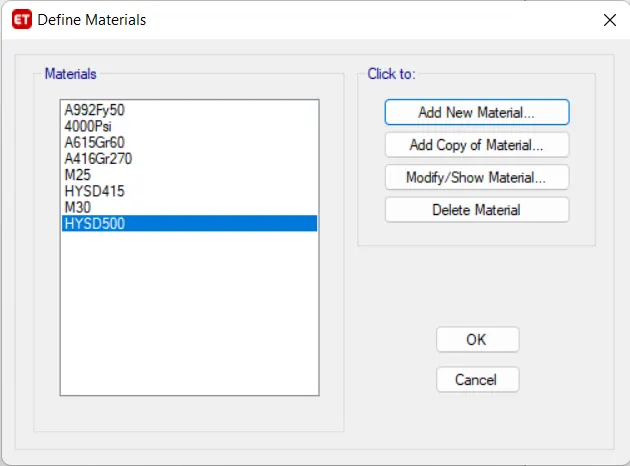
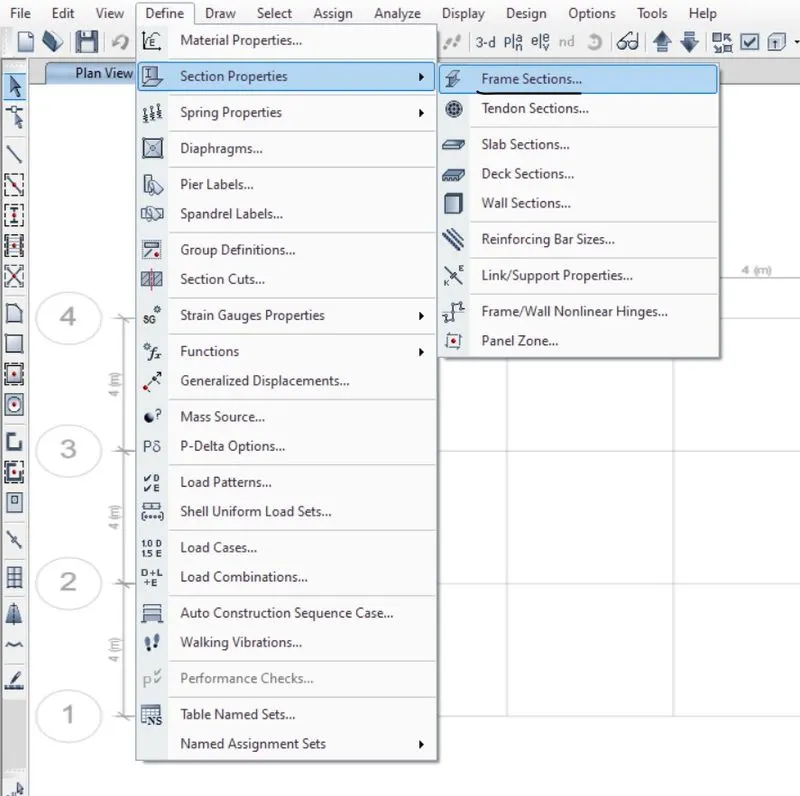
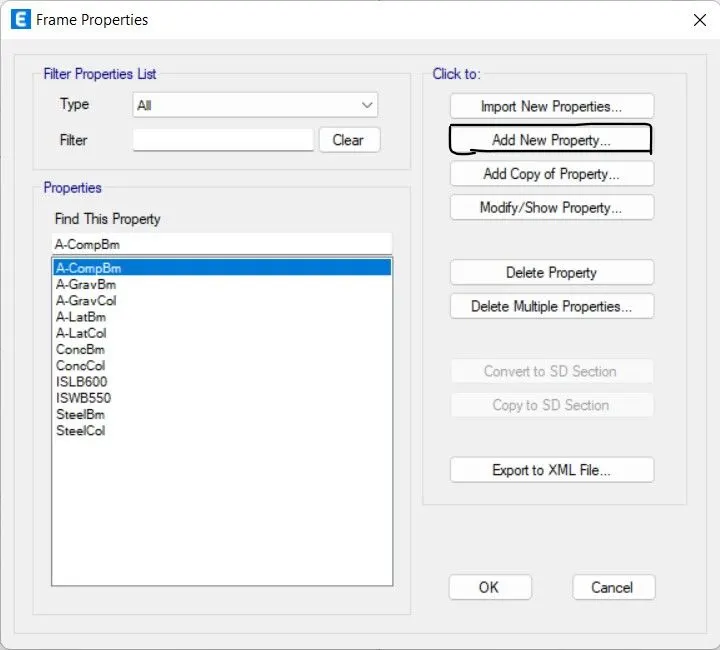
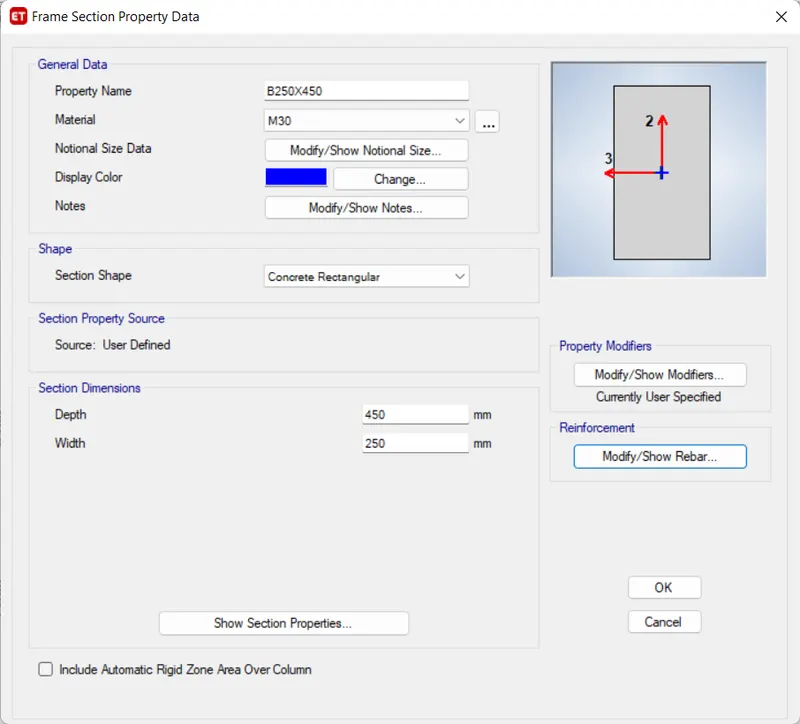
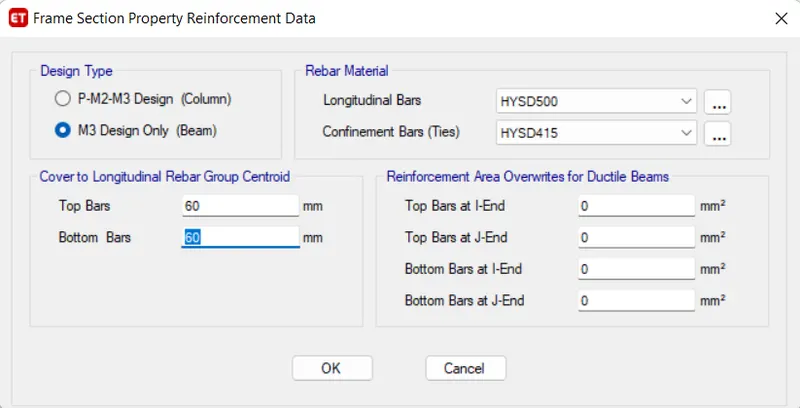
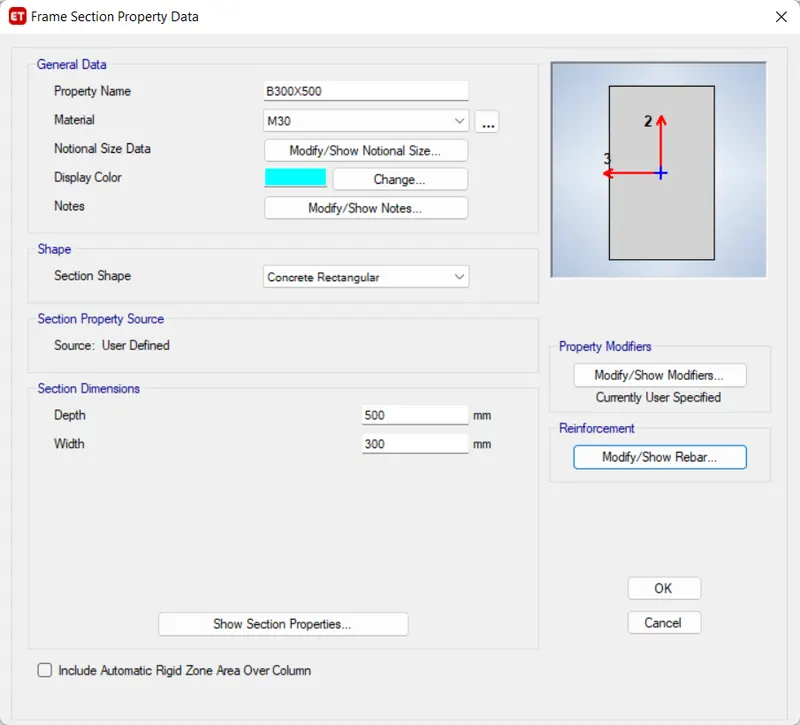
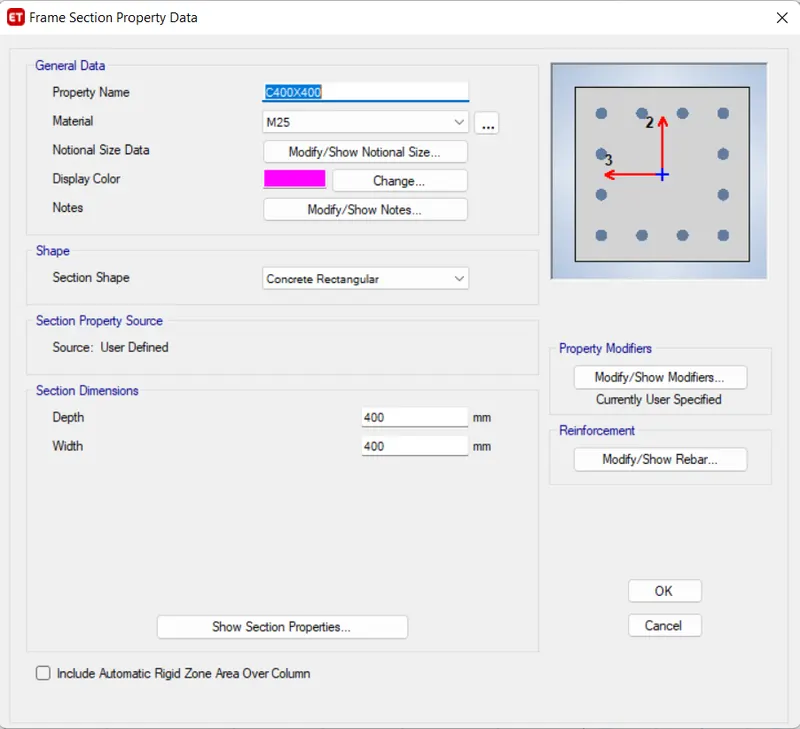
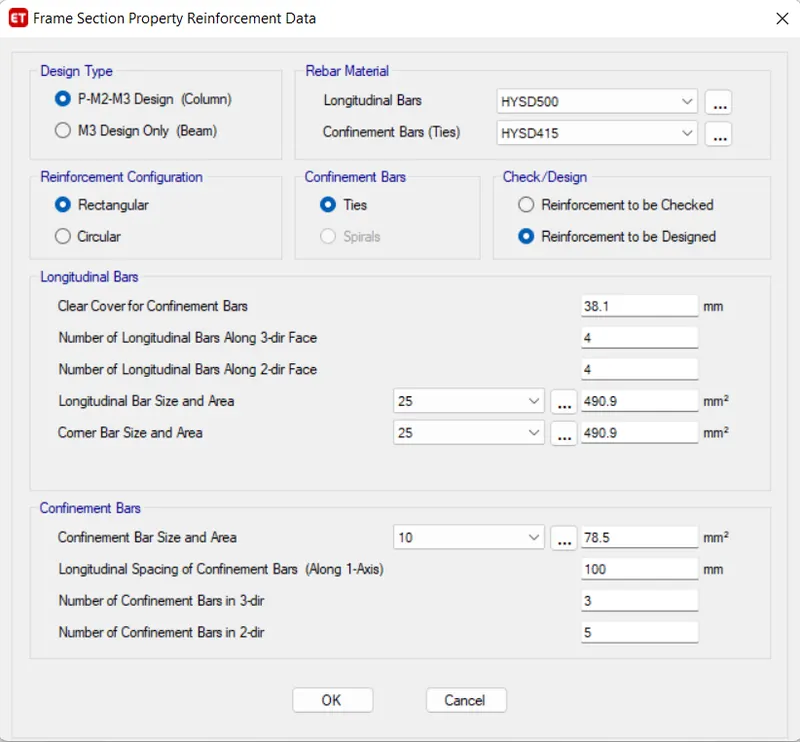
 .
.
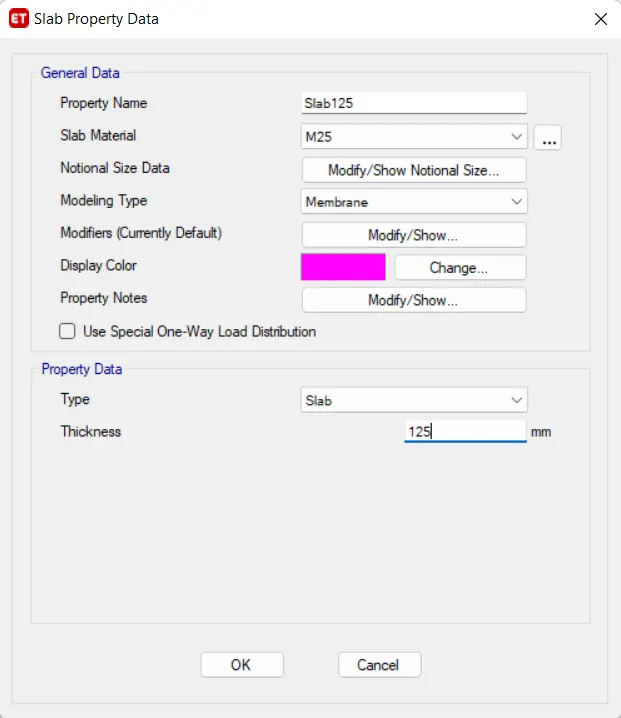
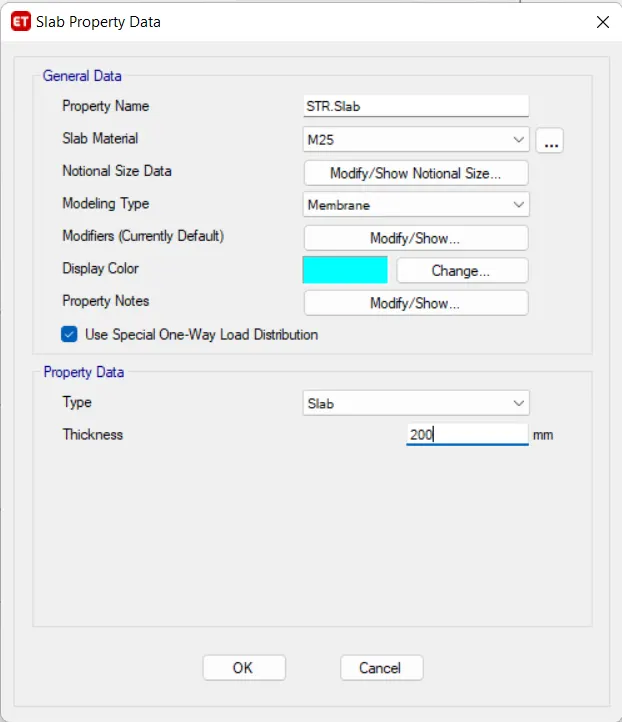
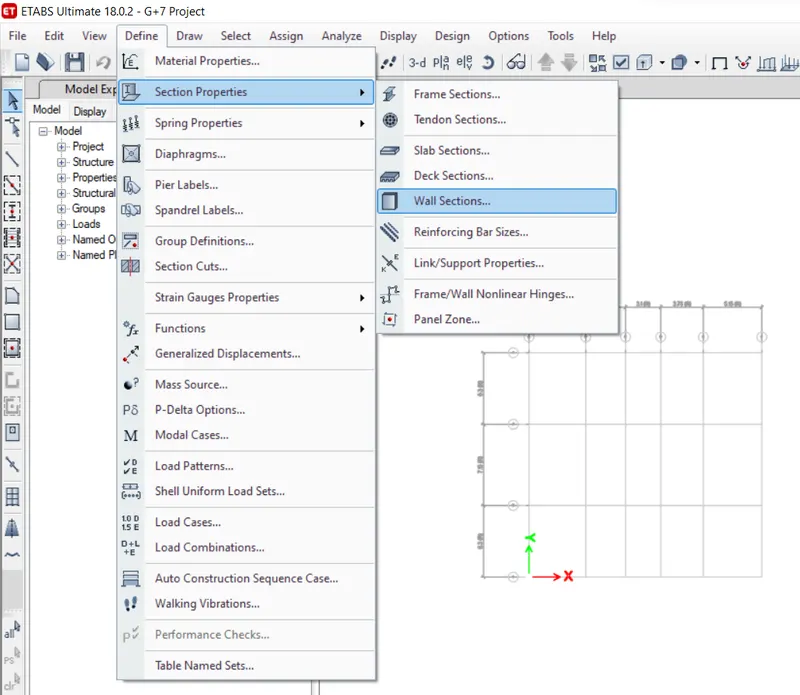
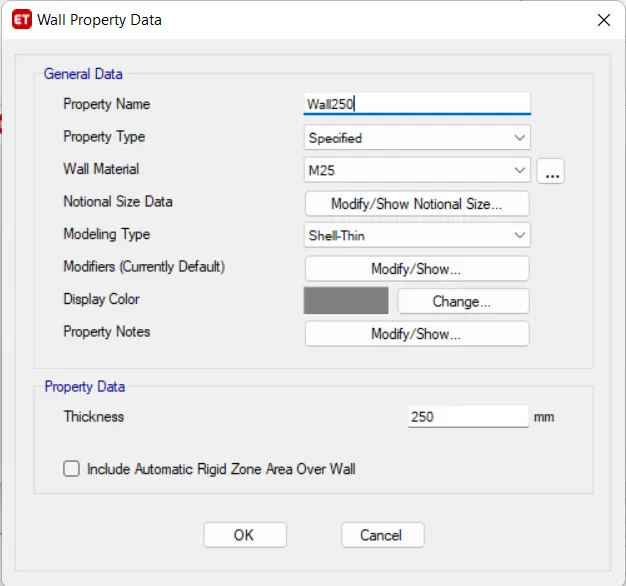
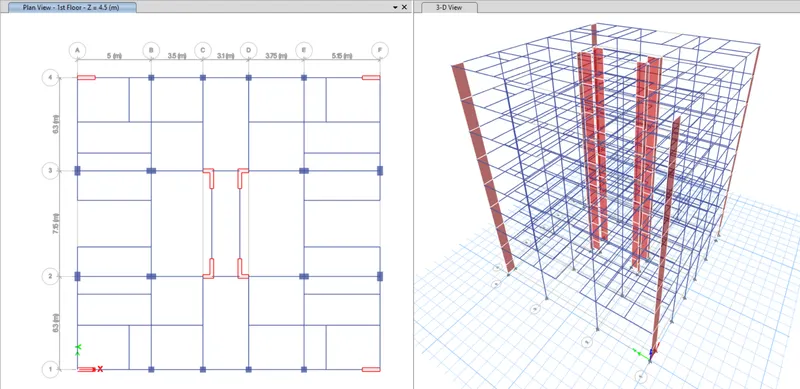
- Now we have to add Wall properties in wall property data.
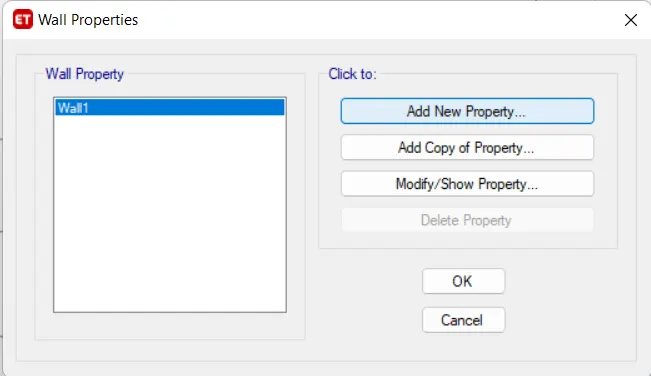
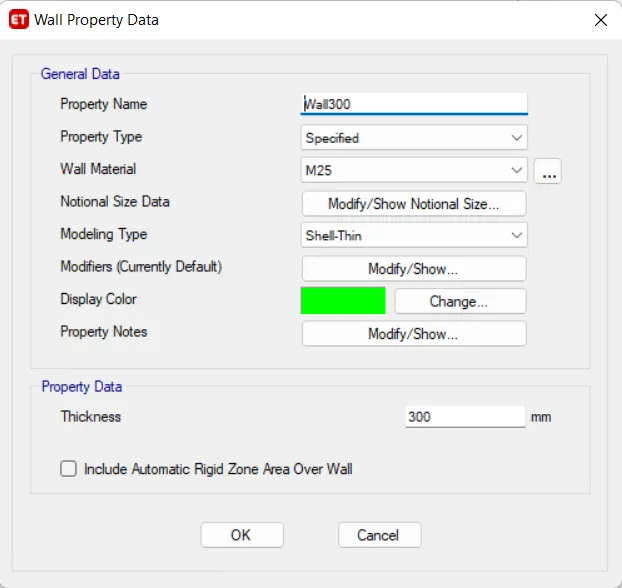
- Now add the wall data as thickess of the wall as 300 mm, Material- M25.
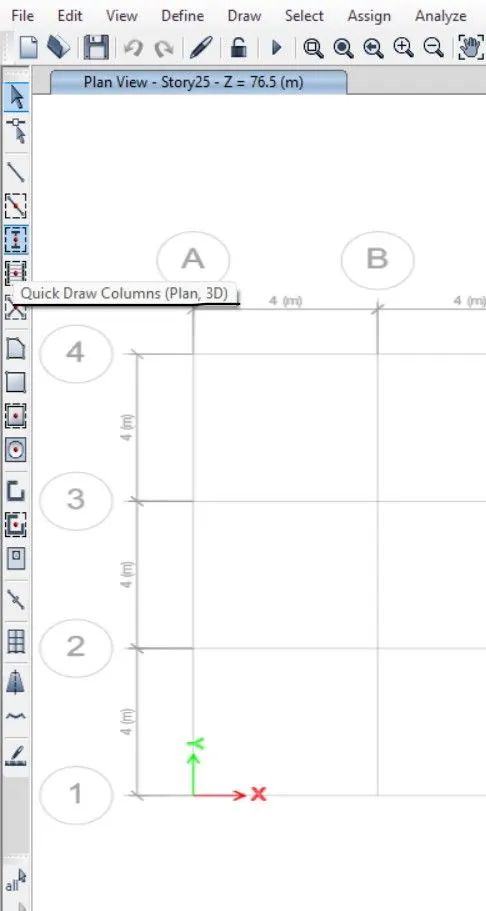
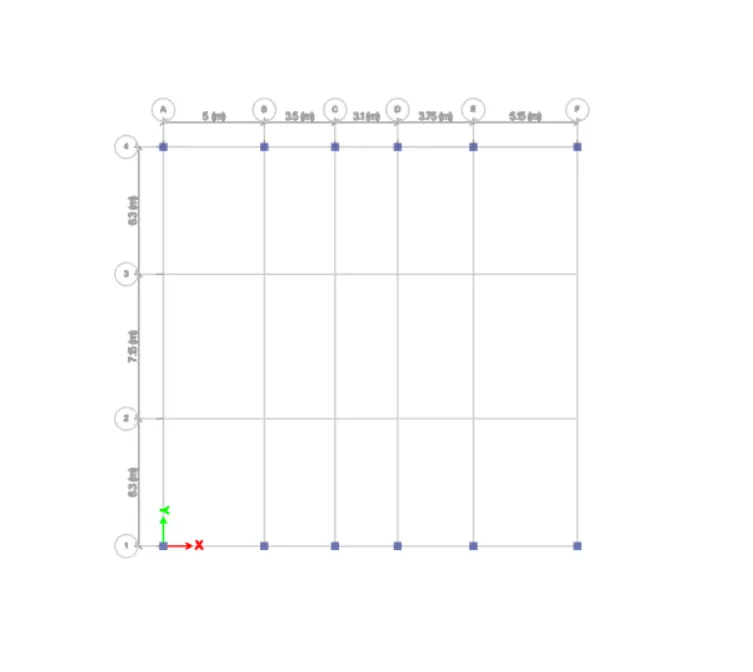
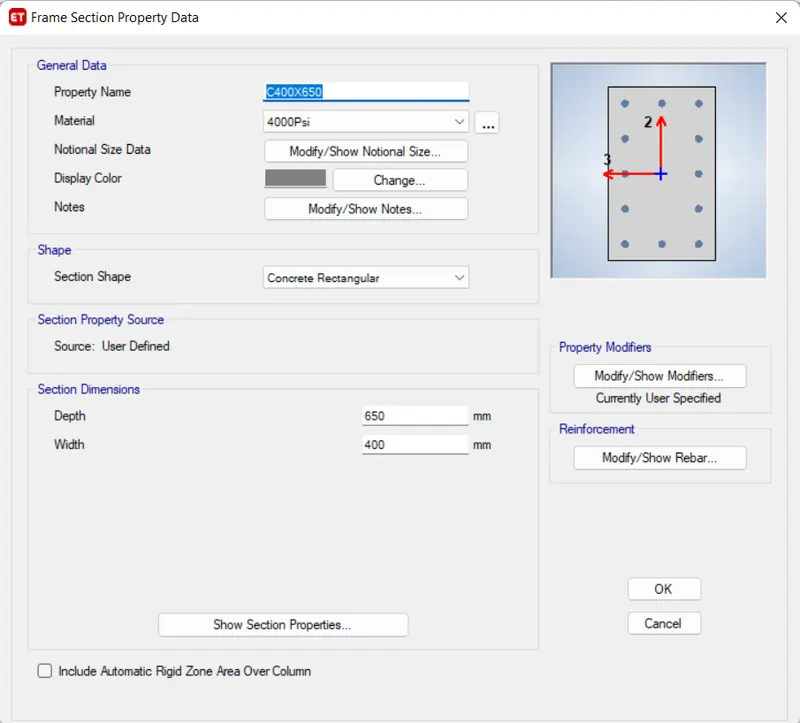
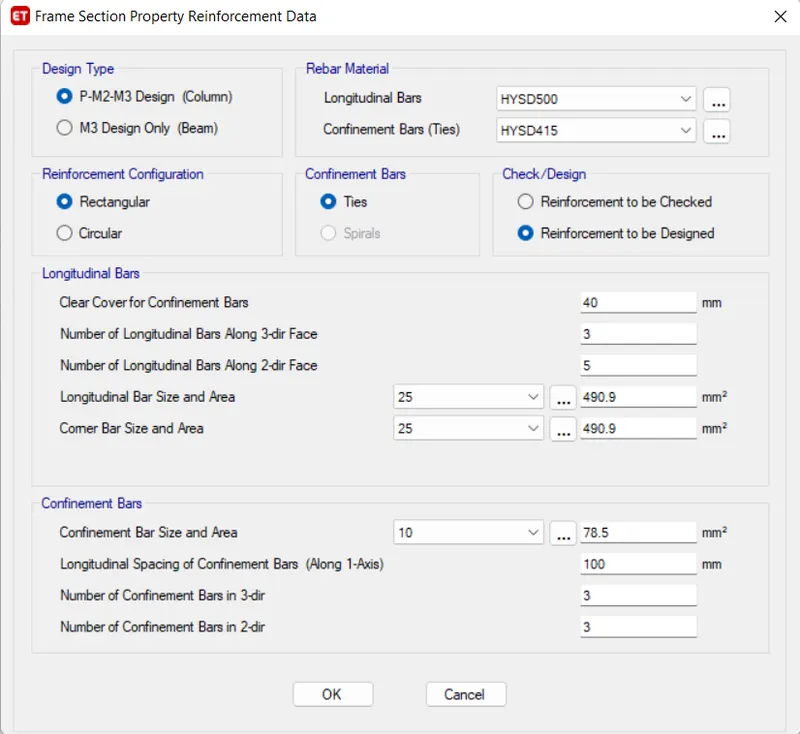
- Now draw columns of size 400X650 mm at the intersection of the horizontal and vertical grids and beams with quick draw Column keeping all the stories on.
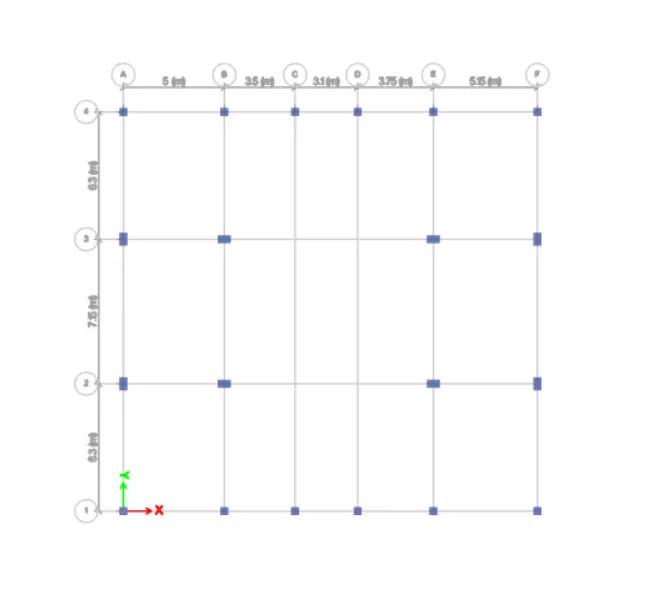
- Columns are Successfully added to the structure.
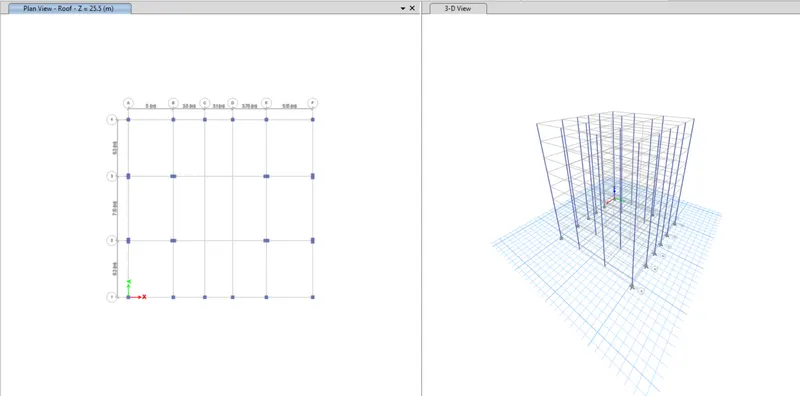
- Now Draw the Beams.
- Draw beams of size 250X450mm at the intersection of the horizontal and vertical grids and beams with quick draw beam keeping all the stories on.
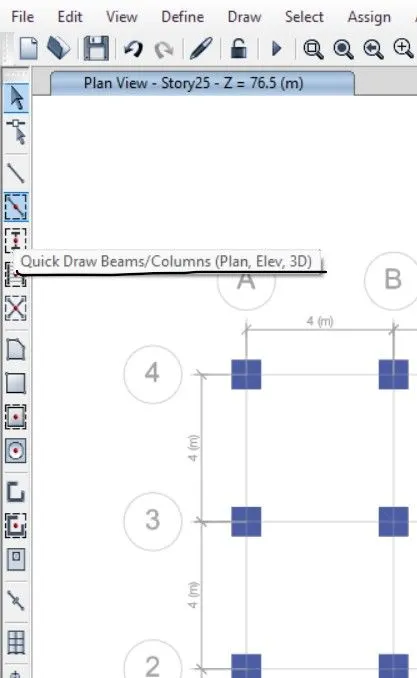
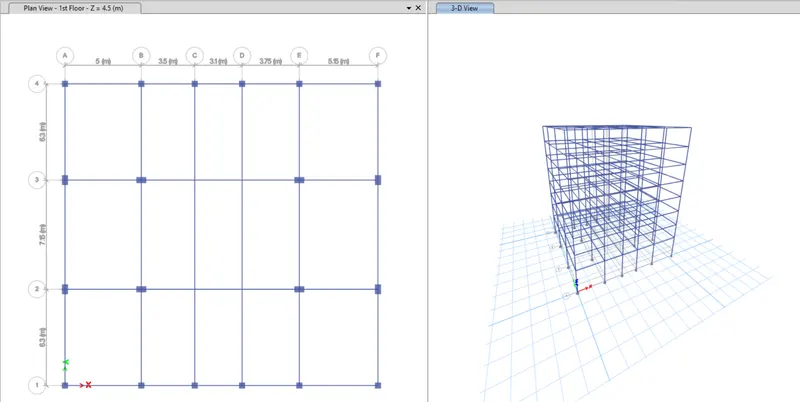
- Next we have to Draw secondary beams.
 g.
g.
 all the stories on.
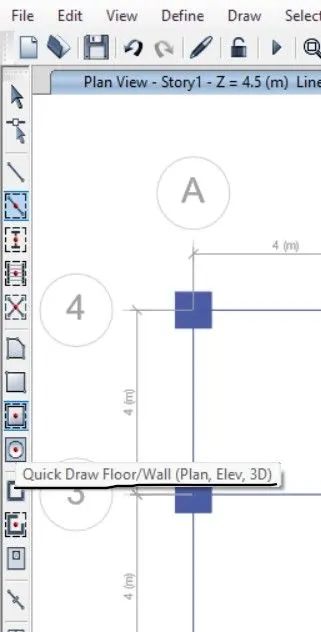
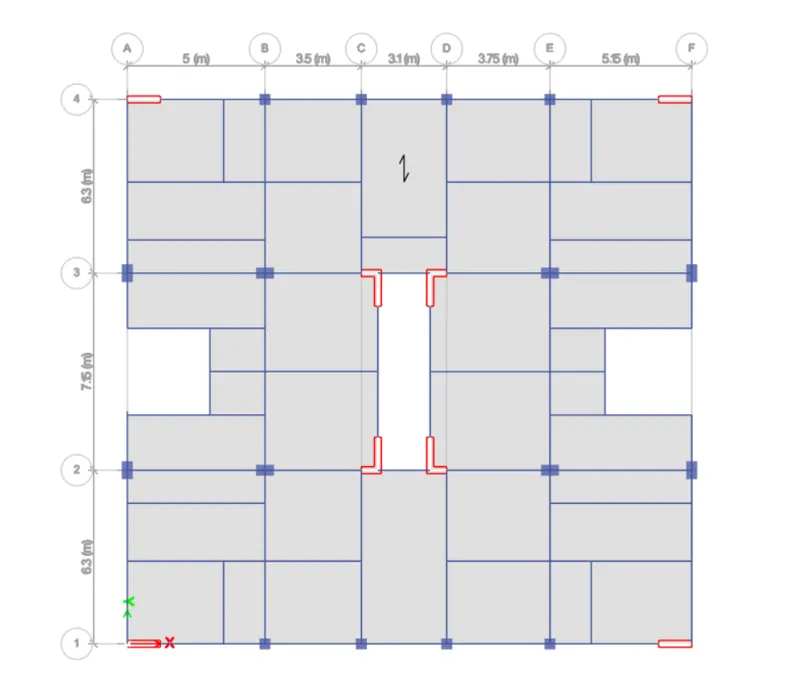 .
.
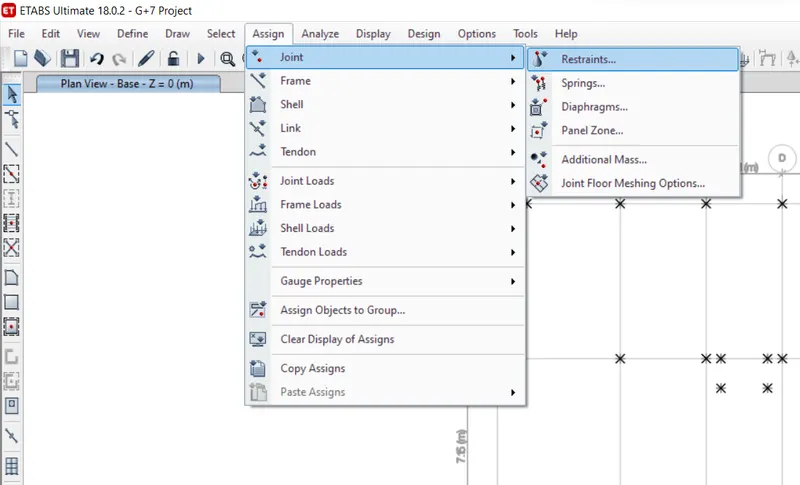
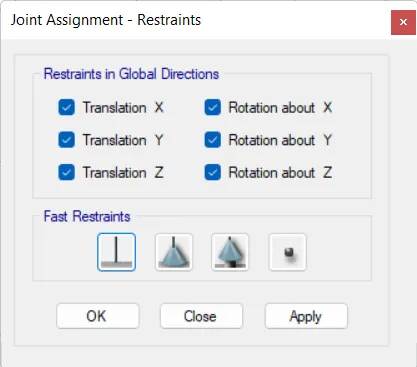
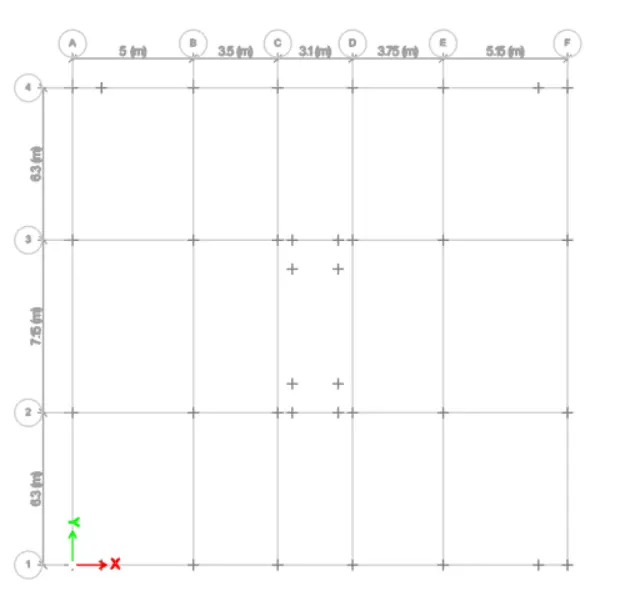
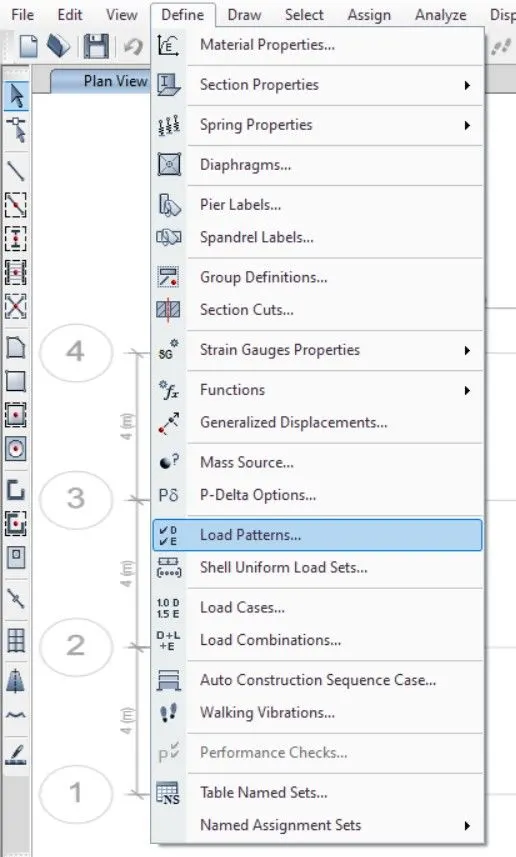
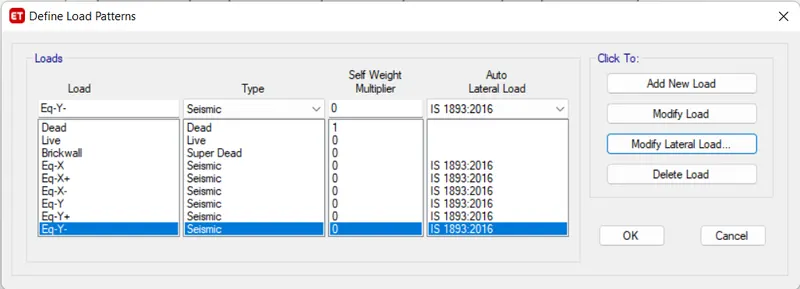
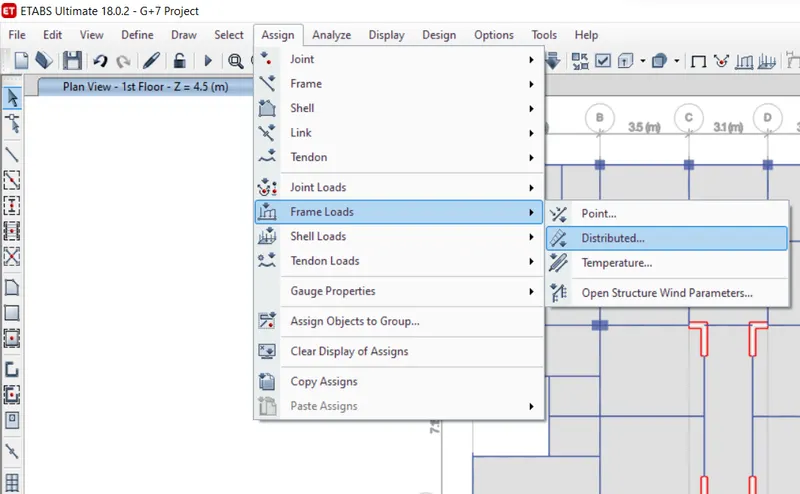
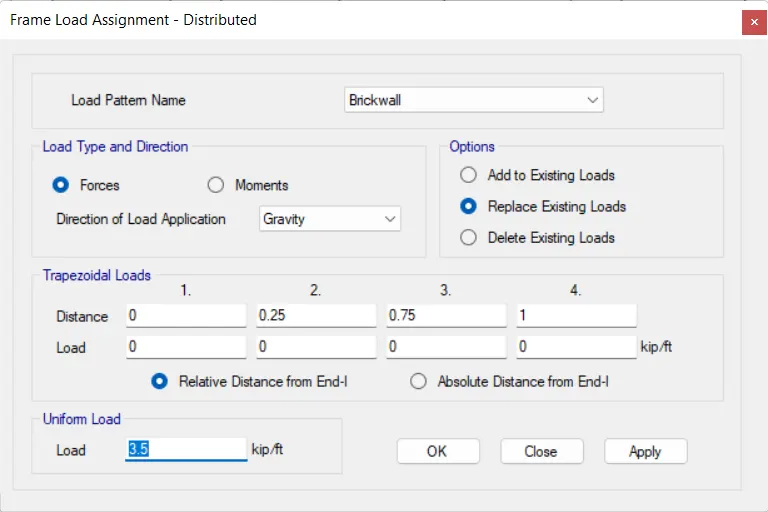
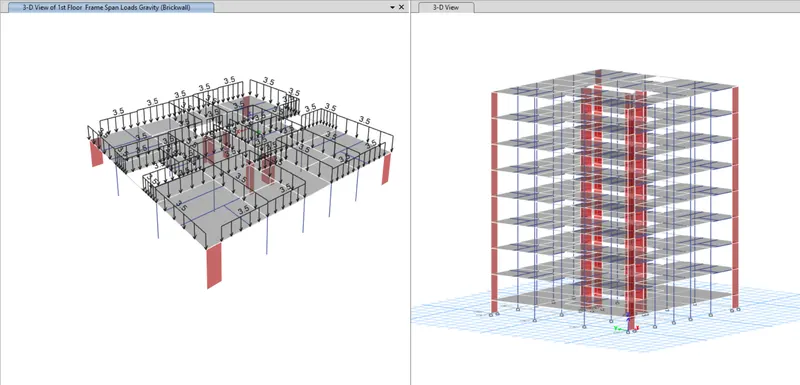
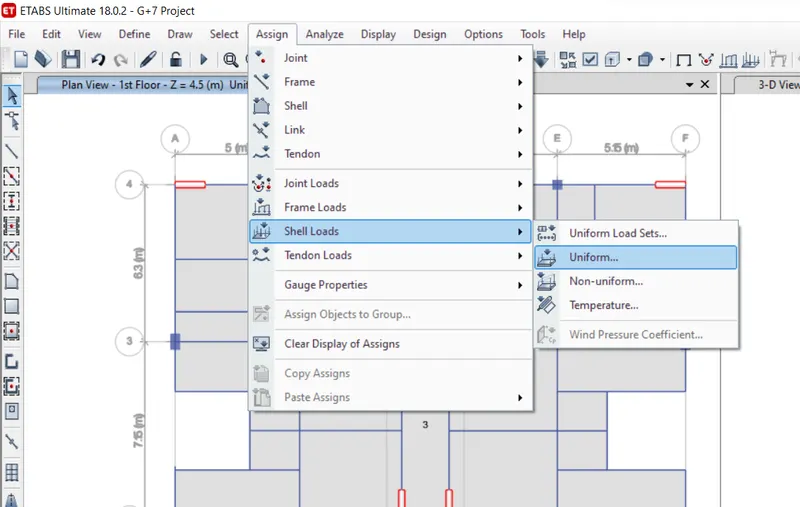
- Next we have to click on assign option and then select shell loads and select Uniform option.
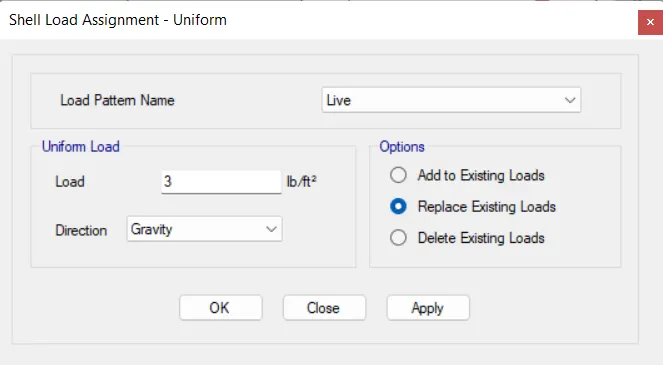
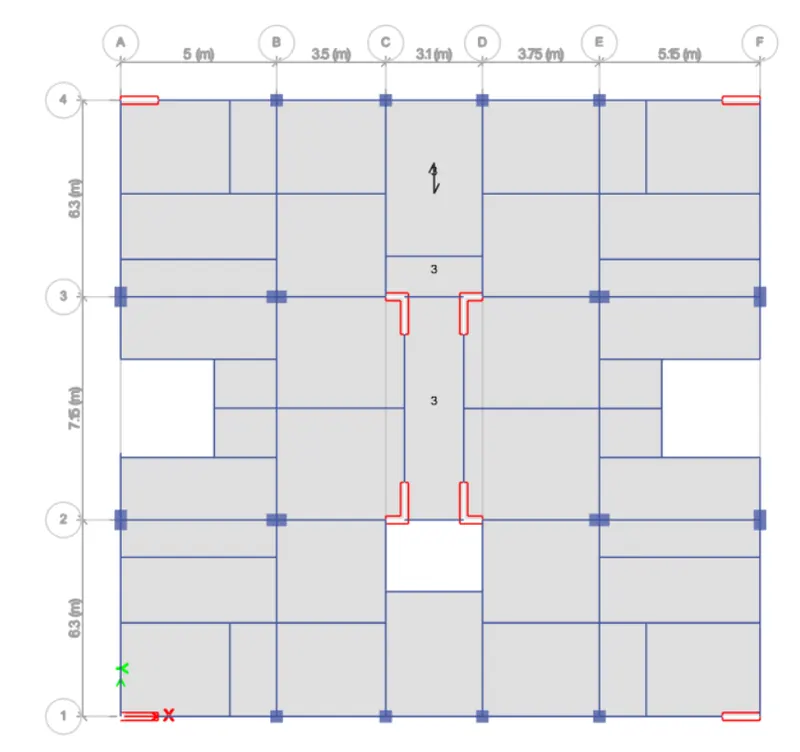
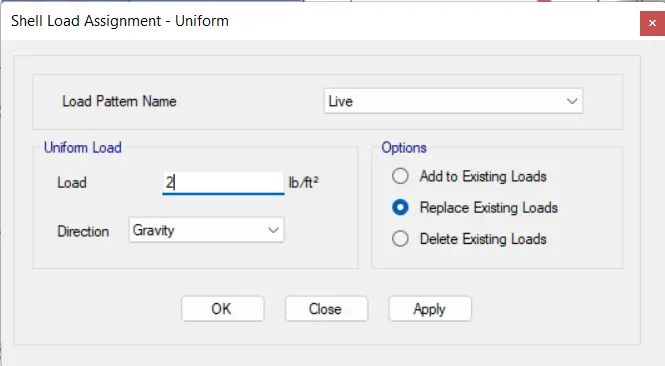
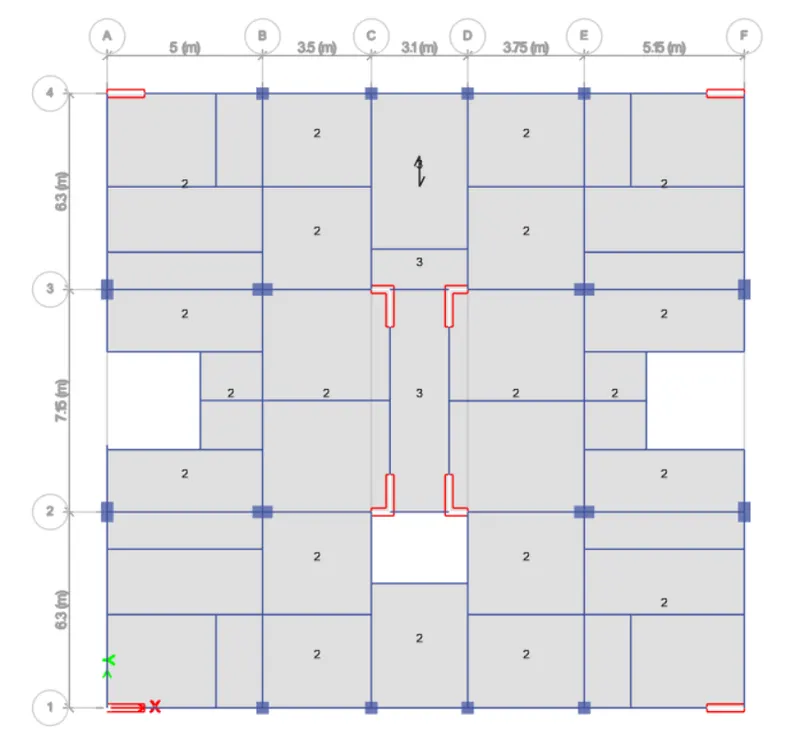
- Next we add live load reduction factor from the design option.
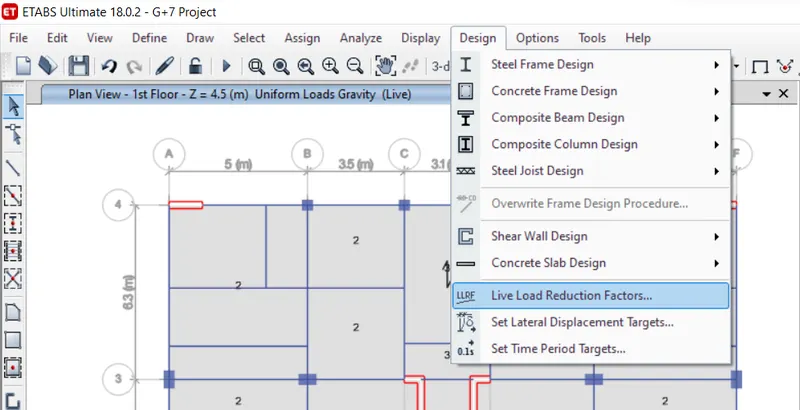
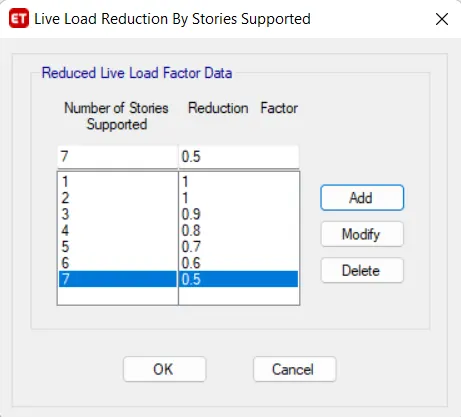
- Now add the reduction factor as decrease of 10%from 1st to 7th floor.
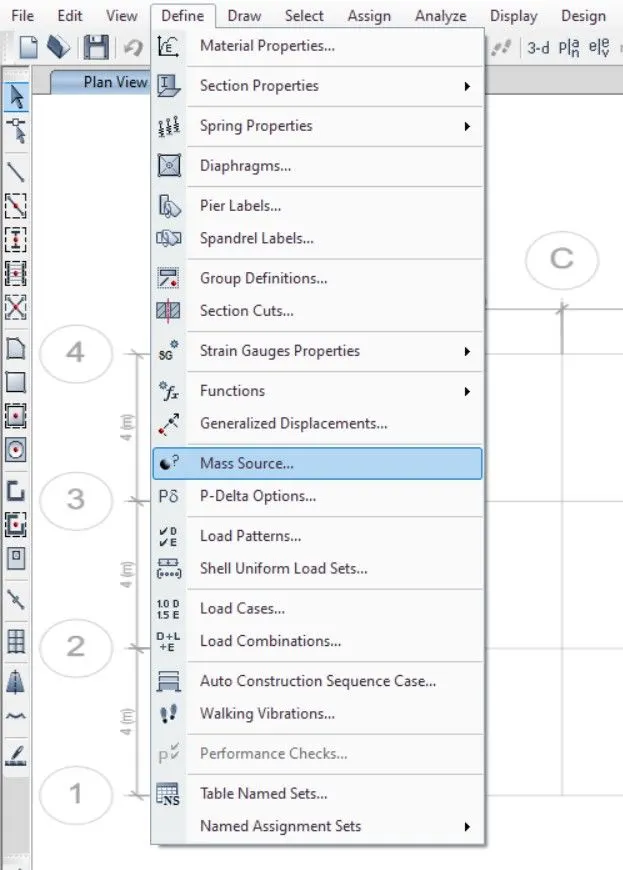
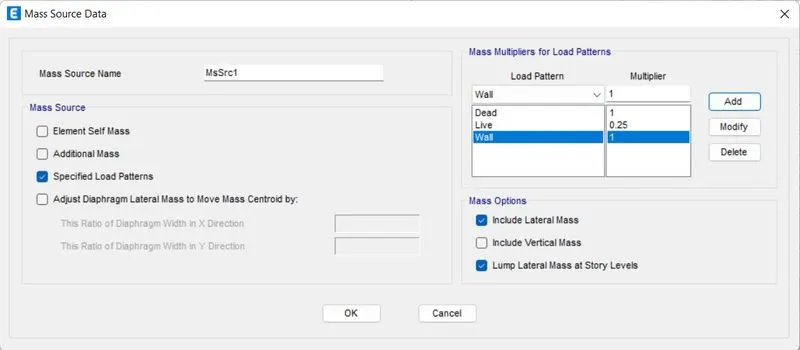
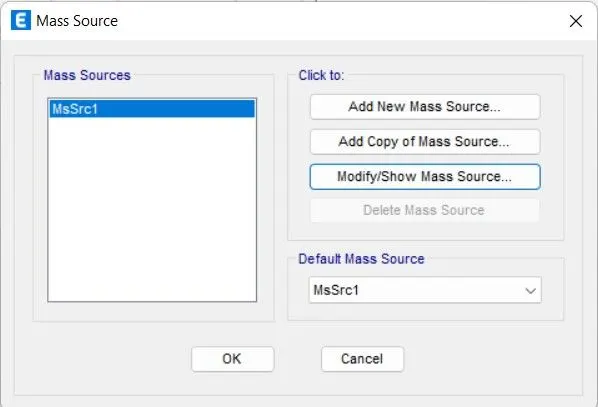
- Now go to Load cases in define Tab.
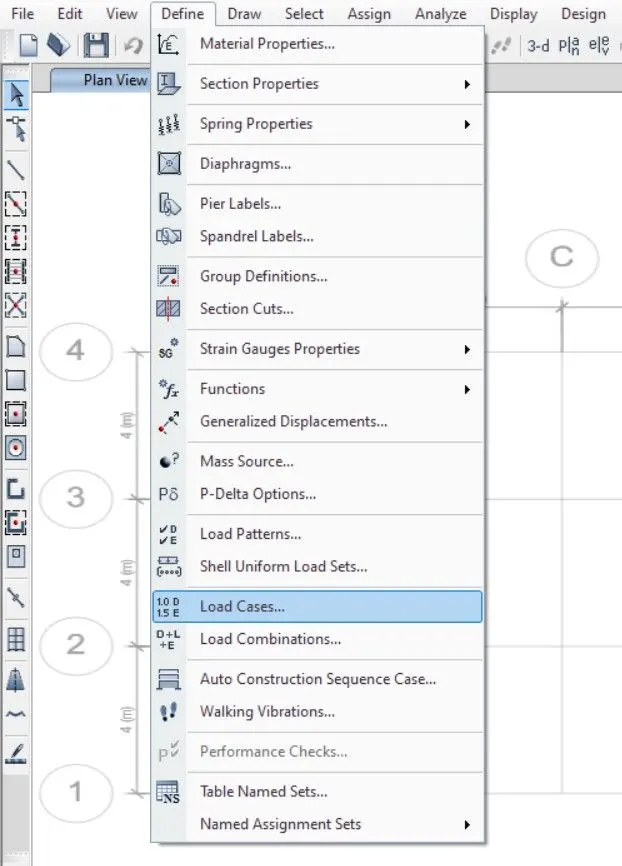
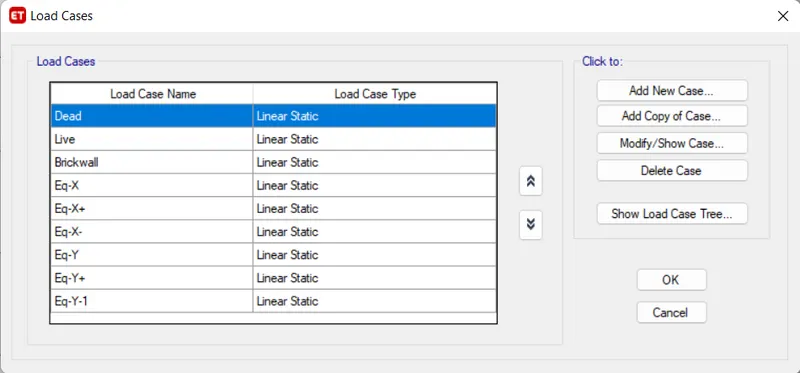
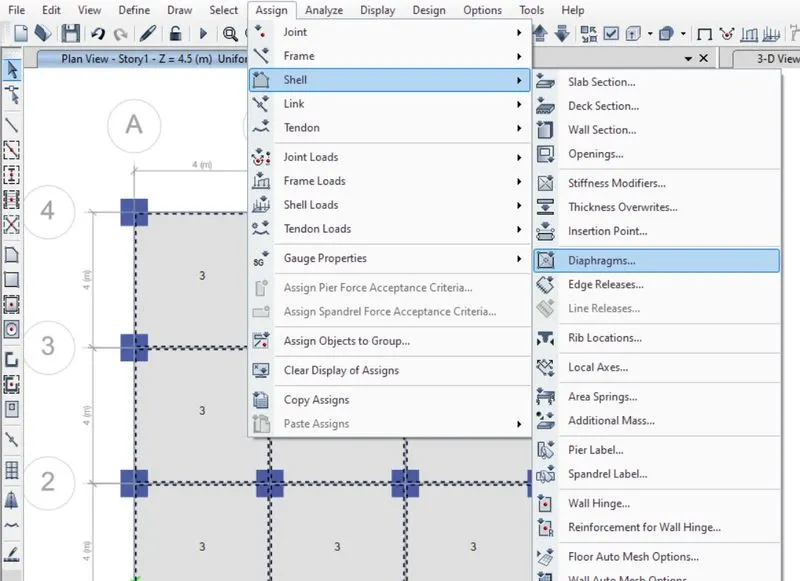
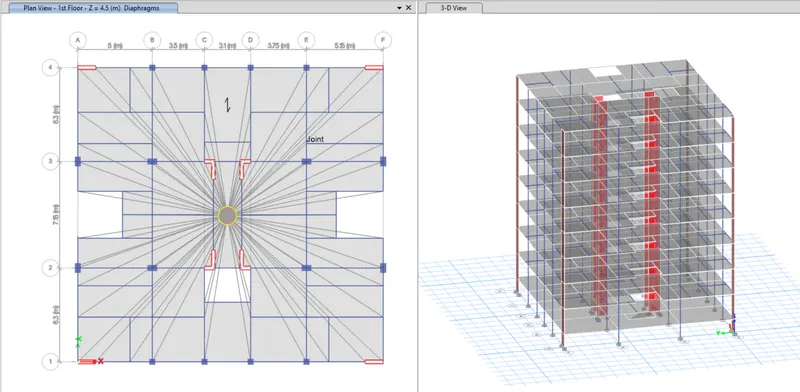
- Now create the Diaphragm by going to the assign tab then shell and select diaphragm.
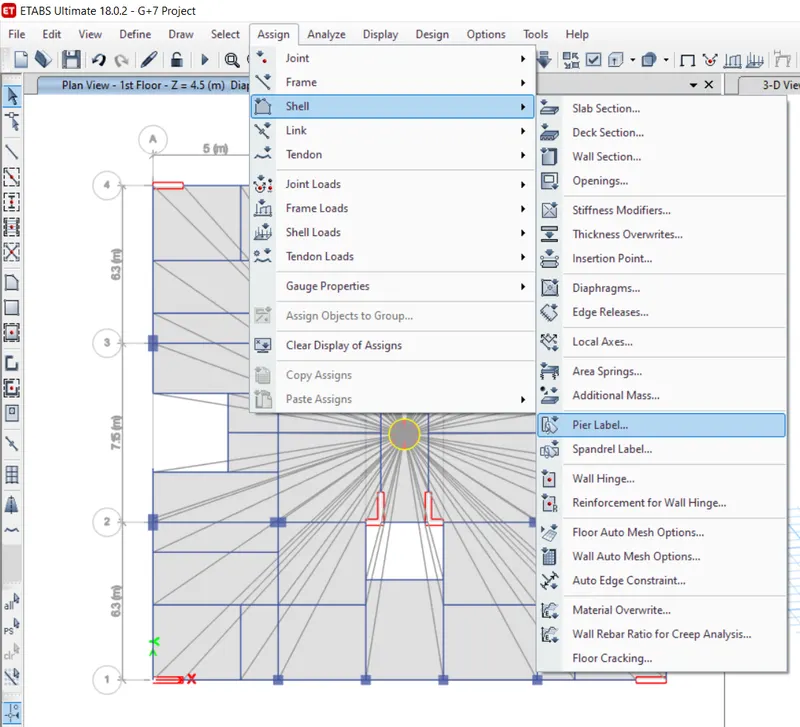
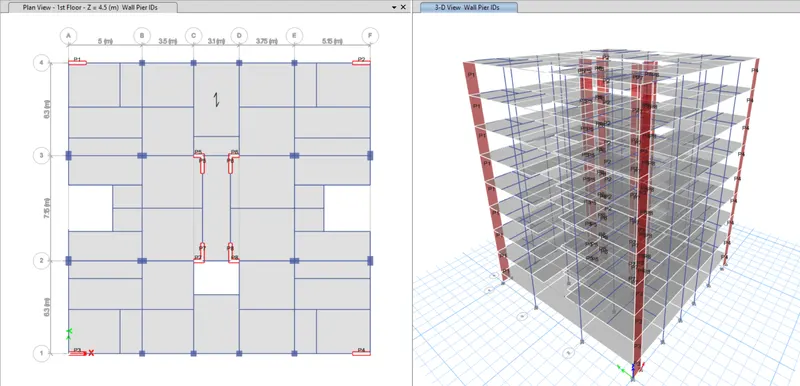
- Next we have to select the pier lable from shell option.
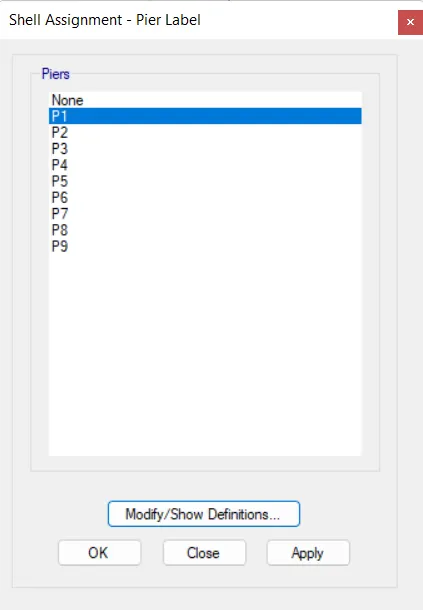
- WE have to assign the names for the shear wall.
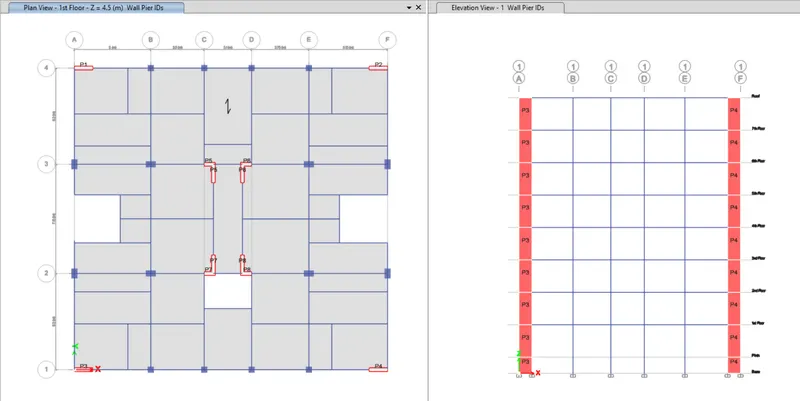
- Now go to Load combinations in define Tab.
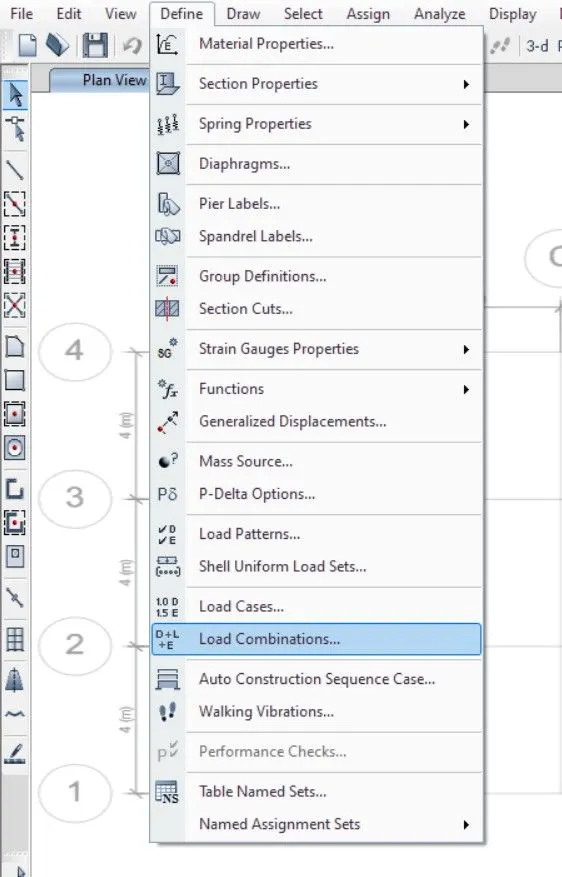
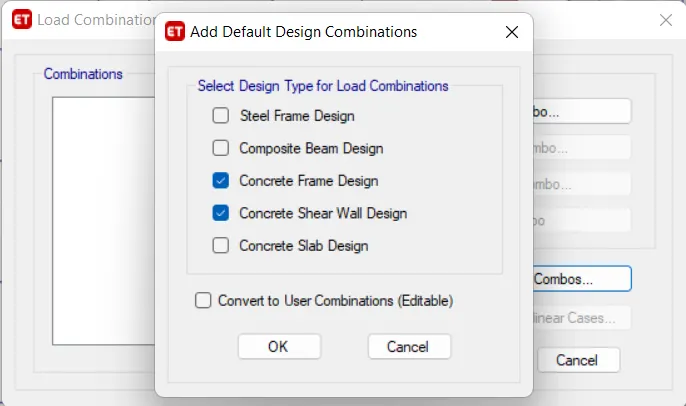
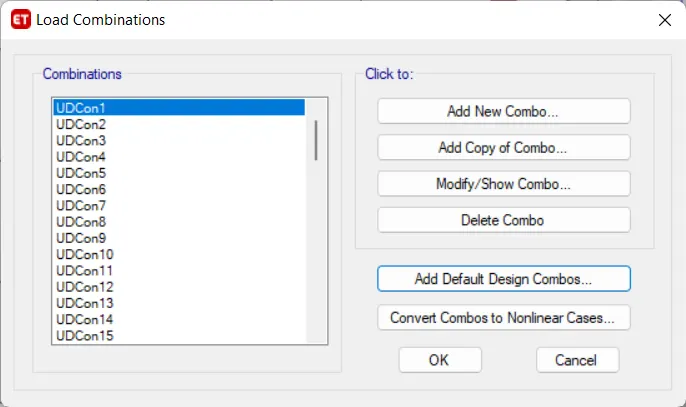
- Next we add model cases from define option.
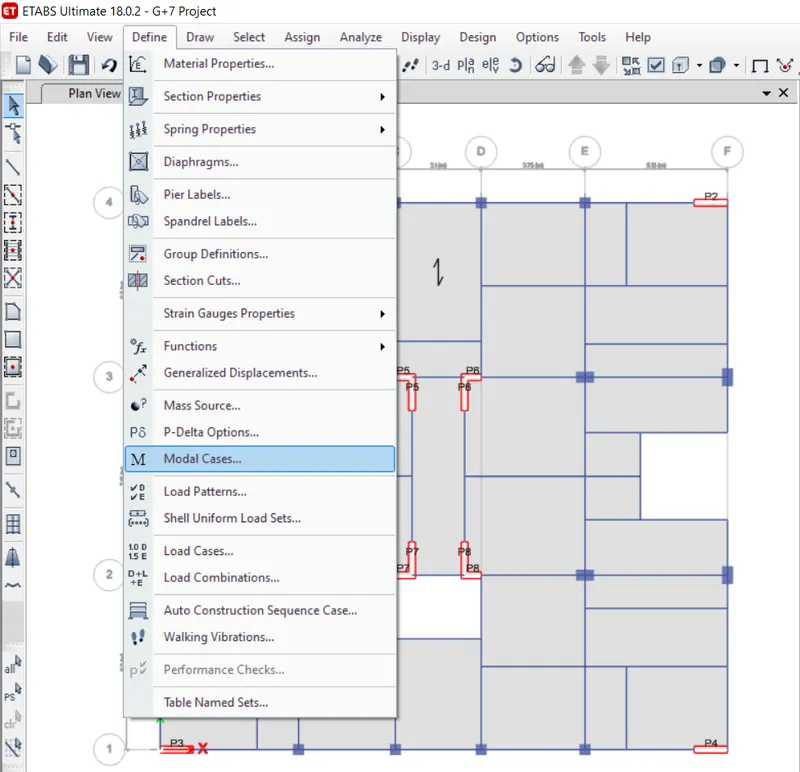
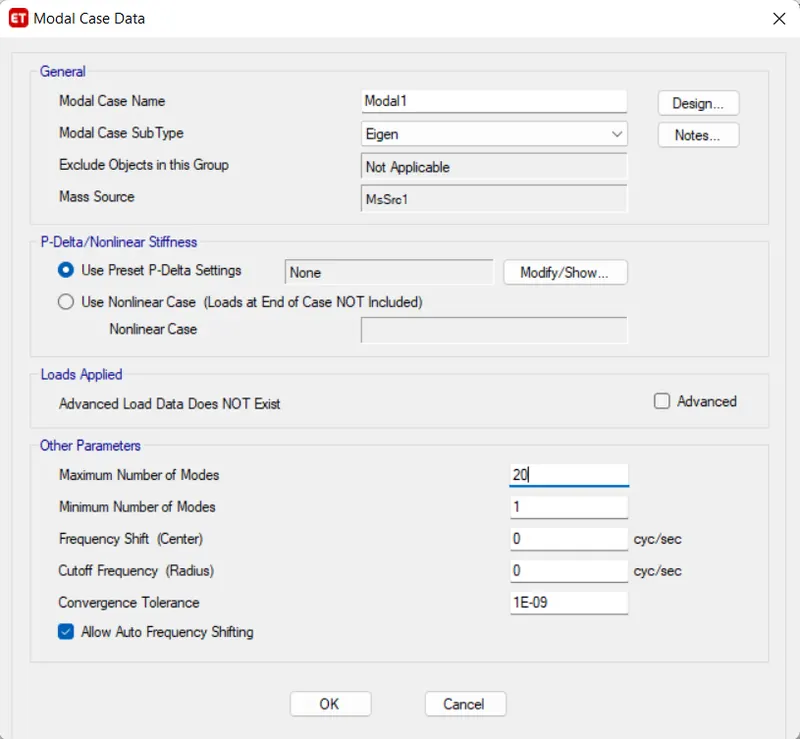
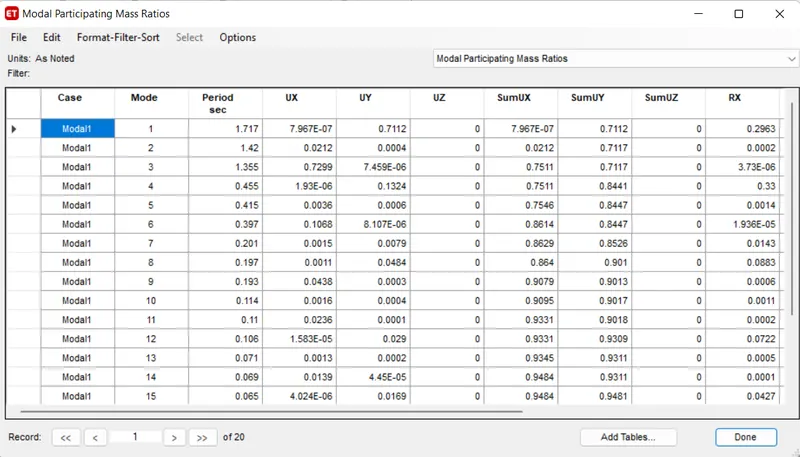
- Give odeal case name as Model1 and we give the maximun number of modes as 20.
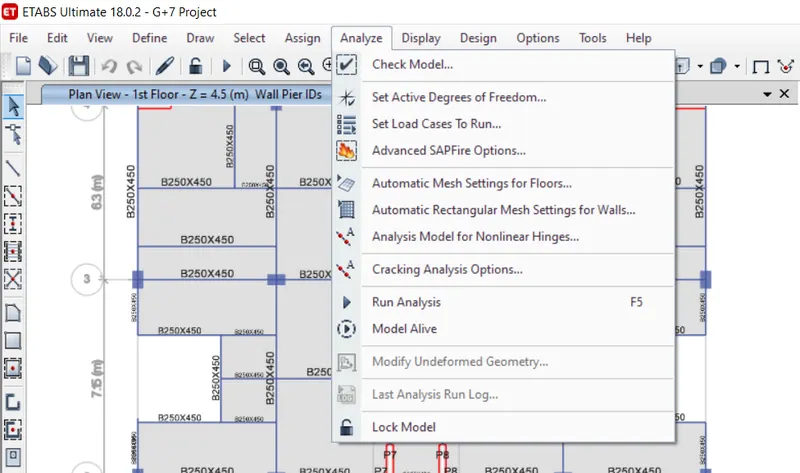
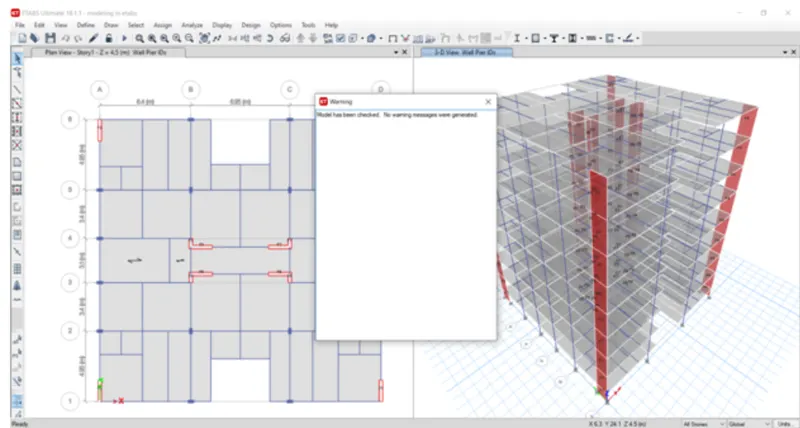
- After the model is checked, it will show us No warning.
- Now select the response spectrum from Functions option in define Tab.
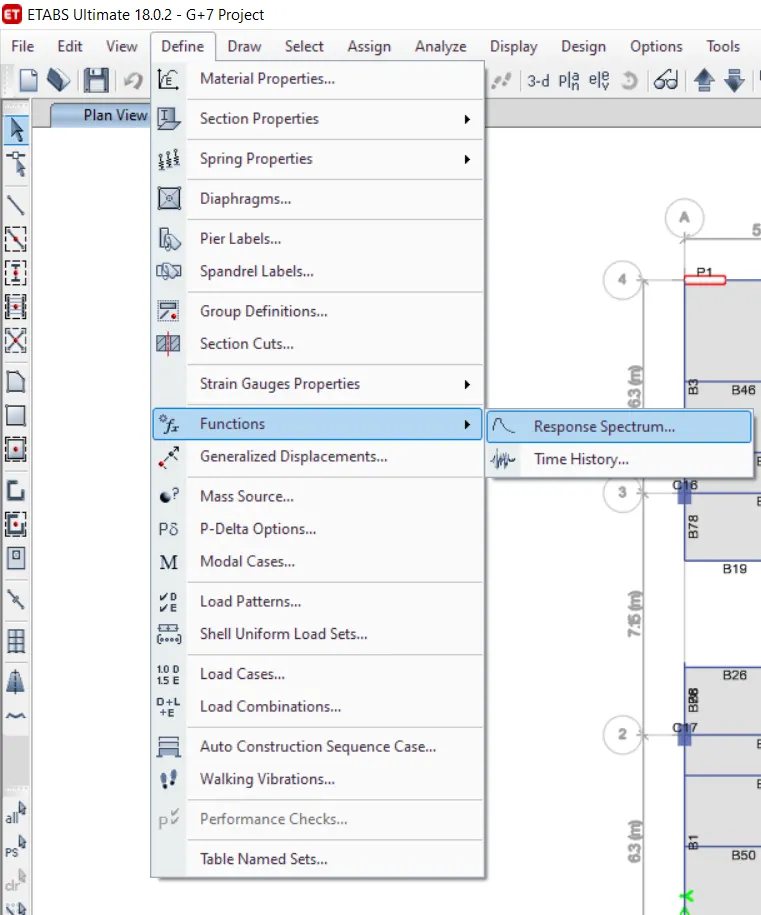
- We choose IS 1893:2016 from choose function Type and click on Modify/Show spectrum option.
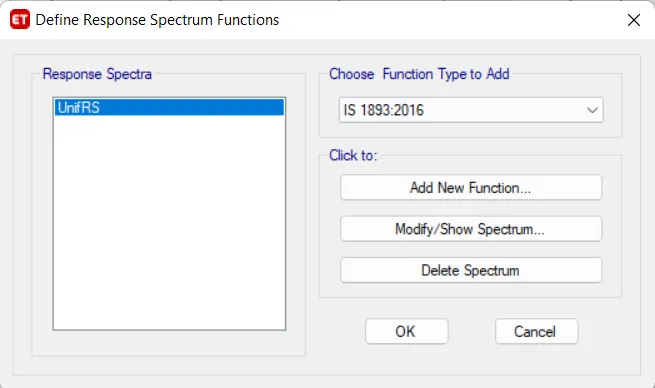
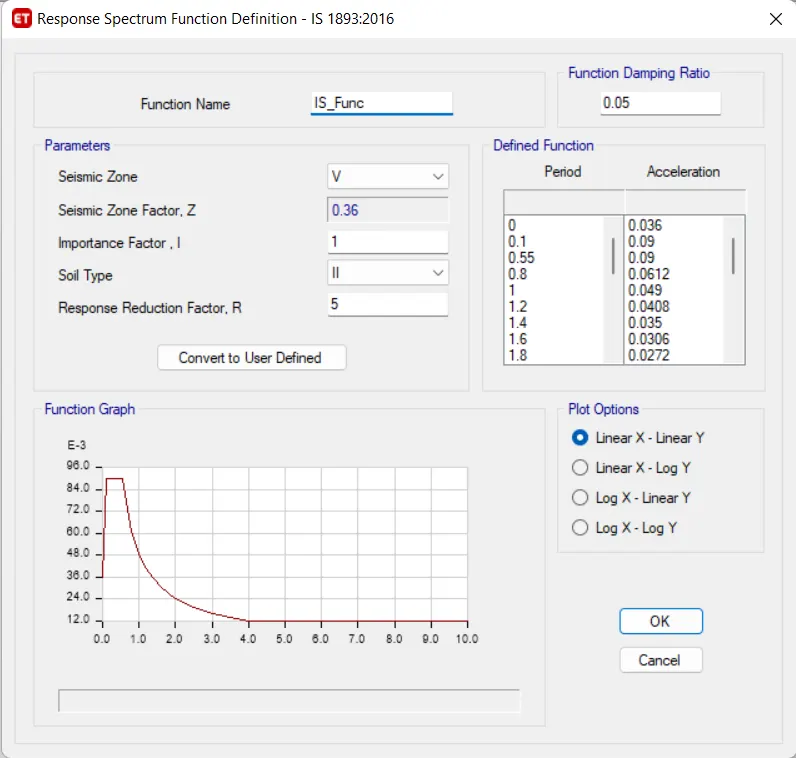
- Now go to Load cases in define Tab.
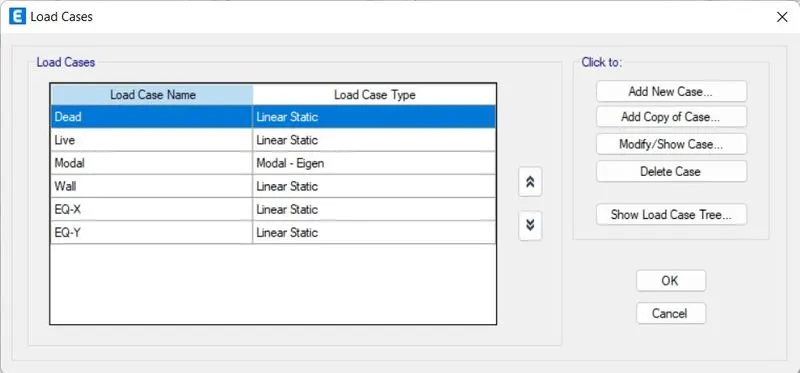
- Add new case.
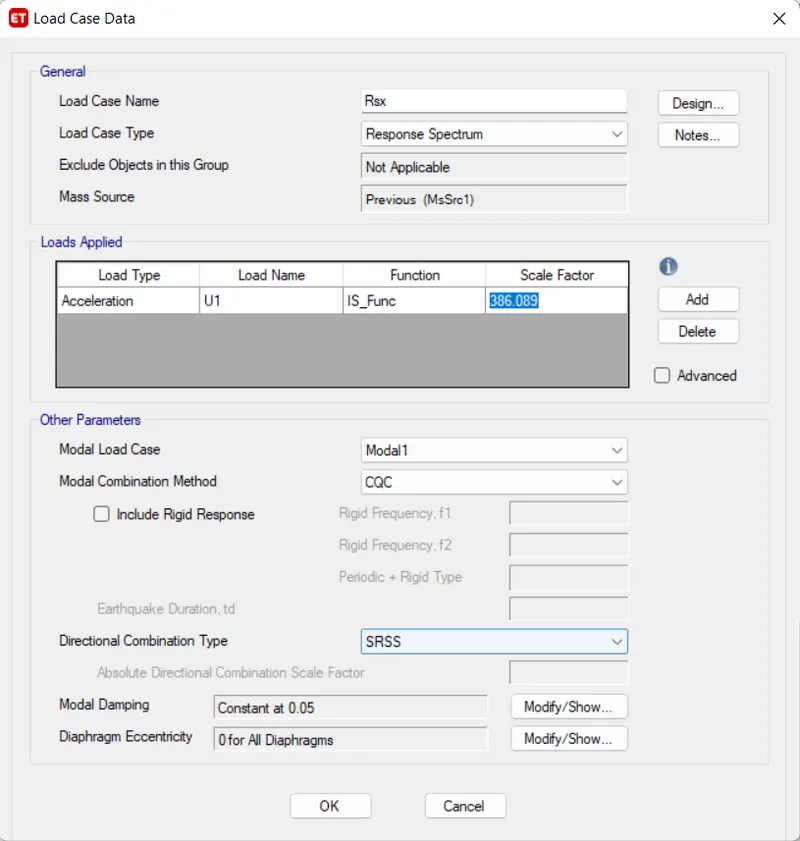
- Analyse the model using analyze option then click on the check model the modelled structure is verified without errors and warnings.

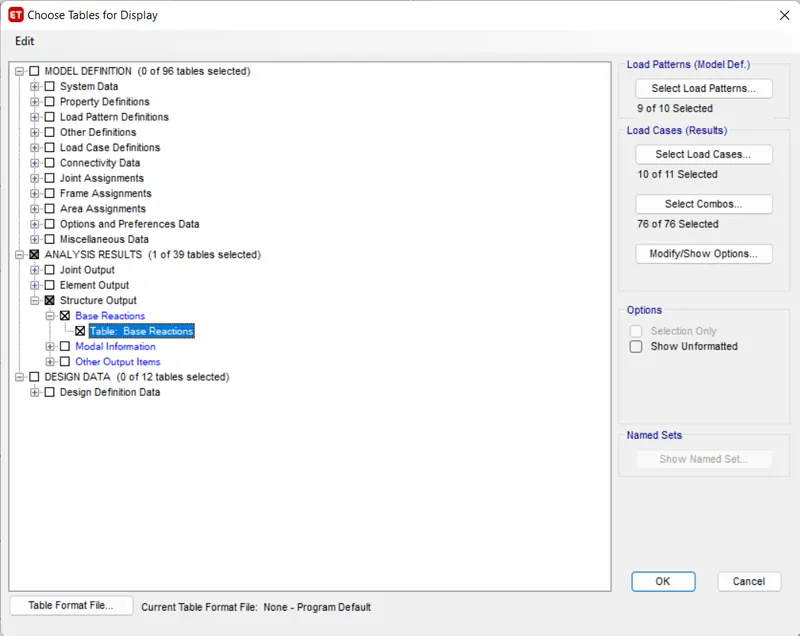
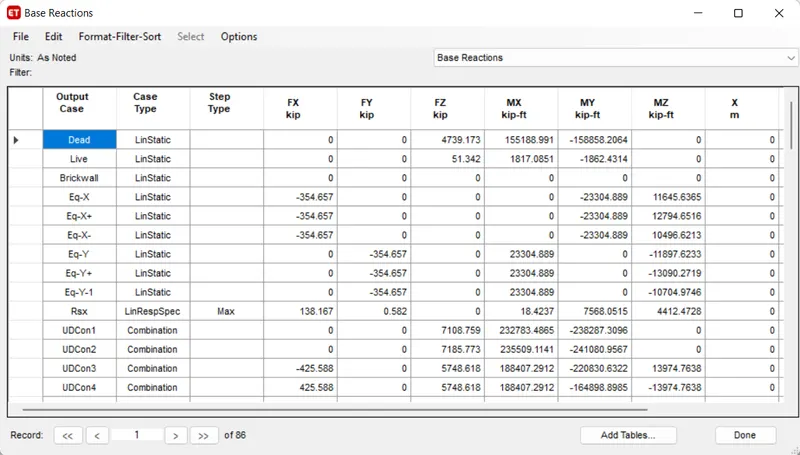
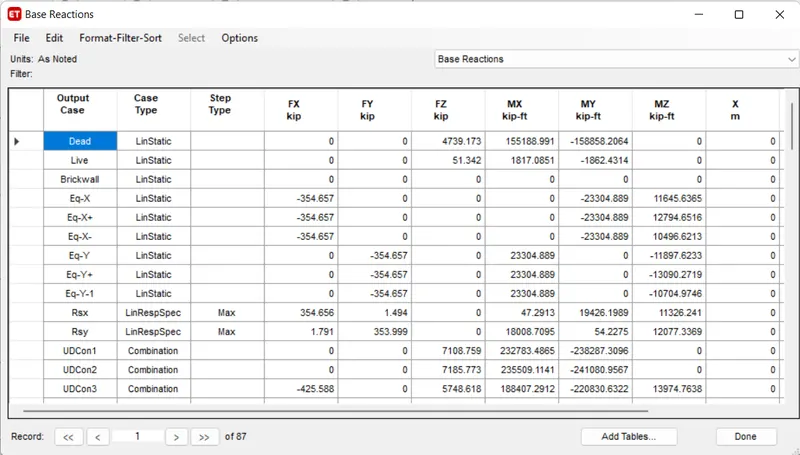
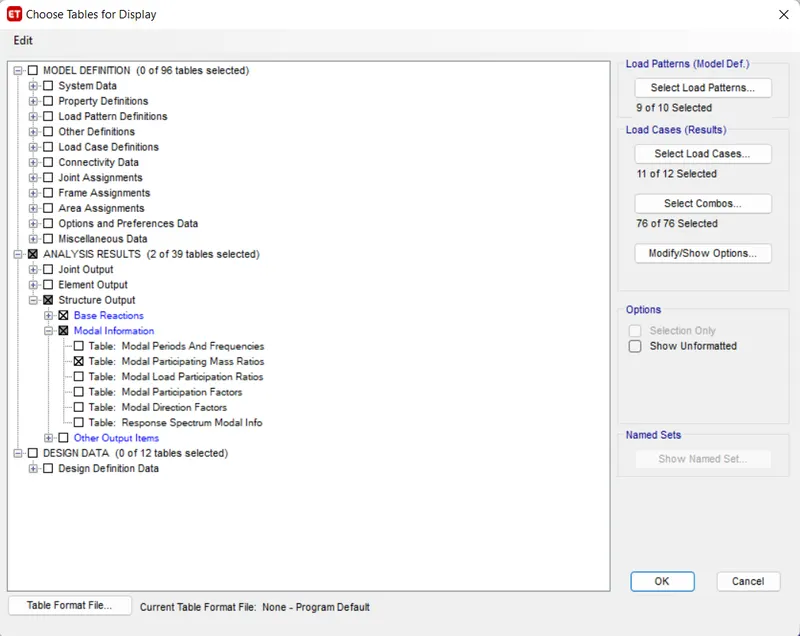
- We have to check EQ should be close to the RS, We should calculate the

- Now substituting the value from the table ,
At X- direction -> ( 354.657 / 138.167) X 386.089
-> 991.04
At Y- direction -> ( 354.657 / 115.05) X 386.089
-> 1187.96
- Now we put above value as scale factor for Response Spectrum at X and Y direction.
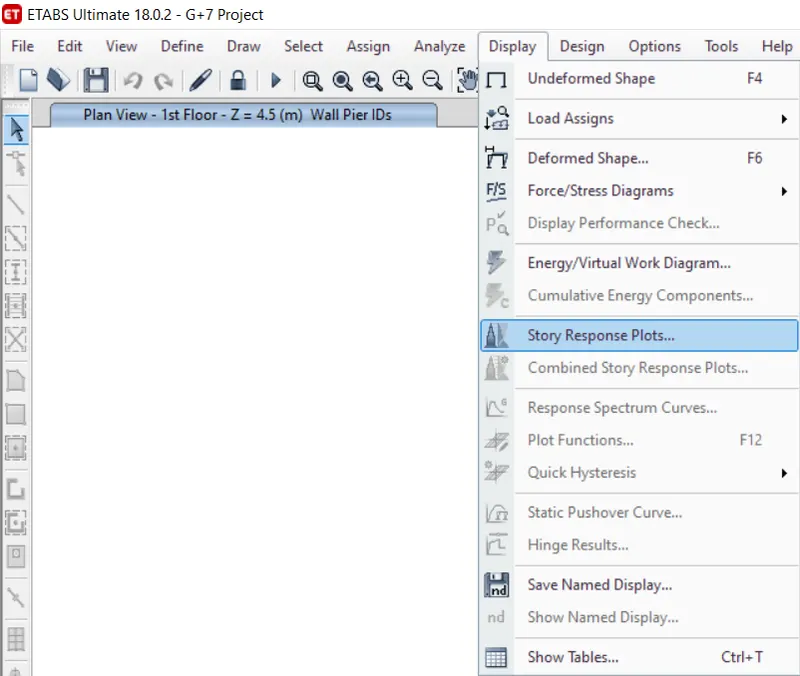
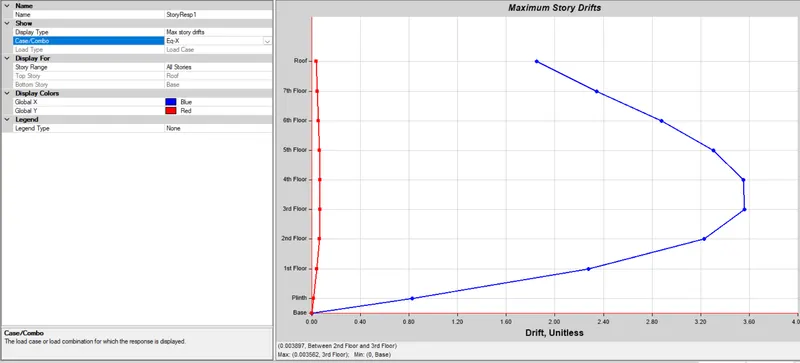
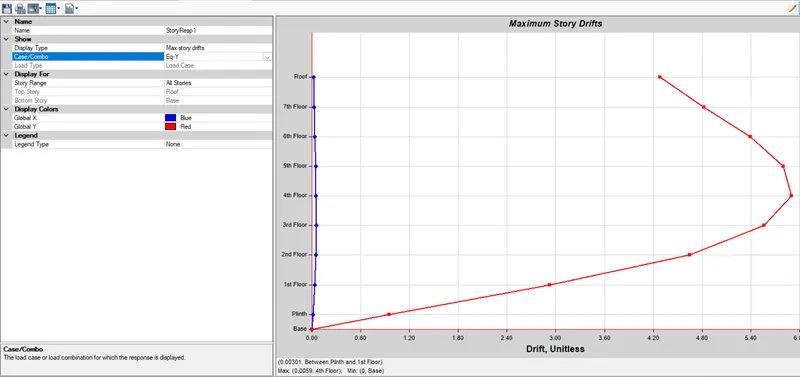
- Story Response for maximum Story Drifts for x and Y direction
X- Direction :-
Y- Direction :-
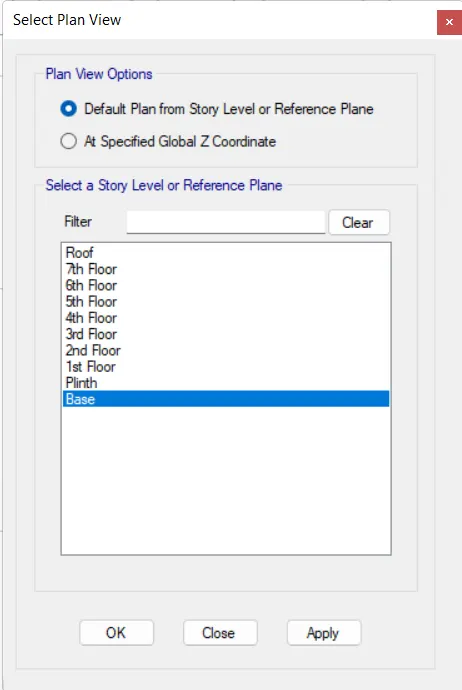
- Next we open the Base floor in Plan view.
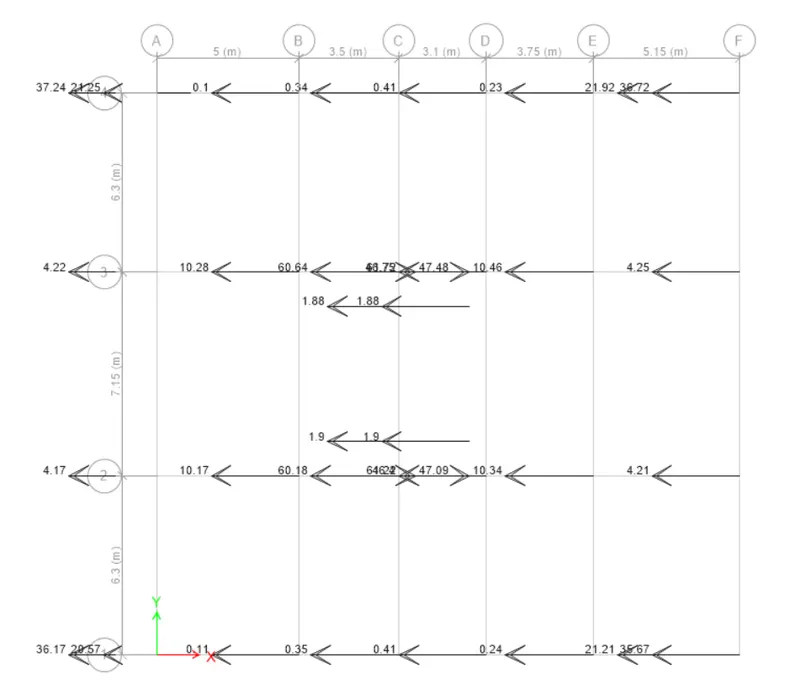
- We have to open Reaction tab, we select the earthquake load towards in X-direction in load case.
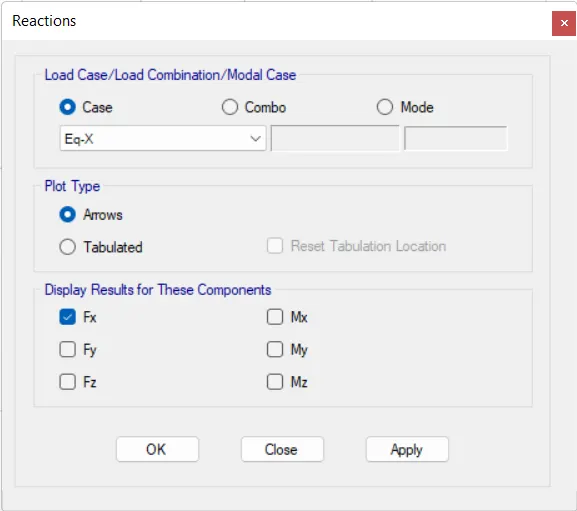
- When we divide base shear taken up by shear wall divided by total base shear of Building will get % of shear forces taken by Shear Wall.
Result :-
- Modeled and analyzed G+7 residential plan from given architectural drawings using Etabs 2018.
- Run a modal response spectrum analysis and check analysis results of the etabs model.