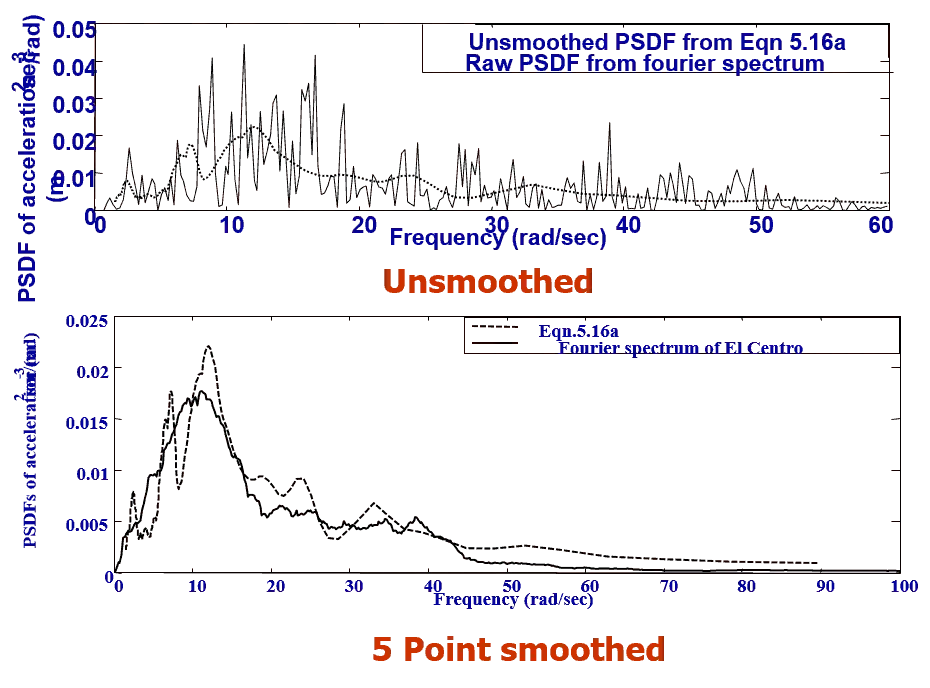
Structural dynamics
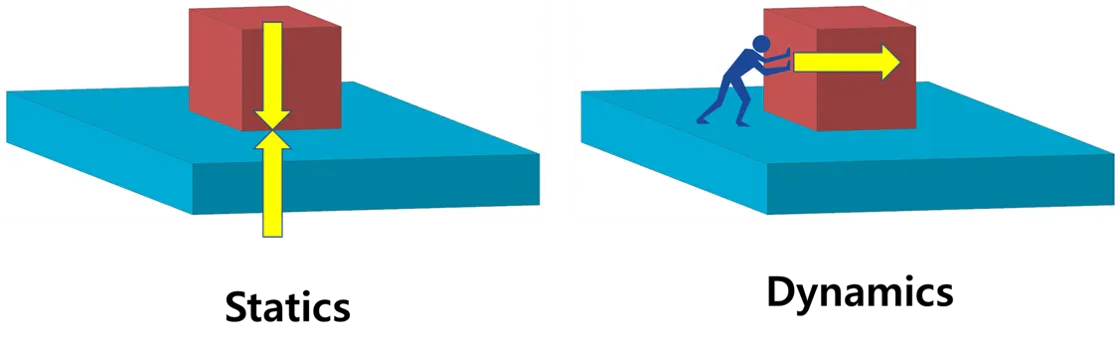
1. Differentiate Static analysis and Dynamic analysis with proper representing pictures
Static Analysis
- Definition: Static analysis is the process of examining code without executing it. It involves analyzing the source code or compiled code to identify potential errors, security vulnerabilities, and coding standards violations.
- Purpose: To find issues in the code early in the development cycle before the software is run.
- Tools Used: Examples include SonarQube, ESLint, PMD, and Coverity.
- Advantages:
- Identifies errors and vulnerabilities early, saving costs later.
- Ensures coding standards compliance.
- Does not require the application to be running.
- Limitations:
- Cannot catch runtime errors or issues dependent on user inputs or system states.
- Relies heavily on the accuracy of rules and patterns defined in the tools.
Dynamic Analysis
- Definition: Dynamic analysis involves evaluating a program during its execution. It tests how the software behaves in real-world scenarios and checks for runtime errors, memory leaks, and other operational issues.
- Purpose: To identify issues that only occur when the program is executed, such as performance bottlenecks and runtime security flaws.
- Tools Used: Examples include Valgrind, AppDynamics, JProfiler, and Dynatrace.
- Advantages:
- Detects runtime errors that static analysis cannot find.
- Helps in performance tuning and debugging.
- Validates the software’s behavior under various conditions.
- Limitations:
- Requires the application to be executed in a testing or production environment.
- Can be more resource-intensive and time-consuming.
Comparison Table
| Aspect | Static Analysis | Dynamic Analysis |
|---|---|---|
| When Performed | Before execution (compile-time). | During execution (runtime). |
| Focus | Code structure and syntax. | Program behavior and execution. |
| Tools | SonarQube, ESLint, Coverity. | Valgrind, JProfiler, Dynatrace. |
| Issues Found | Syntax errors, security vulnerabilities, dead code. | Memory leaks, performance issues, runtime errors. |
| Advantages | Early detection of issues; no need to execute the program. | Captures real-time issues; validates actual program behavior. |
| Limitations | Cannot catch runtime errors. | Requires program execution; more resource-intensive. |
Use Cases
- Static Analysis:
- Enforcing coding standards in large development teams.
- Identifying potential security vulnerabilities in the codebase.
- Analyzing legacy code to identify technical debt.
- Dynamic Analysis:
- Testing web applications under heavy traffic.
- Debugging runtime exceptions in real-world use cases.
- Performance optimization of high-load systems.
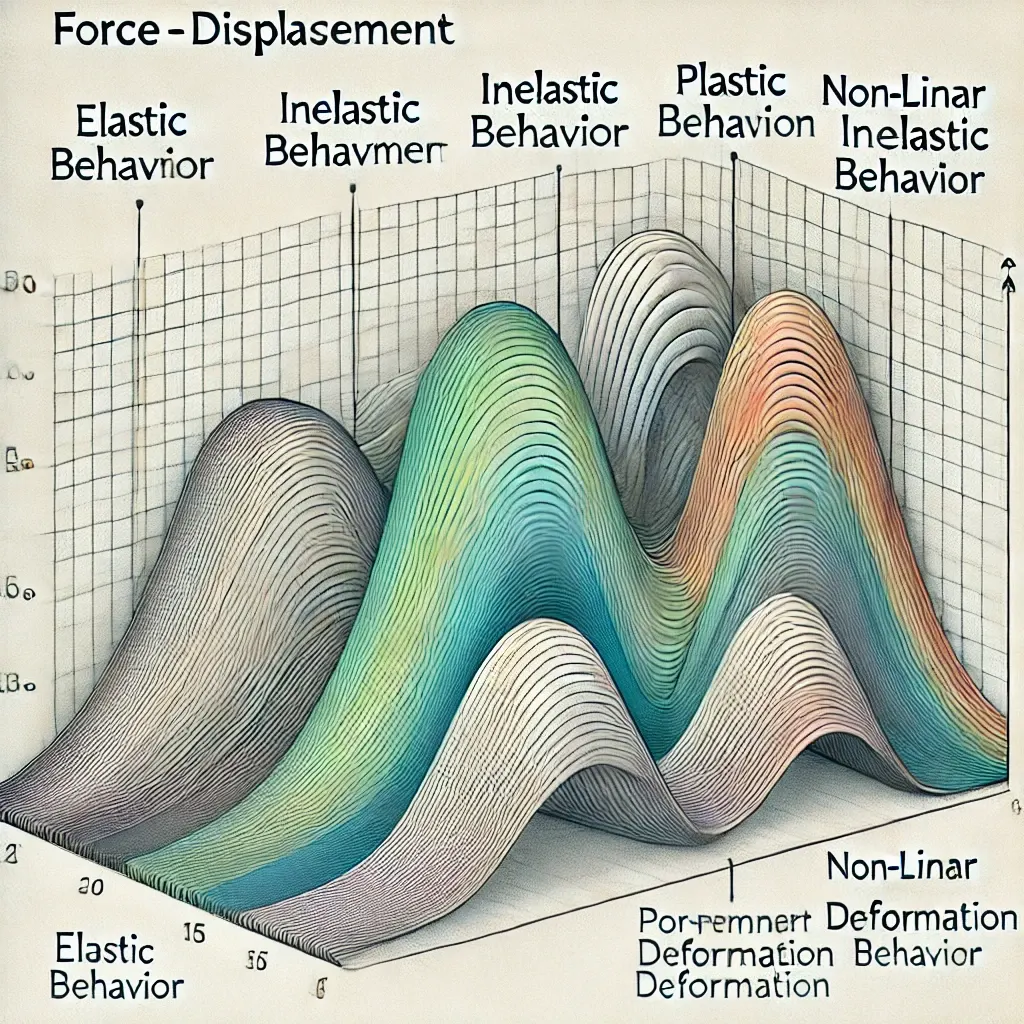
2. Explain the following with relevant force-displacement graph
- Elastic behavior
- Inelastic behavior
- Plastic behavior
- Non-linear Inelastic behavior
Elastic Behavior
- Description: The material returns to its original shape after the load is removed. This behavior is represented by a straight line in the force-displacement graph.
- Graph Characteristics:
- Linear region (Hooke’s Law).
- Proportional relationship between force and displacement.
- No permanent deformation occurs.
Inelastic Behavior
- Description: The material does not fully recover its original shape after the load is removed, but the deformation is not entirely permanent.
- Graph Characteristics:
- Begins as a linear region (elastic behavior).
- Deviates slightly from linearity near the elastic limit.
Plastic Behavior
- Description: The material undergoes permanent deformation after reaching its yield point. The material does not return to its original shape even after the load is removed.
- Graph Characteristics:
- Elastic region followed by a plateau or gradual increase in displacement.
- Represents permanent deformation beyond the yield point.
Non-linear Inelastic Behavior
- Description: The material exhibits complex deformation with non-linear relationships between force and displacement, typically occurring in advanced materials or under extreme conditions.
- Graph Characteristics:
- Non-linear curve throughout the graph.
- No distinct separation between elastic and inelastic regions.
- Represents gradual transitions and complex deformation mechanisms.
3. Explain Mass, Stiffness & Damping components in the equation of motion
In structural dynamics, the equation of motion is a mathematical model used to describe how a system responds to external forces. The general form of the equation is:
Here, M, C, and K represent the mass, damping, and stiffness components, respectively, while F(t) is the external force acting on the system, and x(t) is the displacement.
Components in the Equation
1. Mass (M)
- Definition: Represents the inertia of the system, i.e., its resistance to acceleration.
- Role:
- The mass term is associated with the second derivative of displacement (x¨(t)), which is the acceleration.
- It determines how the system responds to inertial forces.
- Real-life Example:
- In a car suspension system, the mass could represent the vehicle's weight.
- Effect:
- A higher mass results in slower response to applied forces due to increased inertia.
2. Stiffness (K)
- Definition: Represents the rigidity of the system, i.e., its ability to resist deformation under applied forces.
- Role:
- The stiffness term is associated with the displacement (x(t)).
- It determines the system's natural frequency and how much it deforms under a given load.
- Real-life Example:
- In a building structure, stiffness is contributed by beams, columns, and walls.
- Effect:
- Higher stiffness reduces deformation but increases the natural frequency of the system.
3. Damping (C)
- Definition: Represents energy dissipation in the system, i.e., resistance to motion due to friction, air resistance, or material properties.
- Role:
- The damping term is associated with the first derivative of displacement (x˙(t)), which is the velocity.
- It controls how quickly the system returns to equilibrium after being disturbed.
- Real-life Example:
- Shock absorbers in vehicles provide damping to reduce oscillations.
- Effect:
- Higher damping reduces vibrations and stabilizes the system but can slow down the response.
Physical Interpretation in Dynamics
- Mass (M) contributes to the inertial forces (Mx¨) and is responsible for resisting changes in motion.
- Stiffness (K) provides restoring forces (Kx) that bring the system back to its equilibrium position.
- Damping (C) opposes motion through resistive forces (Cx˙) and reduces oscillations or vibrations over time.
Equation in Simple Systems
- For a spring-mass-damper system:
- M: The mass suspended on the spring.
- K: The spring's stiffness constant.
- C: The damping coefficient of the damper.
- The equation of motion describes how the system vibrates or returns to rest when a force F(t) is applied.
4.Provide relationship between Natural period (Tn) & Natural frequency (f) and provide their definitions
Definitions and Relationship between Natural Period (Tn) and Natural Frequency (f):
1. Natural Period (Tn)
- Definition: The natural period is the time it takes for a system to complete one full cycle of vibration or oscillation under its natural frequency, without any external forces acting on it (free vibration).
- Units: Seconds (s).
- Formula: Tn=f1 where f is the natural frequency in Hz.
2. Natural Frequency (f)
- Definition: The natural frequency is the rate at which a system vibrates or oscillates naturally (without damping or external forces) when displaced from its equilibrium position.
- Units: Hertz (Hz), or cycles per second.
- Formula: f=Tn1 where Tn is the natural period in seconds.
Relationship between Tn and f:
Tn⋅f=1
This shows that the natural period and natural frequency are reciprocals of each other.
Expressions in Terms of Stiffness and Mass
For a simple system, the natural frequency (f) is related to the system's mass (M) and stiffness (K):
f=2π1MK
From this, the natural period (Tn) is:
Tn=2πKM
5. Explain in detail about Response spectrum & its Graph
Response Spectrum: Definition and Explanation
1. What is a Response Spectrum?
A response spectrum is a graphical representation of the maximum response (such as displacement, velocity, or acceleration) of a structure or system subjected to a particular dynamic loading, typically an earthquake. It provides insight into how structures of different natural frequencies (or periods) react to the same ground motion.
The response spectrum is used extensively in structural and earthquake engineering for analyzing and designing buildings and other structures to withstand seismic forces.
2. Components of the Response Spectrum
The response spectrum graph is typically plotted with:
- X-axis: Natural Period (Tn) or Natural Frequency (f) of the structure.
- Y-axis: Maximum response of interest:
- Acceleration response spectrum (ARS): Maximum acceleration (common in seismic design).
- Velocity response spectrum (VRS): Maximum velocity.
- Displacement response spectrum (DRS): Maximum displacement.
3. How is it Obtained?
- A single-degree-of-freedom (SDOF) system with a specific natural frequency is subjected to a ground motion (e.g., earthquake data).
- The maximum response (acceleration, velocity, or displacement) of the system is recorded.
- This process is repeated for systems with varying natural frequencies or periods.
- The results are plotted to create the response spectrum curve.
Types of Response Spectra
- Elastic Response Spectrum: Assumes the structure remains within its elastic range.
- Inelastic Response Spectrum: Accounts for material yielding and energy dissipation.
- Damped Response Spectrum: Includes the effects of different damping ratios (e.g., 2%, 5%, or 10%).
Response Spectrum Graph
The graph typically shows distinct regions corresponding to structural behavior:
Acceleration-Dominant Region (Short Periods):
- At very low periods (high frequencies), acceleration is dominant.
- Structures with high stiffness (low periods) experience significant acceleration.
Velocity-Dominant Region (Intermediate Periods):
- At intermediate periods, velocity dominates the response.
- Structures are more flexible, and resonance effects are significant.
Displacement-Dominant Region (Long Periods):
- At long periods (low frequencies), displacement dominates.
- Structures experience larger deformations.
Significance of Response Spectrum
- Seismic Design: Helps engineers design structures to withstand expected seismic forces.
- Resonance Identification: Identifies critical periods/frequencies where a structure may experience resonance.
- Dynamic Analysis: Simplifies the analysis of complex structures by reducing earthquake loads to their peak responses.
Example
- If a building has a natural period of Tn=1s and is subjected to an earthquake with a given response spectrum, the peak acceleration can be directly read from the graph at Tn=1s.
- This value is used to estimate the forces and stresses on the building for design purposes.