Structural dynamics
1. Differentiate Static analysis and Dynamic analysis with proper representing pictures
STATIC ANALYSIS
- Static analysis can only be performed if the system being simulated does not depend on time,and if the loads being applied are constant.
- Static analysis don't consider inertia.
- Static refers to the force that has constant size,position and direction on or within a structure
- There is no necessity to count inertia and damping forces in case of static analysis,but the elastic force should be accounted
DYNAMIC ANALYSIS
- In dynamic analysis ,the system itself,the load application or both might change with time
- The inertial force developed by the system due to accelaration are taken into account
- Dynamic refers to a force on a structure that changes size, position or direction
- In dynamic , two additional forces must be accounted such as inertia and damping force in equilibrium equation it can be disregarded in static analysis
2. Explain the following with relevant force-displacement graph
- Elastic behavior
- Inelastic behavior
- Plastic behavior
- Non-linear Inelastic behavior
1.Elastic behavior
- Elasticity , ability of a deformed material body to return to its original shape and size when the forces causing the deformations are removed
- A body with this ability is said to behave elastically
- The theory of elasticity is used to design safe and stable man-made structures such as skyscrappers and overbridges to make life convenient
- From graph it is clearly mensioned that upto certain point from 'O' the graph is linear and shows elastic properties
2.Inelastic behavior
- Deformation material that does not disappear on the removal of force produced by it
- Inelastic material will experience no elongation or deflection and up to its ultimate strength is reached will just rupture suddenly usually through shear break
- Example: wood, fabricetc..
- In graph inelastic behavior has been shown in the upper shape of the curve upto point "a"
3.Plastic behavior
- For stresses beyond the elastic limit,a material exhibits plastic behavior.
- This means the material deforms irreversibly and does not return to its original shape and size, even when the load is removed
- When stress is gradually increased beyond the elastic limit, the material undergoes plastic deformation
- Plastic wrap is an example of plasticity
- In graph the plastic behavior occurs during unloading after point "a"
2.Non-linear Inelastic behavior
- Materials have elastic behvior usually only upto a certain point after that deformation are plastic and the relation in this is not linear, that is non linear elastic behavior
- Non-linear elastic behavior occurs after the line from "o" tends to bend towards point"a"
3. Explain Mass, Stiffness & Damping components in the equation of motion
Stiffness component
- The frame without damping or mass.
- The external force 'fs' on the stiffness component is related to displacement u by fs=ku
- If the system is linearly elastic
Damping component
- The frame with its damping property with no stiffness or mass .
- The external force on the damping component is related to velocity by fd=cv
Mass component
- The roof mass without stiffness or damping of the frame.
- The external force fi on the mass component is related to the accelaration


4. Provide relationship between Natural period (Tn) & Natural frequency (f) and provide their definitions
Natural Period Of Vibration (Tn)
- It is the time required for the undamped system to complete one cycle of free vibration
- Units in seconds
- It is realated to the natural circular frequency of vibration wn , in units of radians per second
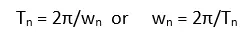
Natural Cyclic Frequency (fn)
- The number of cycles (or one complete revolution) executed by system in 1 sec
- units in hertz

5. Explain in detail about Response spectrum & its Graph
RESPONSE SPECTRUM
- It is a central concept in earthquake engineering, response spectrum is a practical means of characterizing ground motions and their effects on structures of different Tn
- It provides a convenient means to summarize the peak response of all possible linear SDF systems to a particular component of ground motion
- It also provides a particular approach to apply the knowledge of structural dynamics to the design structures and development of lateral force requirements in building codes
- A plot of the peak value of a response quantity (u,v and a) as a function of the natural vibration period Tn of the system,is called the response spectrum for that quantity
- Each such plot is for SDF systems having a fixed damping ratio ζ and several such plots for different values ζ are included to cover the range of damping values encountered in actual structures
- The response spectrum can be of 3 types , the deformation response spectrum is a plot of peak u, against Tn for fixed ζ . A similar plot for peak ú, is the relative velocity response spectrum, and for peak üT ,is the accelaration response spectrum
A response spectrum is a plot of the peak or steady-state response (displacement, velocity or acceleration) of a series of oscillators of varying natural frequency, that are forced into motion by the same base vibration or shock. The resulting plot can then be used to pick off the response of any linear system, given its natural frequency of oscillation. One such use is in assessing the peak response of buildings to earthquakes. The science of strong ground motion may use some values from the ground response spectrum (calculated from recordings of surface ground motion from seismographs) for correlation with seismic damage.
If the input used in calculating a response spectrum is steady-state periodic, then the steady-state result is recorded. Damping must be present, or else the response will be infinite. For transient input (such as seismic ground motion), the peak response is reported. Some level of damping is generally assumed, but a value will be obtained even with no damping.
Response spectra can also be used in assessing the response of linear systems with multiple modes of oscillation (multi-degree of freedom systems), although they are only accurate for low levels of damping. Modal analysis is performed to identify the modes, and the response in that mode can be picked from the response spectrum. These peak responses are then combined to estimate a total response. A typical combination method is the square root of the sum of the squares (SRSS) if the modal frequencies are not close. The result is typically different from that which would be calculated directly from an input, since phase information is lost in the process of generating the response spectrum.
The main limitation of response spectra is that they are only universally applicable for linear systems. Response spectra can be generated for non-linear systems, but are only applicable to systems with the same non-linearity, although attempts have been made to develop non-linear seismic design spectra with wider structural application. The results of this cannot be directly combined for multi-mode response.