Steady Vs Unsteady flow over a cylinder
AIM: -
To simulate the flow for the given Reynolds number, plot necessary graphs & calculate the Strouhal number for Re = 100 for both Steady and Transient analysis.
Abstract: -
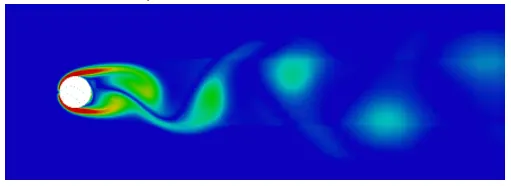
To perform external fluid flow analysis on any object virtually, there should be a bluff body. Here, the bluff body is cylinder, which it can be assumed to be as a circle with a diameter with a proper boundary condition. As it is a 2- Dimensional problem, using both Steady and Transient Analysis with varying Reynolds number ranging from 10 to 10E+5. During this analysis, there is a phenomenon that can be observed, i.e. Von-Karman Vortex Street formation of the phenomenon leads from the flow separation region resulting in periodic values in graphs Cd, Cl when plotted.
Introduction: -
The flow was kept laminar throughout all the Reynolds number ranging from 10 to 10E+5.Finite volume method is utilised to discretize the governing equations. This challenge is to study the mechanism that is being exhibited on any shape and for industrial applications.
There are vortex generators in aerospace application
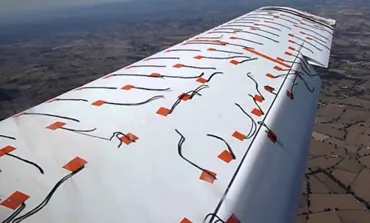
The above pic represents the aeroplane wing. While in air, there are improper interactions of air with of wing, because of slippage of boundary layer of air. If there should be an interaction of air with total surface, the vortex generator plays a major role. If V.G is installed the below pic is the reference (Here V.G is Vortex Generator)
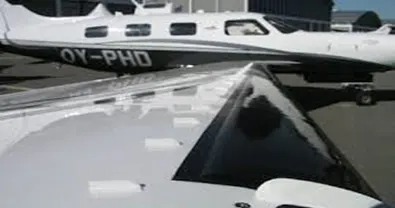
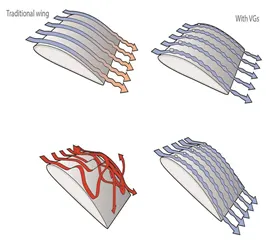
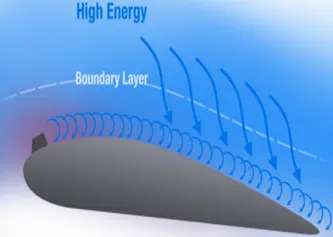
The above figure represents before installing V.G and after installing of V.G for an aeroplane wing. There are many applications like automobile sector.
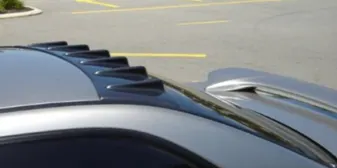
This is used when the separation layer of air is formed. That can be observed, if there are any rain droplets on the rear wind shield, then pressure drag increases and the person driving the car can experience the slowdown of vehicle.
Objectives:
Part-1:
- Simulate the flow with the steady and unsteady case and calculate the Strouhal Number for Re= 100.
Part-2
- Calculate the coefficient of drag and lift over a cylinder by setting the Reynolds number to 10,100,1000,10000 & 100000. (Run with steady solver)
- Discuss the effect of Reynolds number on the coefficient of drag.
Setup: -
Geometry: -
The modelling of geometry can either be done in both space claim as well as designer modeler.
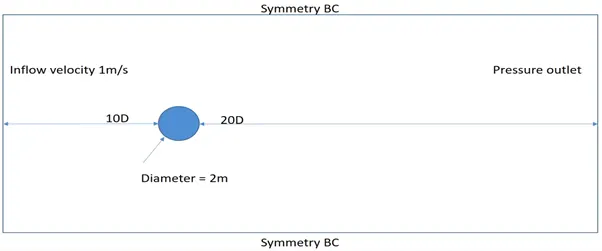
The above fig represents the dimensions of the geometry, now by using designer modeler, draw the lines and circle according to the above dimensions.
Go to concept → surface from sketches. Select the edges and circle → generate.
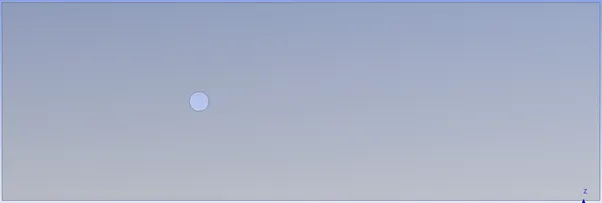
Close the designer modeler.
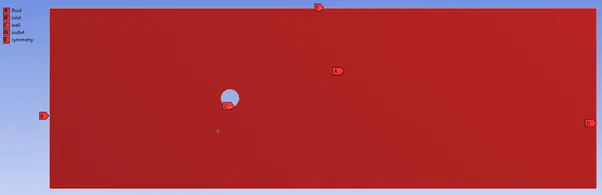
Open Mesh give the named selections as Inlet, Outlet, Wall, Symmetry.
Mesh: -
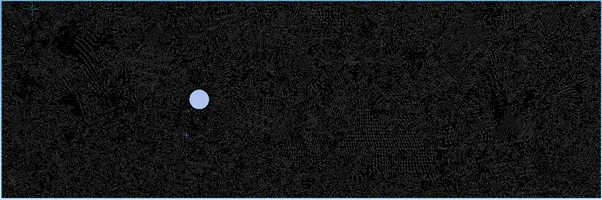
Mesh → Methods → all triangles.
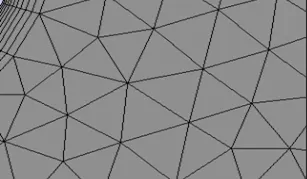
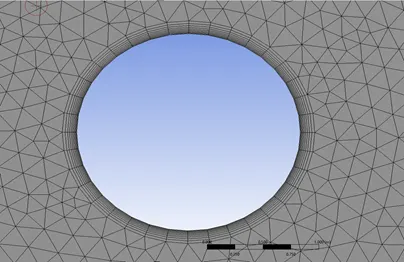
Mesh → Inflation →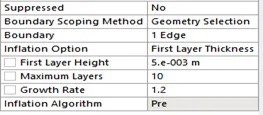
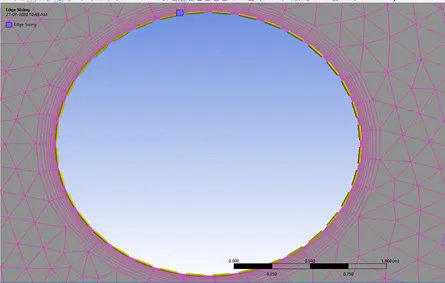
Mesh → Edge sizing → Number of divisions → 36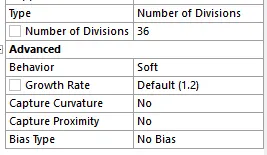
Mesh → Defaults → Element Size → 0.1m
Solution: -
Steady State:
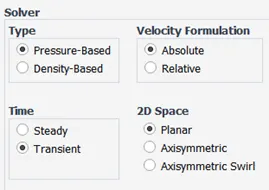
General →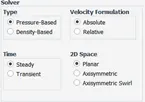
Models → Laminar
Materials → Fluid → Air → Properties
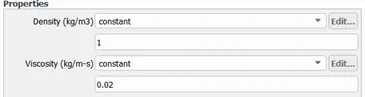
Boundary conditions → Inlet Velocity → 1m/s
Reference Values →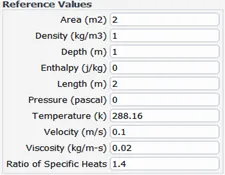
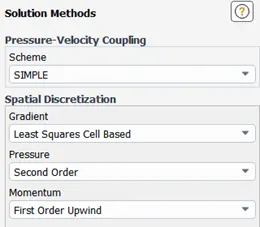
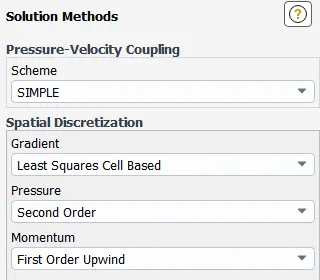
Method → Simple
Report Definitions → Cd, Fd, Cl, Lift Force
Initialization → Hybrid
Calculation activities → Solution animations → Save for every 10 iterations → Velocity
Results → Surface → Create → Point
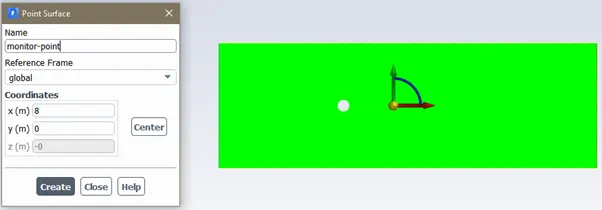
Setup:
Part: - 1
Steady State analysis: -
Re = 100
Velocity = 1m/s
Ref Values: -
- Area: 2 m2
- Length: 1 m
- Velocity: 1m/s
- Viscosity: 0.02 kg/m-s
Iterations: - 3750
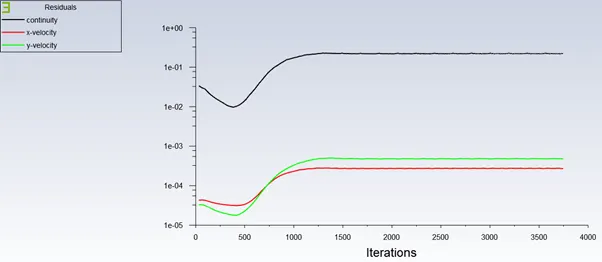
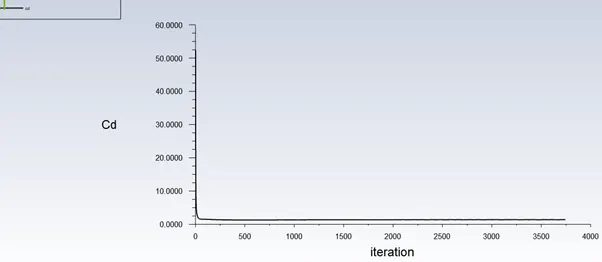
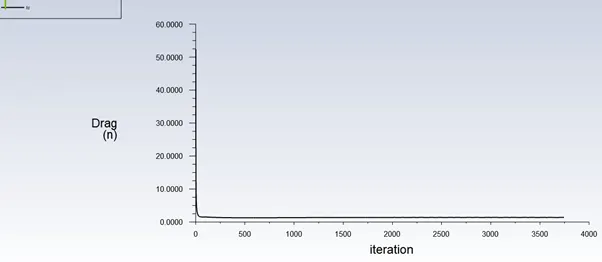
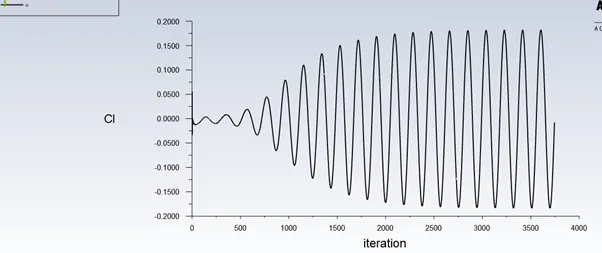
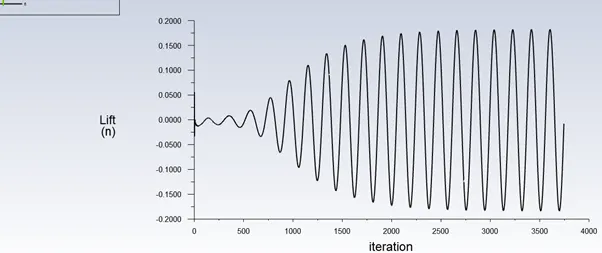
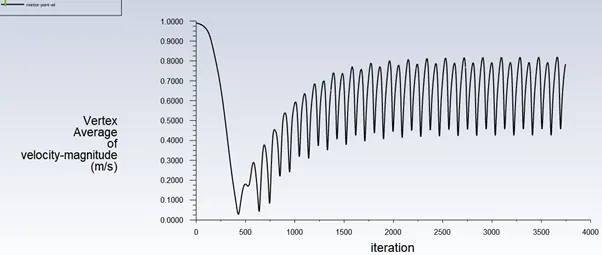
The solution was converged at 124th iteration, but to observe the vortex shedding 3750 iterations were run.
Residuals:
Coeff of Drag:
Drag Force:
Coeff of Lift:
Lift Force:
Velocity magnitude at Monitor point:
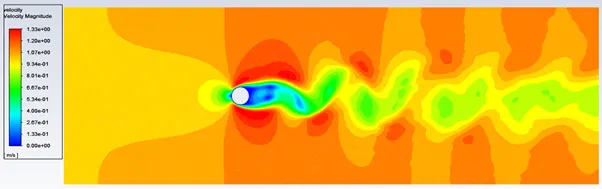
Contours of Velocity:
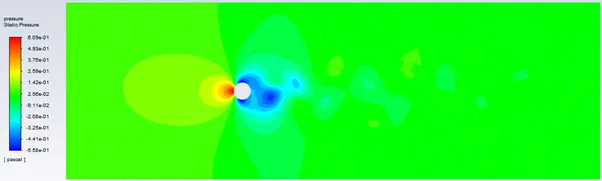
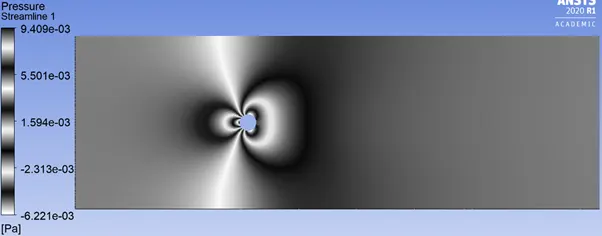
Contours of Pressure:
Result: -
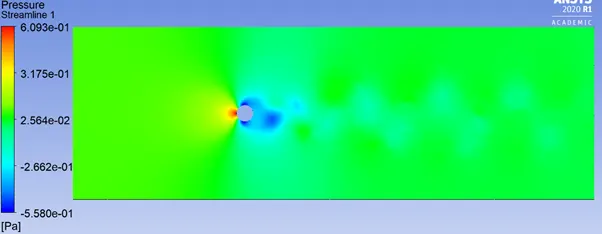
Surface Streamline(default colour) of Velocity:
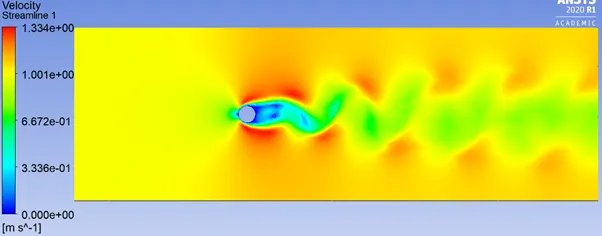
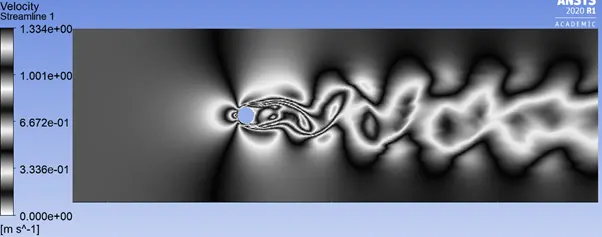
Surface streamline (zebra colour) of Velocity:
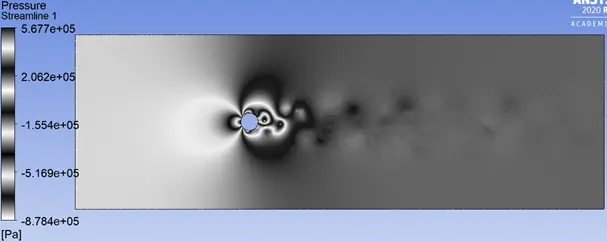
Surface streamline (rainbow colour) of Pressure:
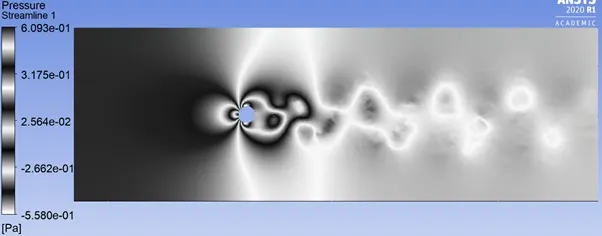
Surface streamline (zebra colour) of Pressure:
Transient analysis: -
Re = 100
Velocity = 1m/s
Ref Values: -
- Area: 2 m2
- Length: 1 m
- Velocity: 1m/s
- Viscosity: 0.02 kg/m-s
Parameters: -
Number of Time Steps: 2600
Time Step Size (s): 0.1
Max Iteration per Time Step: 20
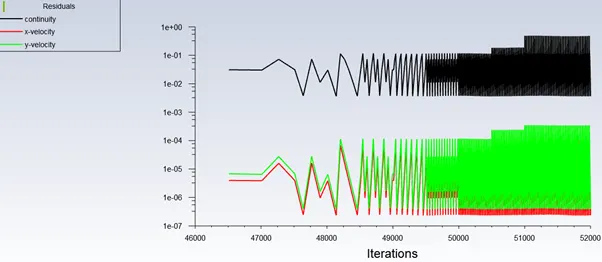
Residuals:
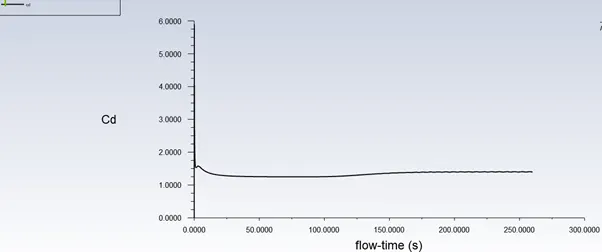
Drag Coeff:
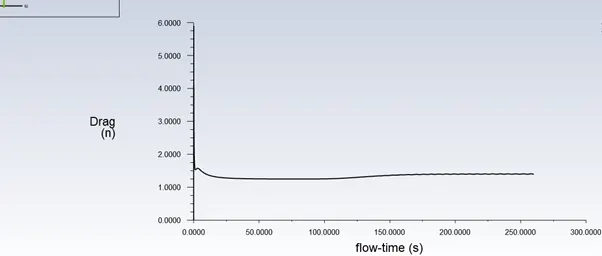
Drag Force:
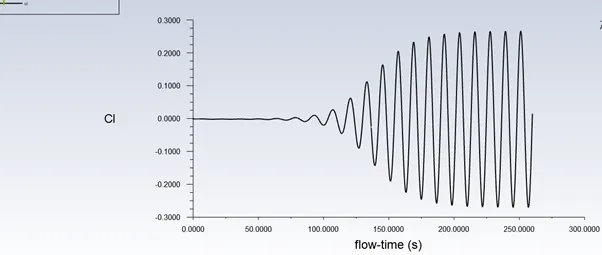
Coeff of Lift:
Lift Force:
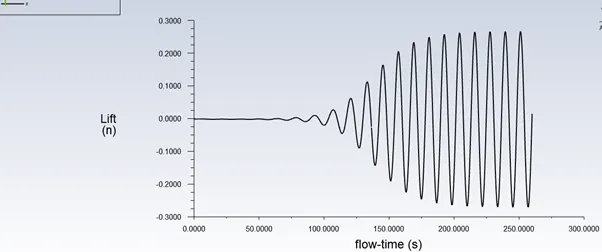
Velocity Magnitude at Monitor Point:
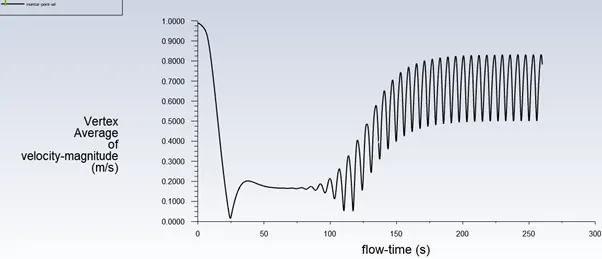
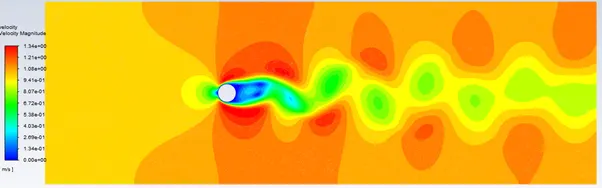
Velocity Contour:
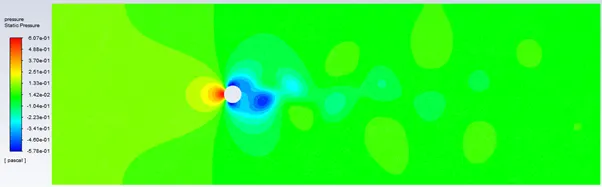
Pressure Contour:
Result:
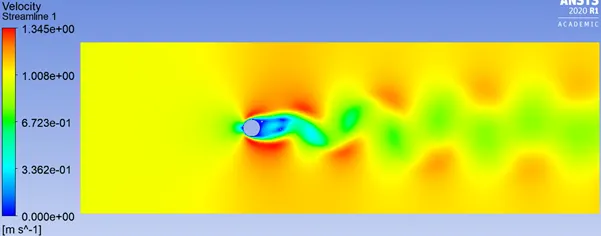
Surface Streamline(default colour) of Velocity:
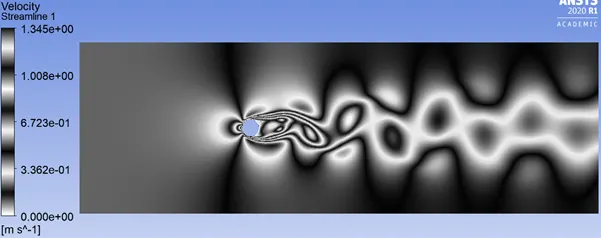
Surface streamline (zebra colour) of Velocity:
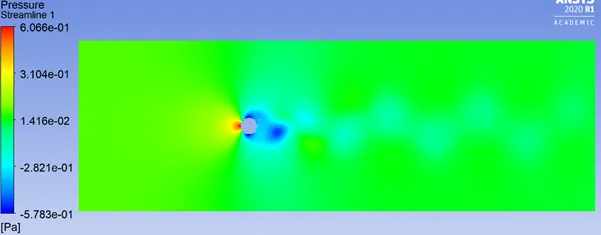
Surface streamline (rainbow colour) of Pressure:
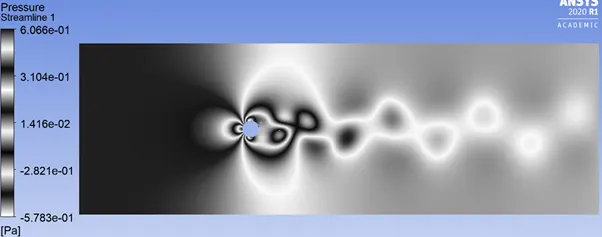
Surface streamline (zebra colour) of Pressure:
Summary:
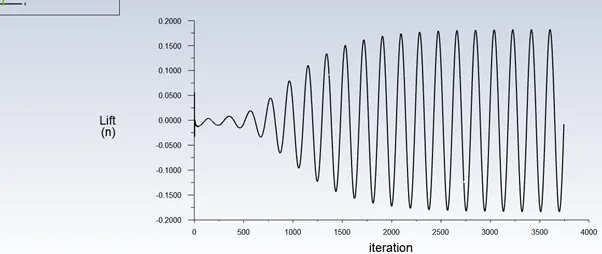
To calculate the Strouhal Number for Re= 100, From the lift force graph, the frequency can be calculated by counting the number of waves from 225 sec to 250 sec. There were 2.25 waves between the time interval. So, by applying the formula, 2.25/25 → 0.09Hz. Then,
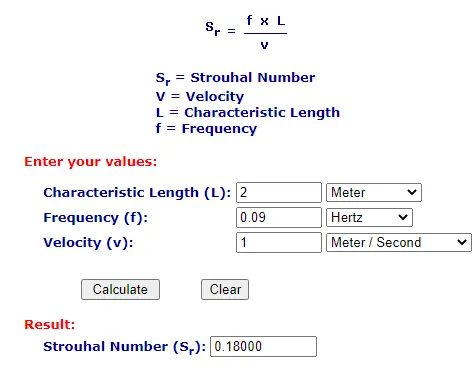
Strouhal Number is 0.18.
This frequency is only taken from transient analysis because, it runs with respect to time. But in steady state, it runs with iteration. Frequency can be calculated only with time.
Part 2: -
Re = 10
Velocity = 0.1m/s
Reference Values: -
- Area: 2 m2
- Length: 2 m
- Velocity: 0.1 m/s
- Viscosity: 0.02 kg/m-s
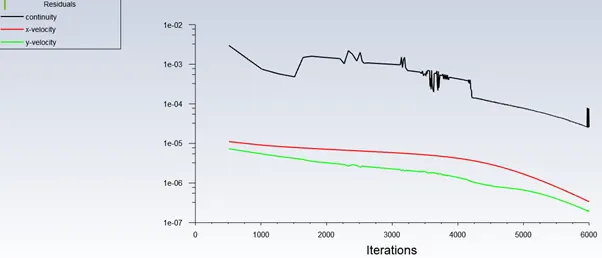
Iterations: 6000
Residuals:
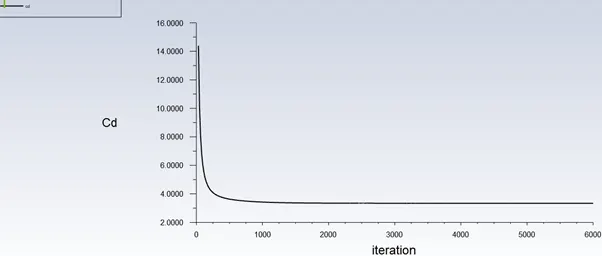
Coeff of Drag:
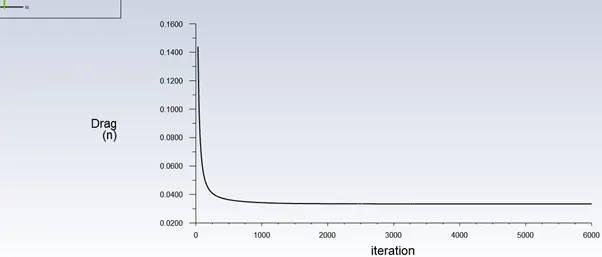
Drag Force:
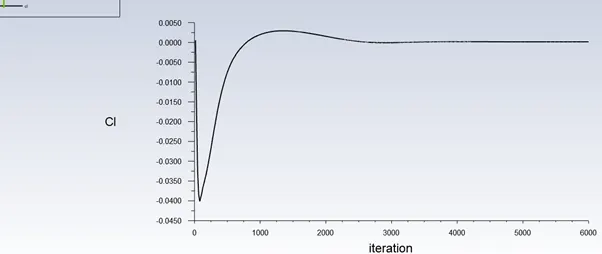
Coeff of Lift:
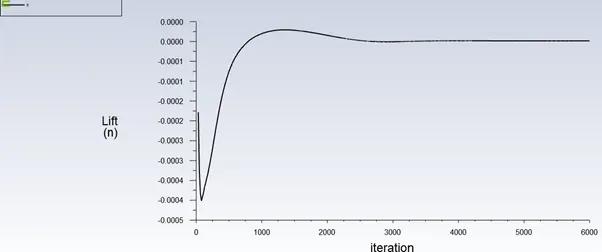
Lift Force:
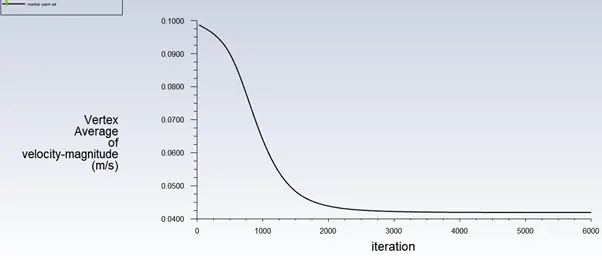
Velocity magnitude at Monitor point:
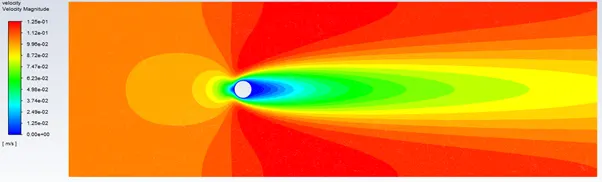
Velocity Contour:
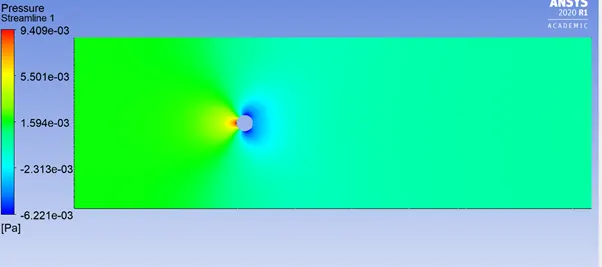
Pressure Contour:
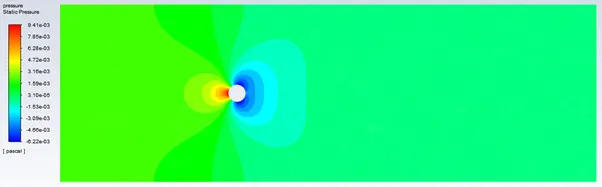
Result: -
Surface streamline (rainbow colour) of Velocity:
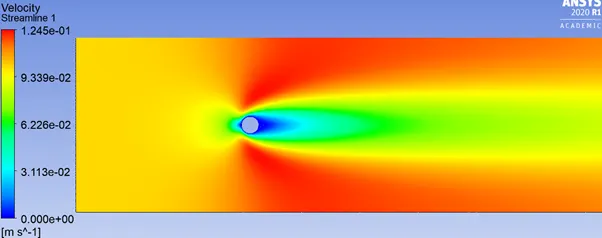
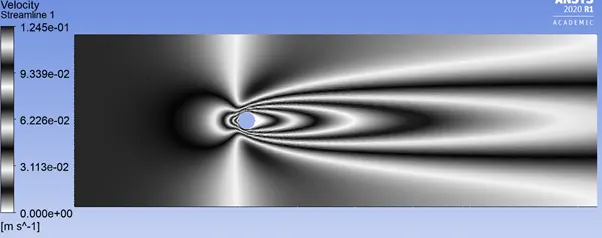
Surface streamline (zebra colour) of Velocity:
Surface streamline (rainbow colour) of Pressure:
Surface streamline (zebra colour) of Pressure:
Re = 100
Velocity = 1 m/s
Reference Values: -
- Area: 2 m2
- Length: 2 m
- Velocity: 1 m/s
- Viscosity: 0.02 kg/m-s
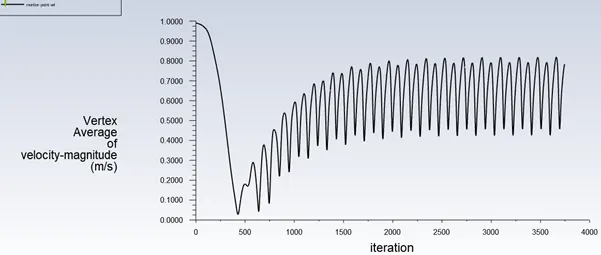
Iterations: 3750
Residuals:
Coeff of Drag:
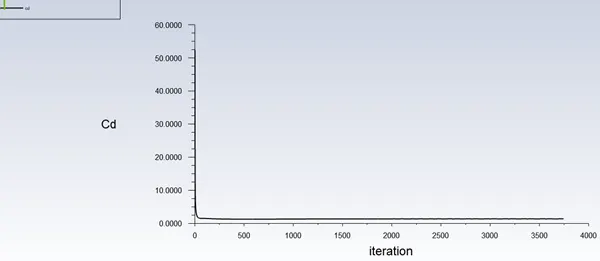
Drag Force:
Coeff of Lift:
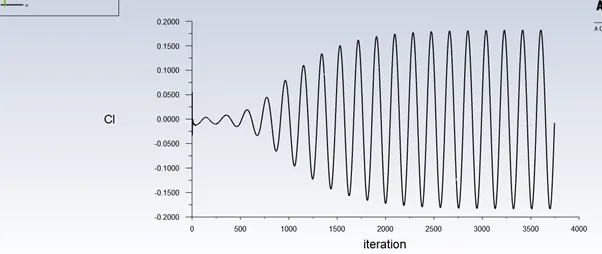
Lift Force:
Velocity magnitude at Monitor point:
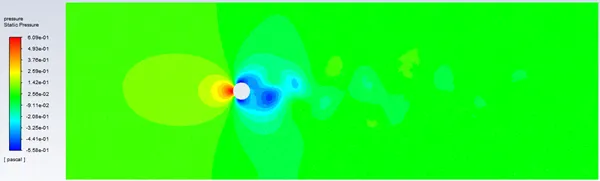
Velocity Contour:
Pressure Contour:
Result:
Surface streamline (rainbow colour) of Velocity:
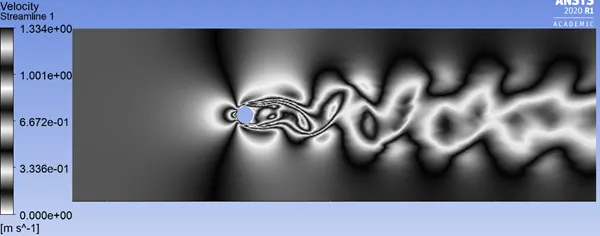
Surface streamline (zebra colour) of Velocity:
Surface streamline (rainbow colour) of Pressure:
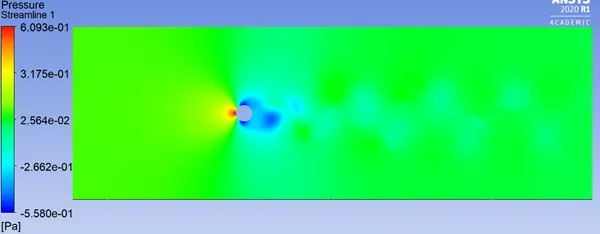
Surface streamline (zebra colour) of Pressure:
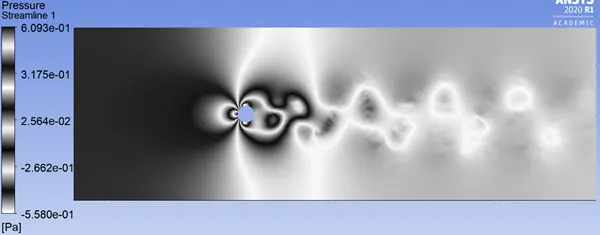
Re = 1000
Velocity = 10 m/s
Reference Values: -
- Area: 2 m2
- Length: 2 m
- Velocity: 10 m/s
- Viscosity: 0.02 kg/m-s
Iterations: 3000
Residuals:
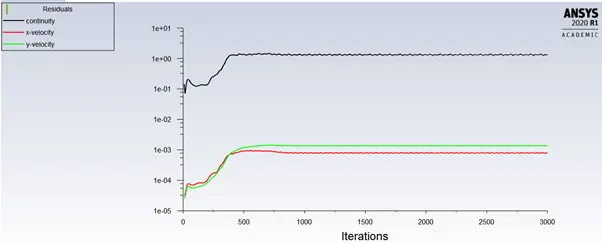
Coeff of Drag:
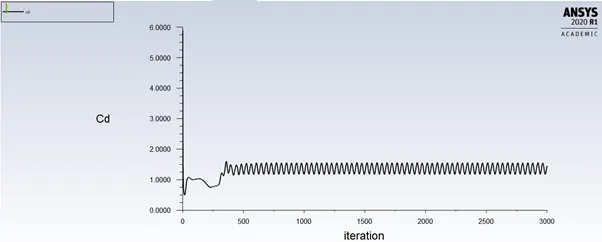
Drag Force:
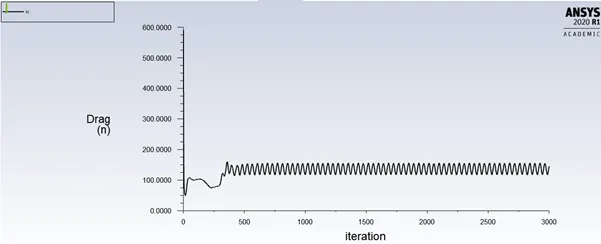
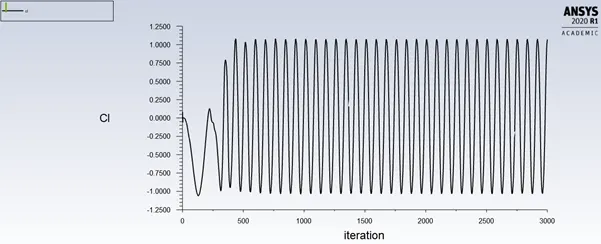
Coeff of Lift:
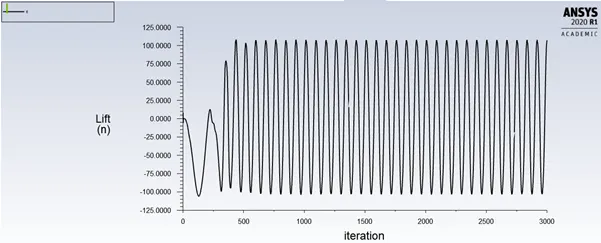
Lift Force:
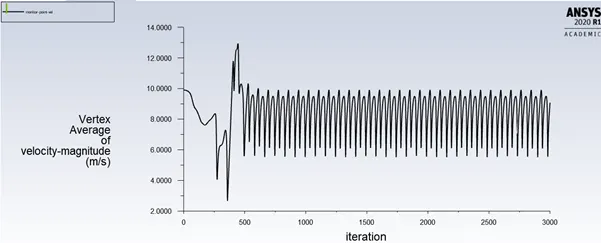
Velocity magnitude at Monitor point:
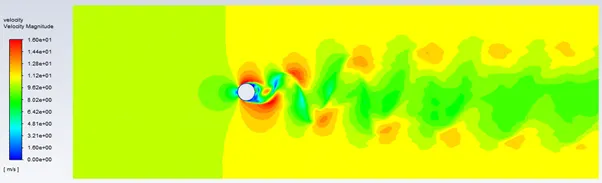
Velocity Contour:
Pressure Contour:
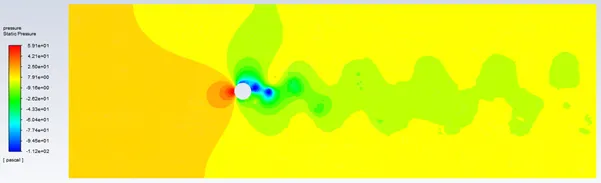
Result:
Surface streamline (rainbow colour) of Velocity:
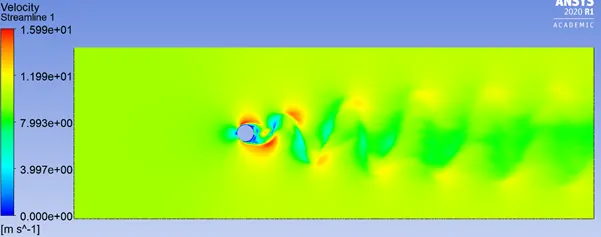
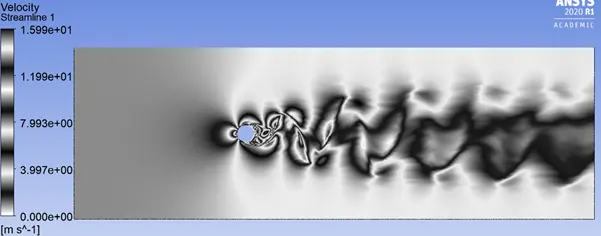
Surface streamline (zebra colour) of Velocity:
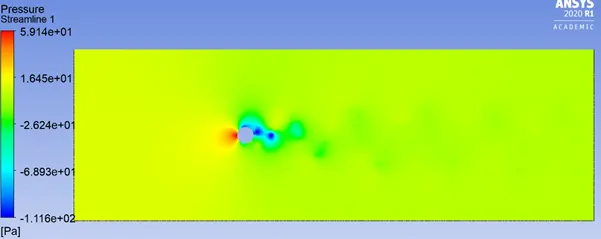
Surface streamline (rainbow colour) of Pressure:
Surface streamline (zebra colour) of Pressure:
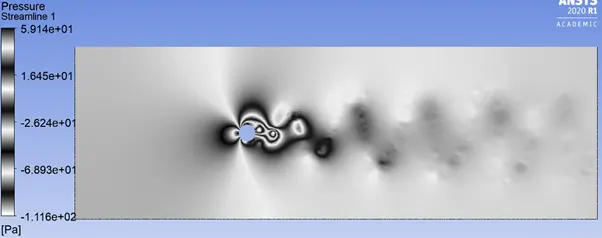
Re = 10000
Velocity = 100 m/s
Reference Values: -
- Area: 2 m2
- Length: 2 m
- Velocity: 100 m/s
- Viscosity: 0.02 kg/m-s
Iterations: 3000
Residuals:
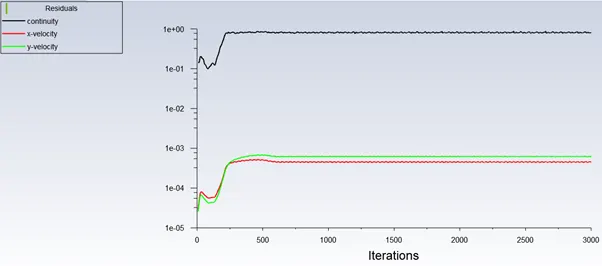
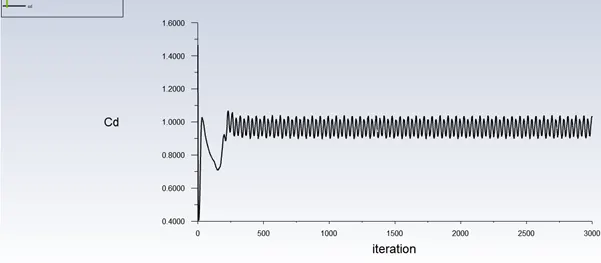
Coeff of Drag:
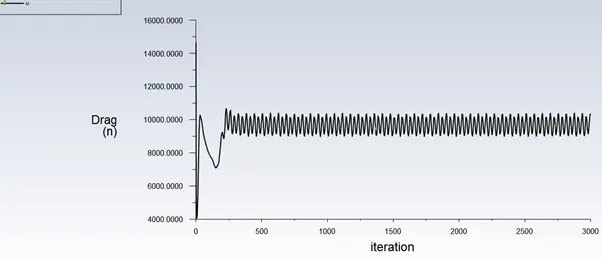
Drag Force:
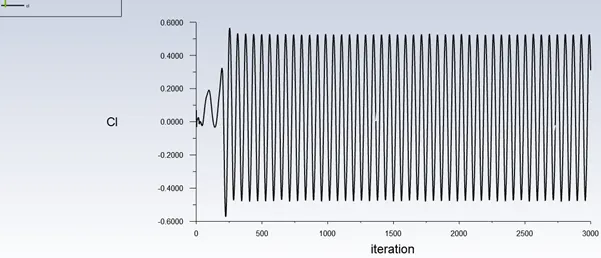
Coeff of Lift:
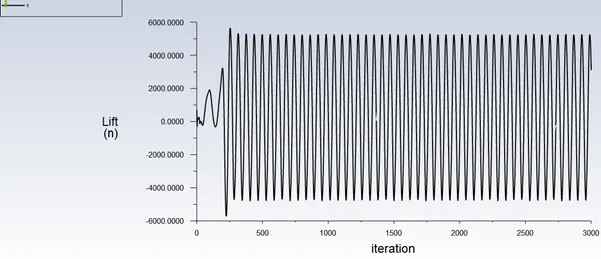
Lift Force:
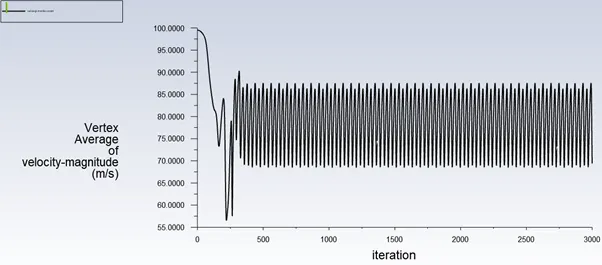
Velocity magnitude at Monitor point:
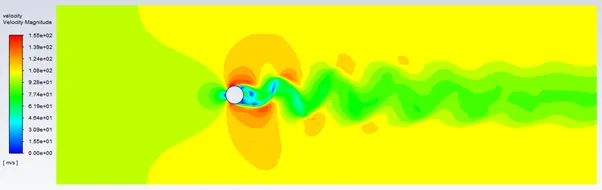
Velocity Contour:
Result:
Surface streamline (rainbow colour) of Velocity:
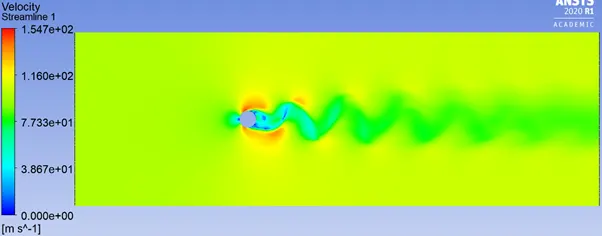
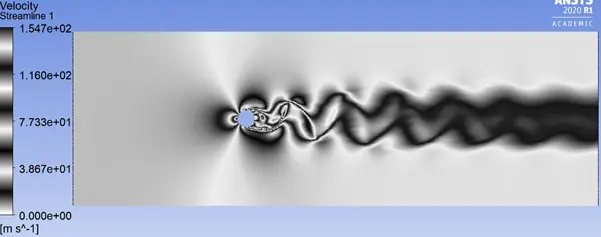
Surface streamline (zebra colour) of Velocity:
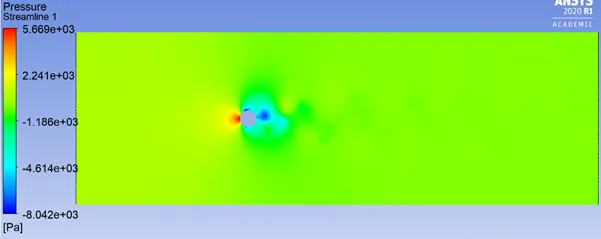
Surface streamline (rainbow colour) of Pressure:
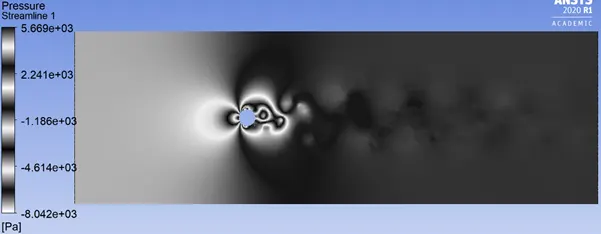
Surface streamline (zebra colour) of Pressure:
Re = 100000
Velocity = 1000 m/s
Reference Values: -
- Area: 2 m2
- Length: 2 m
- Velocity: 1000 m/s
- Viscosity: 0.02 kg/m-s
Iterations: 3500
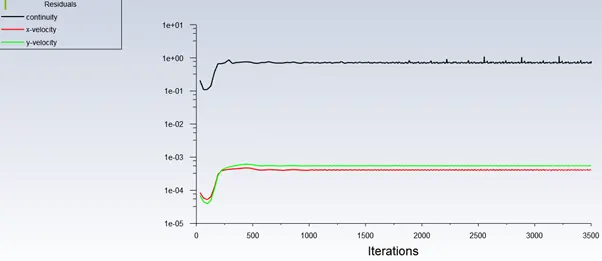
Residuals:
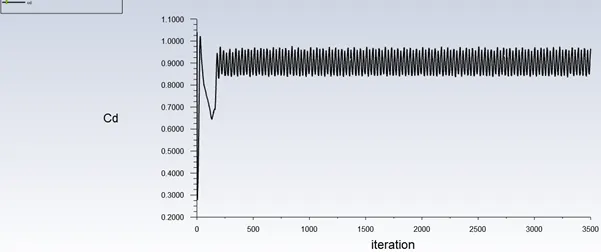
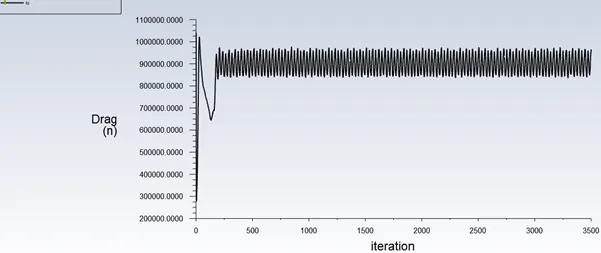
Coeff of Drag:
Drag Force:
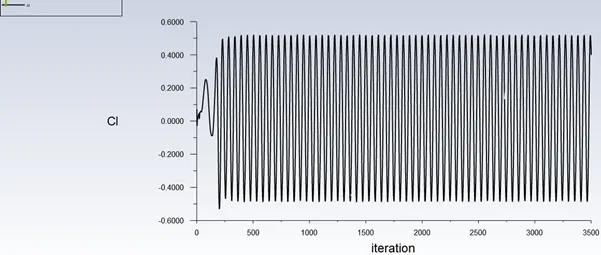
Coeff of Lift:
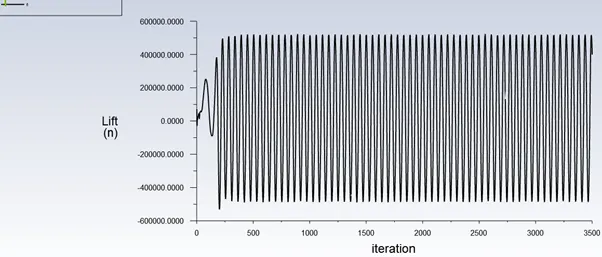
Lift Force:
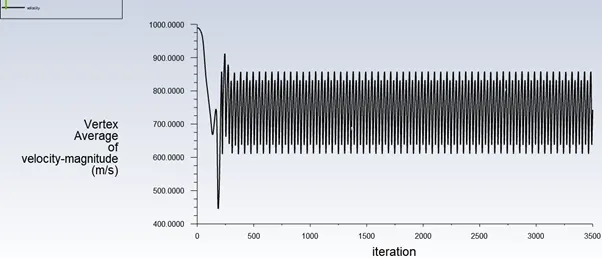
Velocity magnitude at Monitor point:
Velocity Contour:
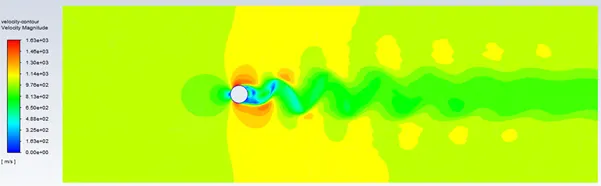
Result:
Surface streamline (rainbow colour) of Velocity:
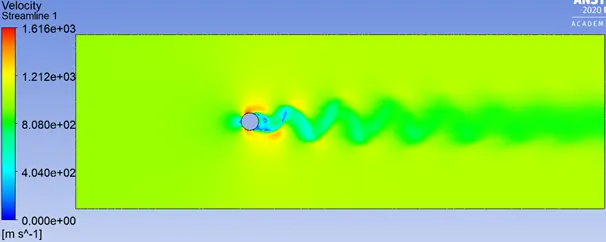
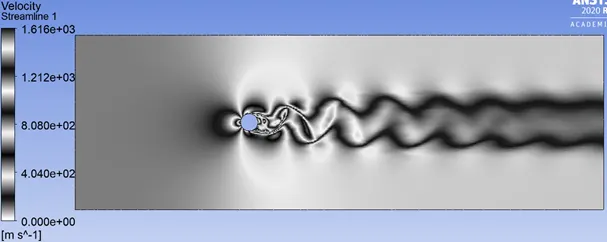
Surface streamline (zebra colour) of Velocity:
Surface streamline (rainbow colour) of Pressure:
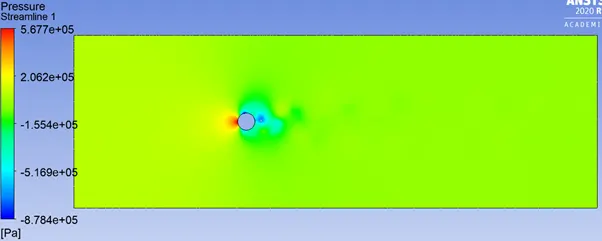
Surface streamline (zebra colour) of Pressure:
Summary:
The Values in the Reference values must be changed for every problem.
Every model is a laminar model.
Only Transient analysis is used to find Strouhal Number.
The Zebra colour is used because, there is a clarity of how the vortex shedding is dissipating.
Fluid materials like air, water, corn syrup..Etc.
The below is the Drag, Lift Values of the solution
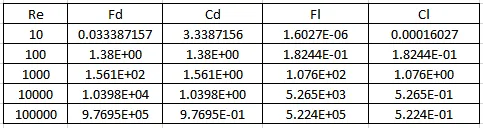
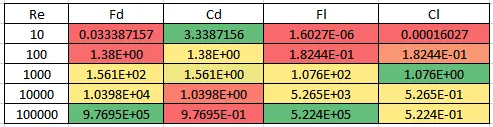
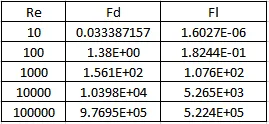
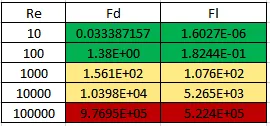
If we observe the values, Drag Force, Lift Force increases with increase in Reynolds Number. (Unit of Measure is Newtons).
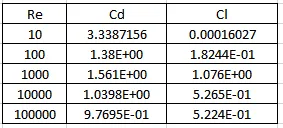
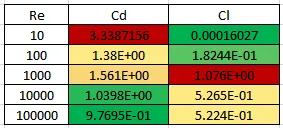
If we Observe, the Coefficient of Drag decreases with Increase in Reynolds Number. Where Coefficient of Lift decreases → Increased → Decreasing. If we calculate for further Reynolds Numbers, Ultimately, the Lift Value Decreases. ( Has no Unit's of Measure).
If wake regions are developed, The Vertex generators are used.
By Knowing the frequency, if the frequency we got is matched with resonance frequency of the body, then the body results in failure. Then new Design should be developed e.g: Bridge