Steady Vs Unsteady flow over a cylinder
STEADY VS UNSTEADY FLOW OVER A CYLINDER
The aim is to simulate the flow over a cylinder for both steady-state and transient cases and observe the Von Karman Vortex Street.
Von Karman Vortex street is a repeating pattern of swirling vortices caused by a process known as vortex shedding which is responsible for the unsteady separation of flow of a fluid around blunt bodies.
A vortex street will only form at a certain range of flow velocities, specified by a range of Reynolds number(Re), typically above a limiting value of 90.
GEOMETRY
The geometry will be a 2-D Top view of the cylinder.
--Inlet-------> ------Outlet----->
The hole diameter is 2m
Hole-Centre to Inlet - 20m
Hole-Centre to Outlet - 40m
Total length - 60m
MESH
Element size - 0.25m
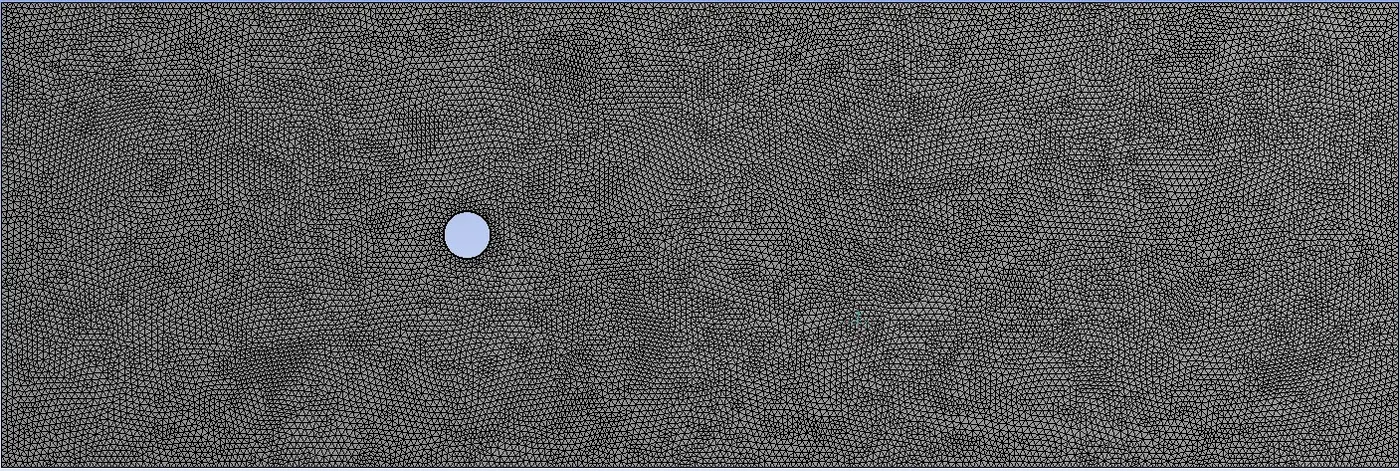
Number of Elements - 40864
All the elements are Triangles and six inflation layers are added with a growth rate of 1.2 for a body-fitted mesh.
Edge sizing was also done with 36 number of divisions so that the Hole in the centre is Rendered properly after meshing.
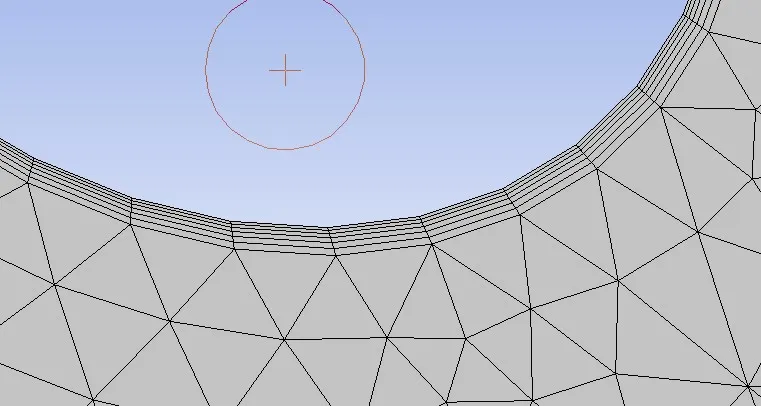
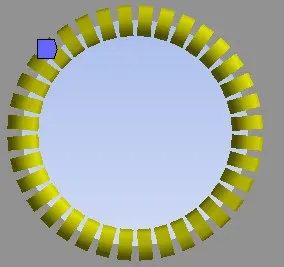
6 Inflation layers Edge sizing
with 36 divisions
The geometry is now ready with a suitable mesh for simulation.
Inlet and Outlet have already been described above, the hole in the centre is the Wall
While the top and bottom edges are the symmetrical boundaries and are named as Symmetry.
STEADY-STATE CASE.
Now,
Renolds number Re = 100
`Re = (rho*V*D)/mu`
`mu` = Fluid Dynamic Viscosity(kg/m*sec)
`V` = Fluid Velocity (m/sec)
`D` = Diameter of Pipe(m)
`rho` = Density(Kg/m^3)
In order the Re = 100
`mu = 0.02`
`V = 1`
`rho = 1`
`D = 2`
With these parameters, we can proceed with the simulation.
Solver Configuration
Solver Type - Pressure based
Velocity Formulation - Absolute
2-D space - Planar
Time - Steady-state.
Solution Method
Scheme - SIMPLE
Spatial Discretization
Gradient - Least squares cell-based
Pressure - second order
Momentum - Second-order Upwind
The simulation is parameterized in such a way that we can observe the phenomena of vortex shedding.
RESULTS
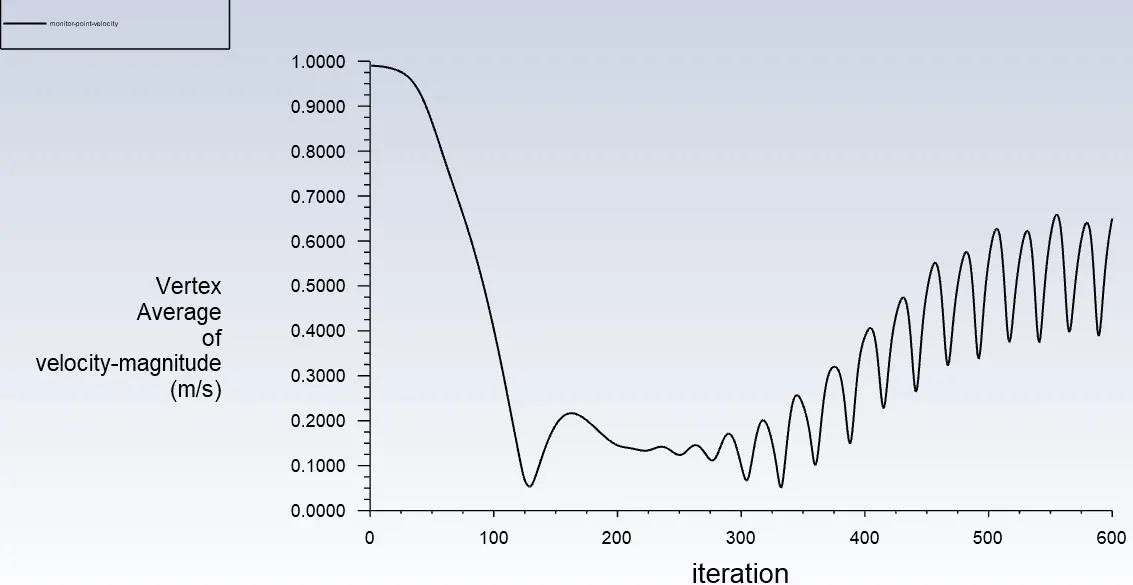
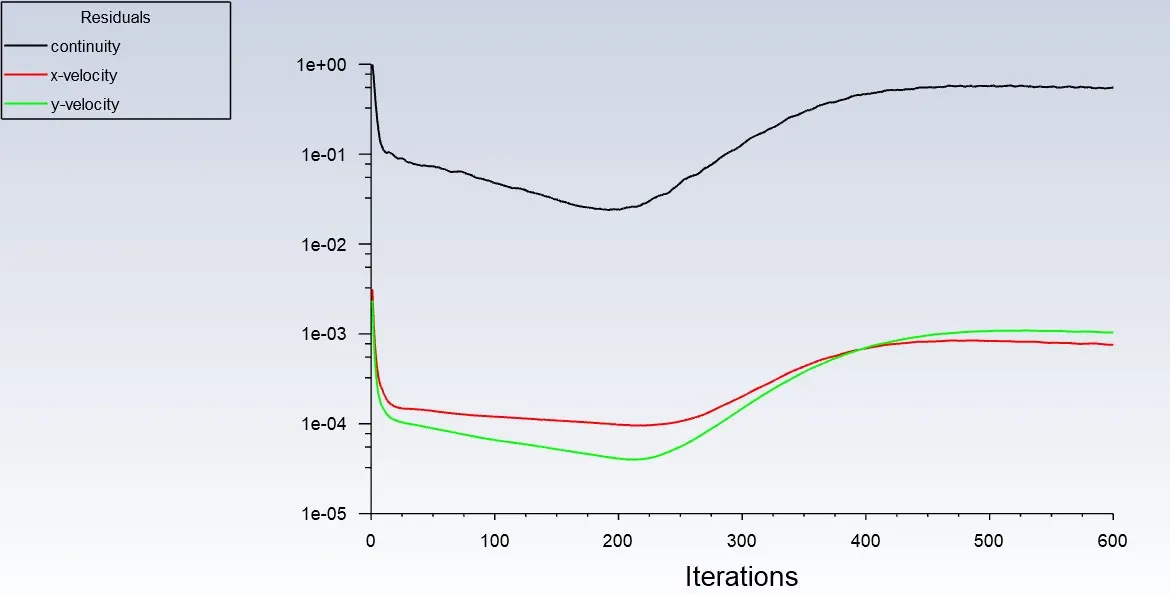
The simulation was run for 600 iterations
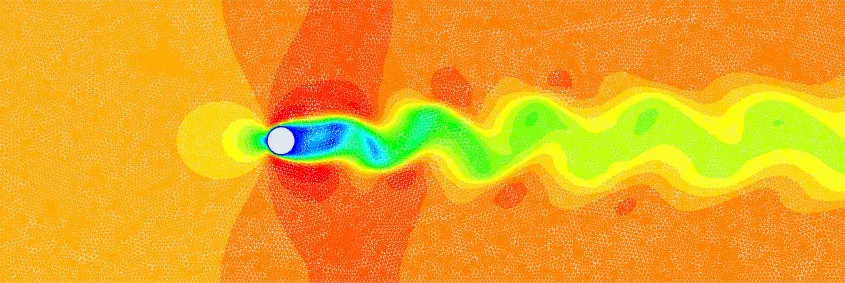
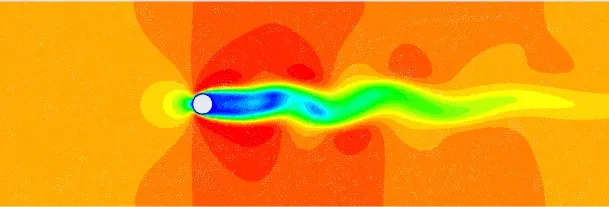
Von Karman vortex street can be observed in this velocity-contour plot.
Contour
A Monitor point was placed on the right side of the cylinder to capture the velocity fluctuations.
Monitor point velocity
Residuals
TRANSIENT CASE
Solution Method
Scheme - SIMPLE
Spatial Discretization
Gradient - Least squares cell-based
Pressure - second order
Momentum - Second-order Upwind
Initialization - Standard Initialization
Time step size - 0.1
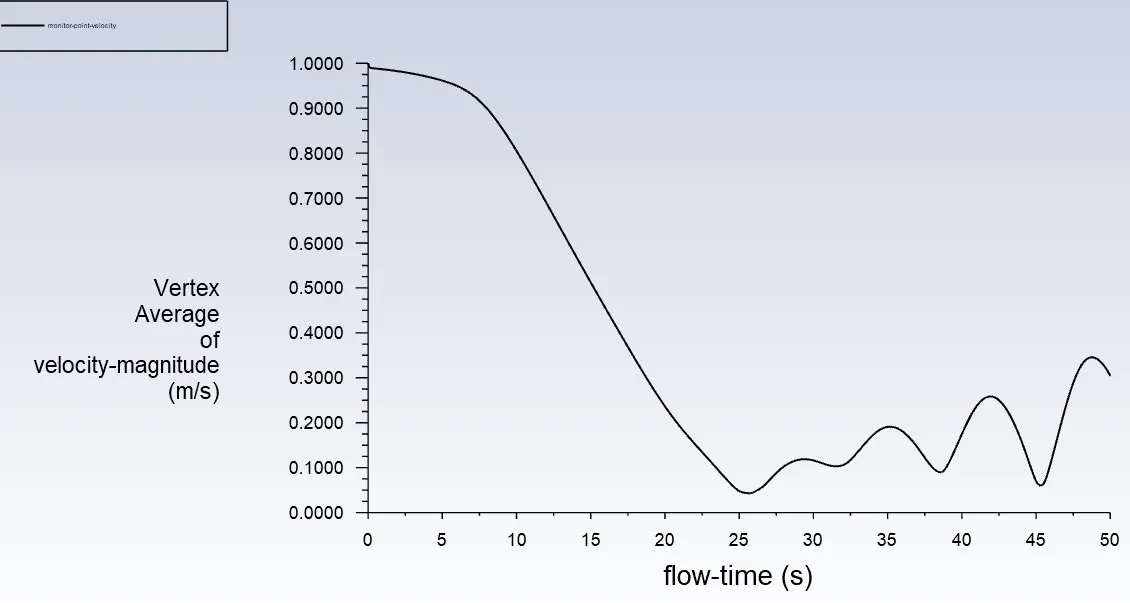
No. of time steps - 500
RESULTS
Number of iterations for convergence - 1000
Contour Plot
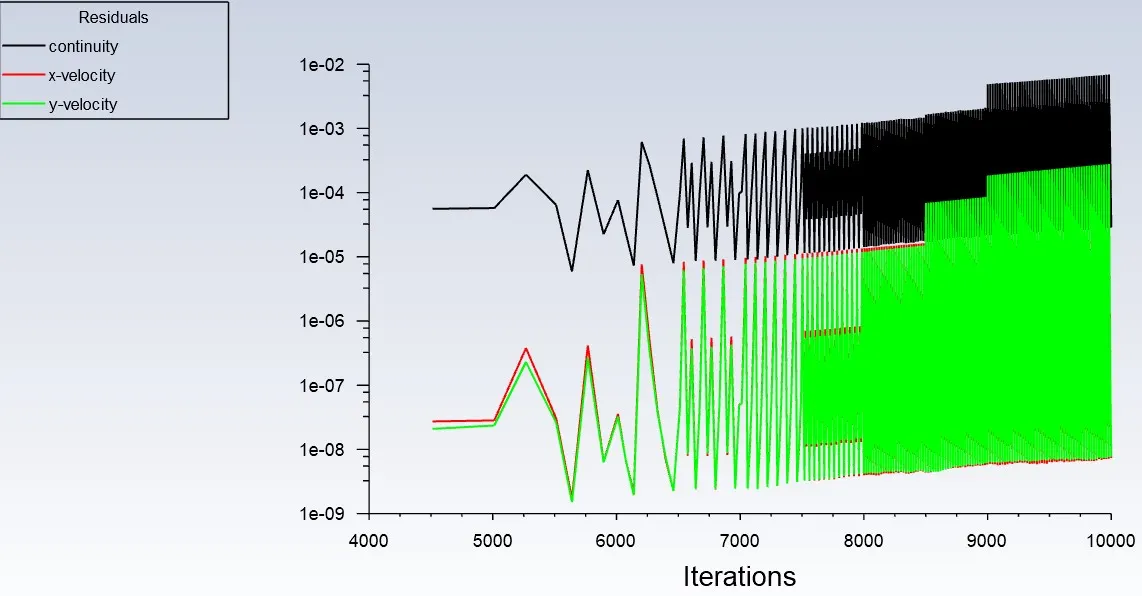
Monitor point Velocity
Residuals
COEFFICIENTS OF DRAG AND LIFT
In this section, Coefficients of drag and lift are calculated for increasing Reynolds number.
The effect of increasing the Reynolds number on drag is also observed for various cases.
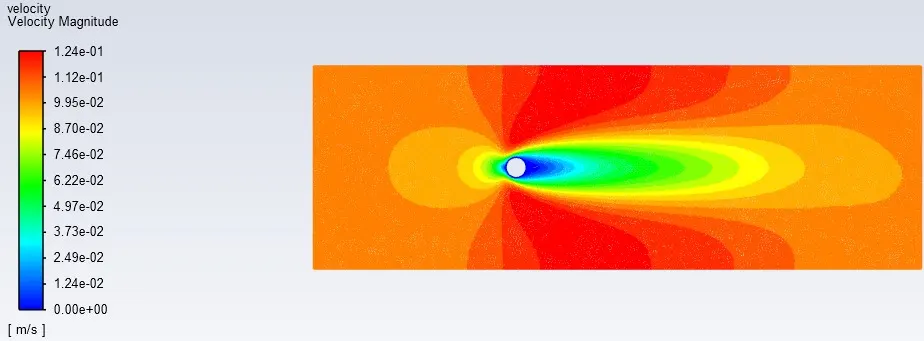
CASE-1) Re = 10
Velocity = 0.1 m/s
VELOCITY CONTOUR
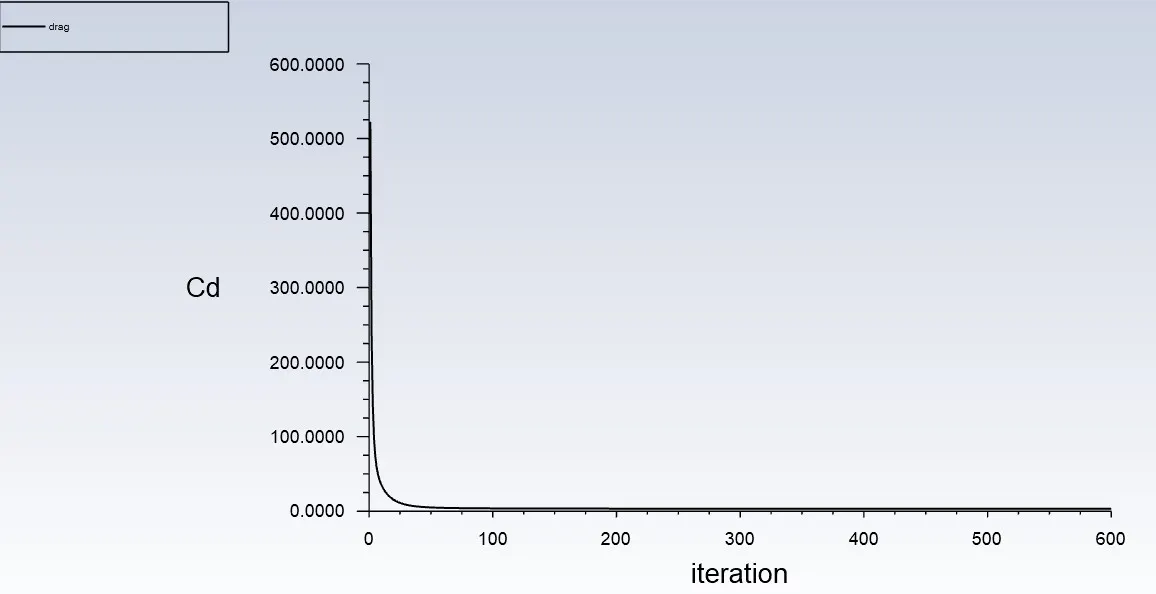
DRAG
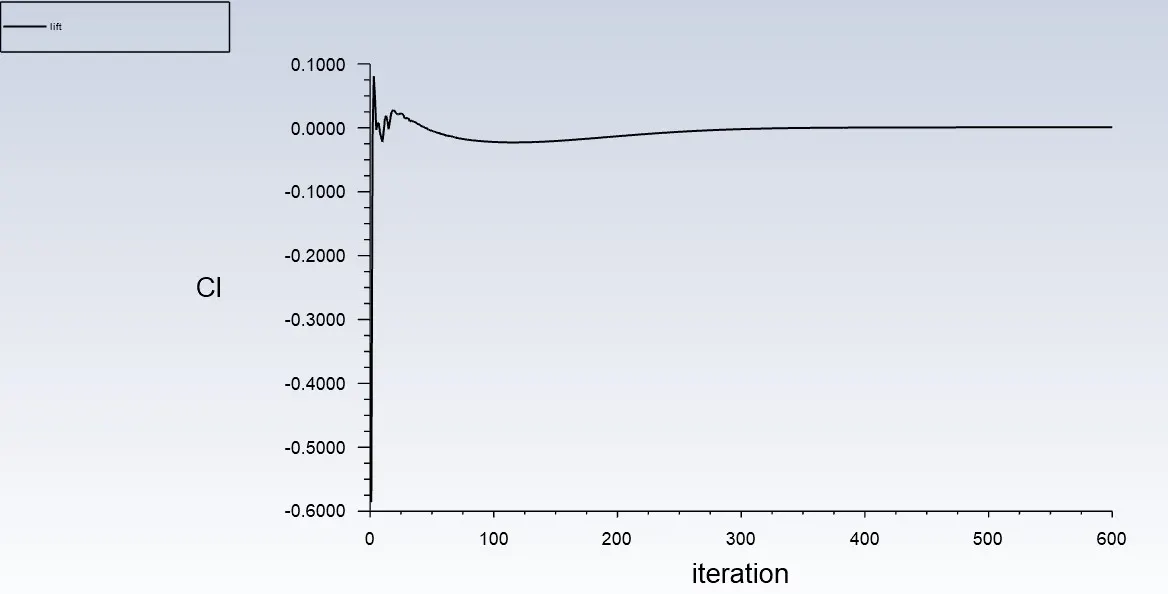
LIFT
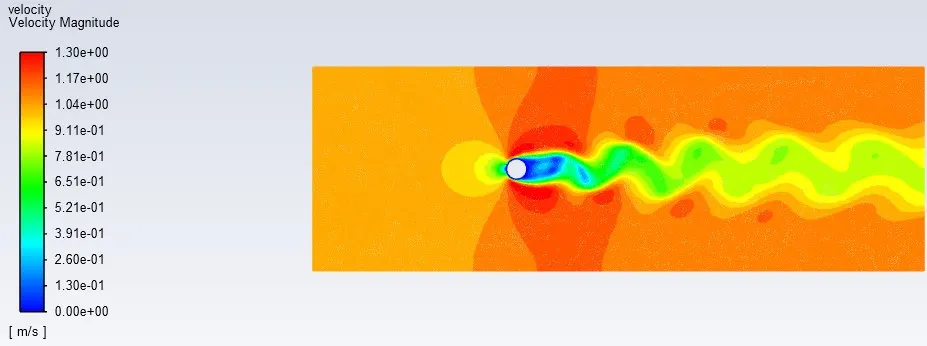
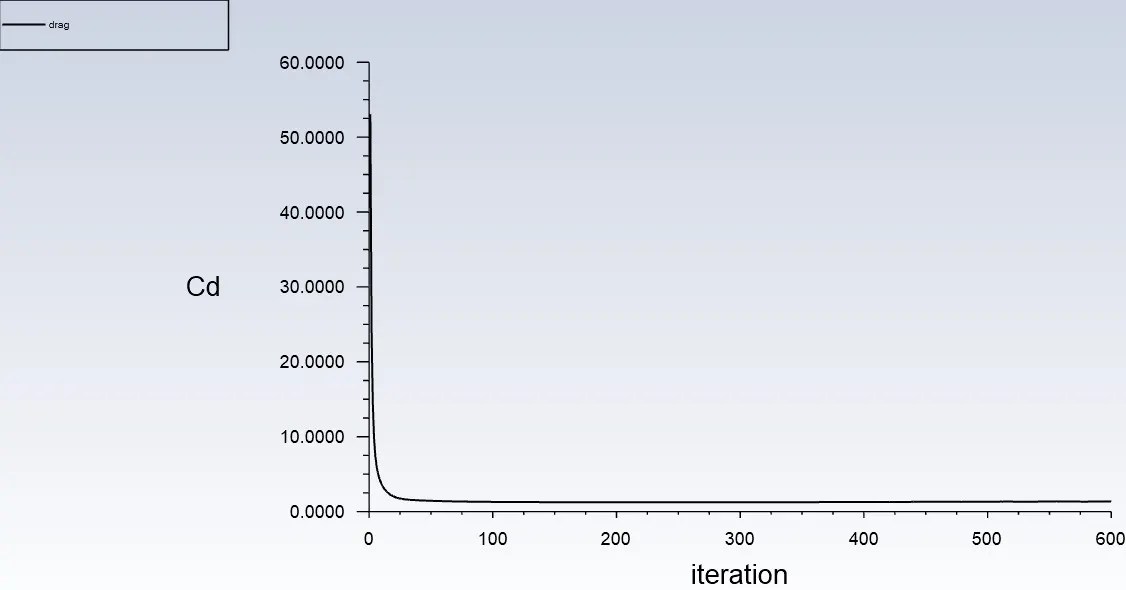
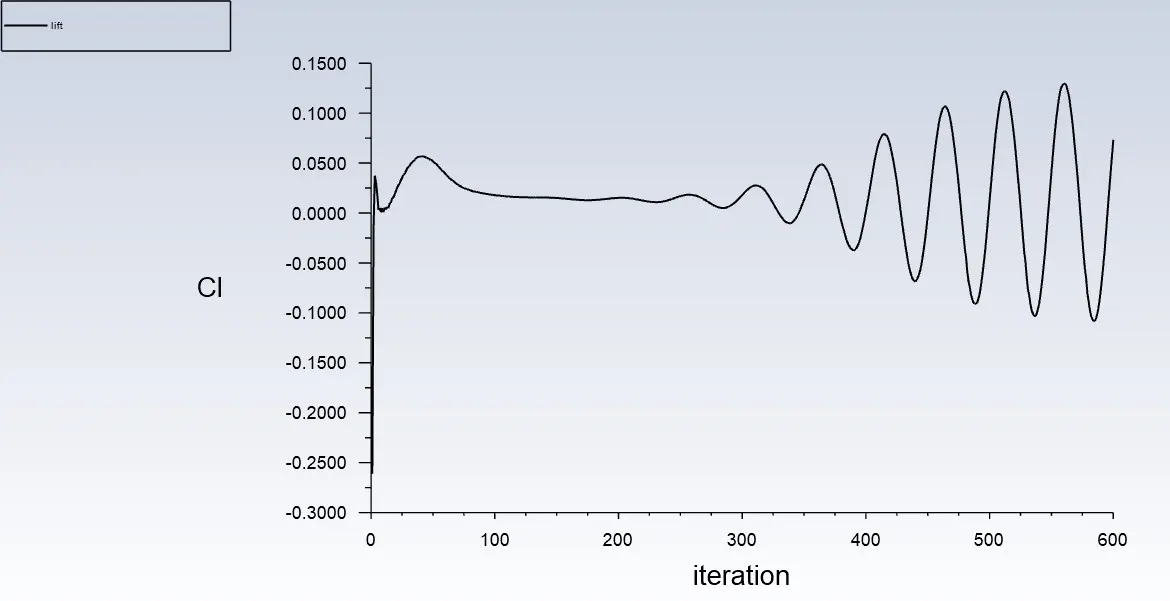
CASE - 2) Re = 100
Velocity = 1m/s
Velocity Contour
DRAG
LIFT
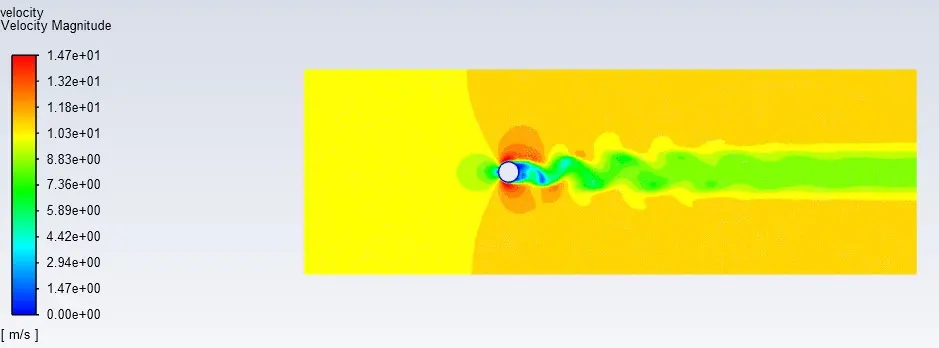
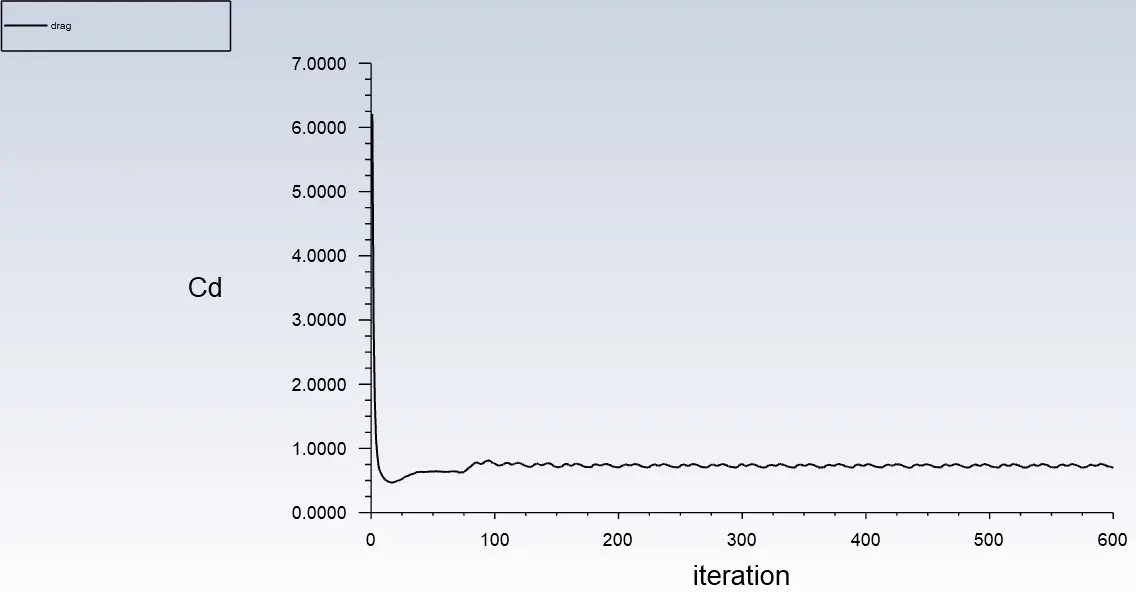
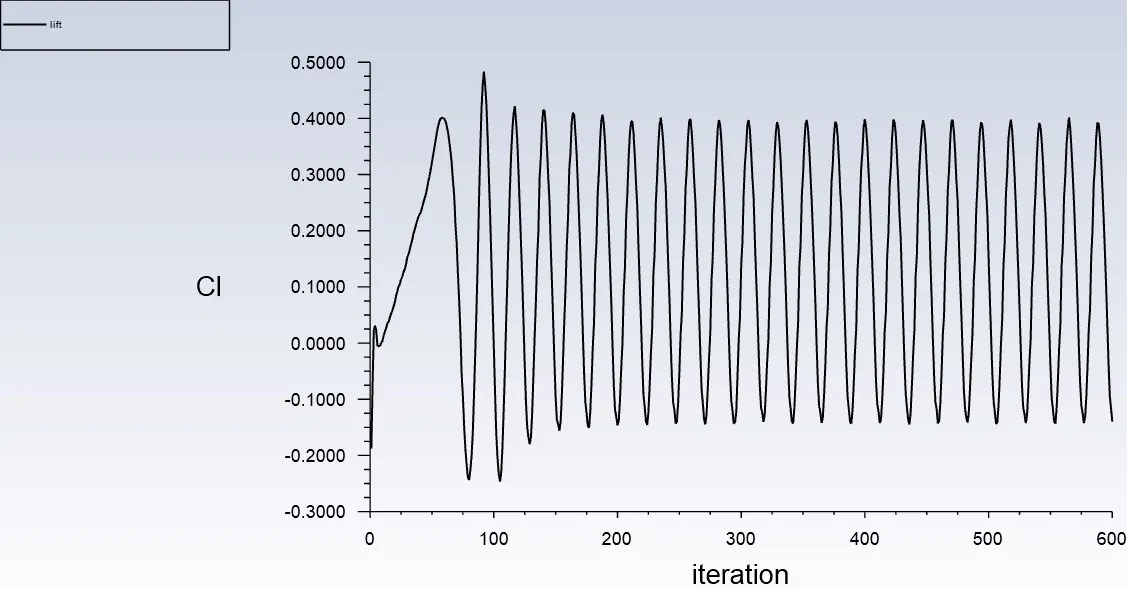
CASE-3) Re = 1000
Velocity = 10
Velocity Contour
DRAG
LIFT
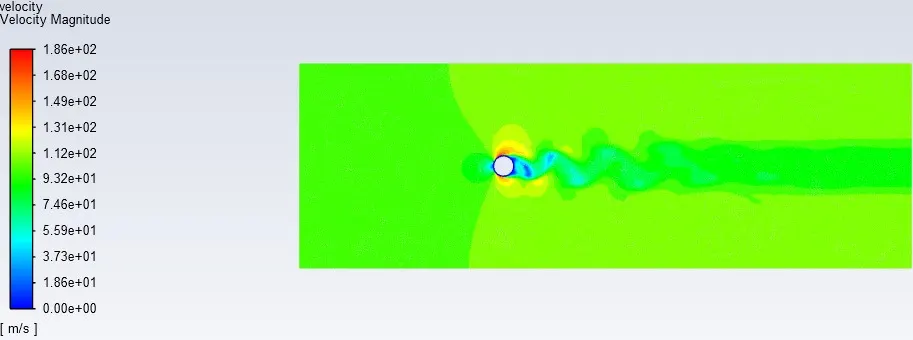
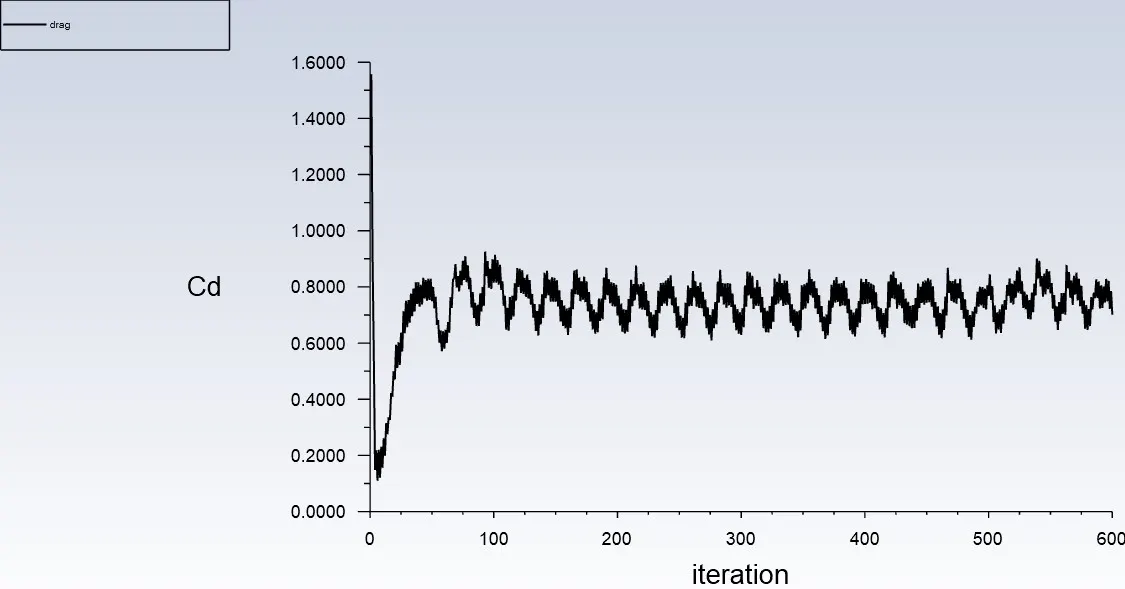
CASE-4) Re = 10000
Velocity = 100
VELOCITY CONTOUR
 .
.
DRAG
LIFT
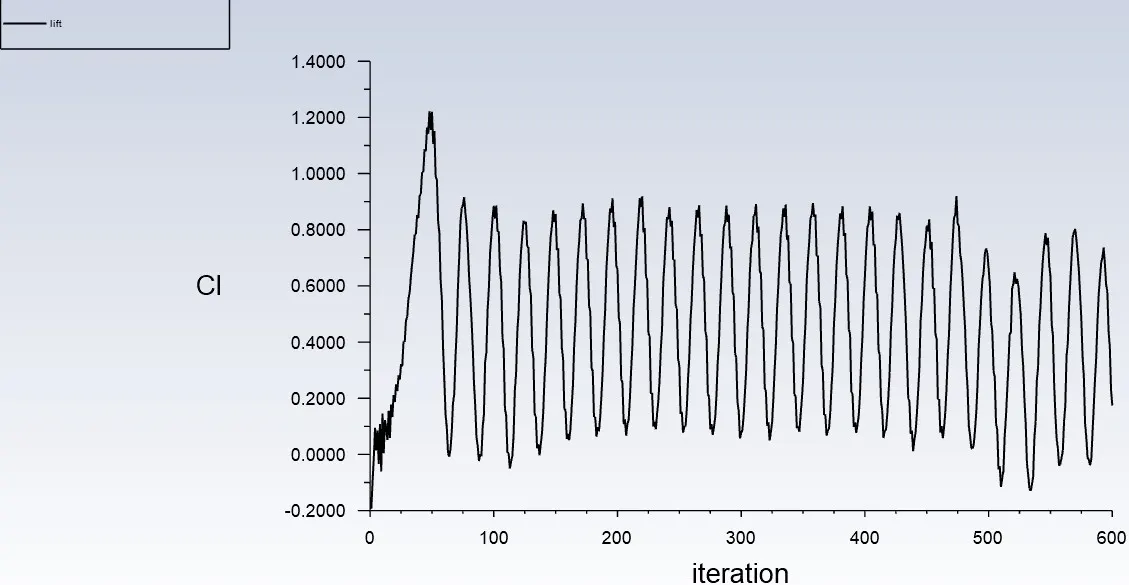
CASE- 5) Re = 100000
Velocity = 1000
VELOCITY CONTOUR
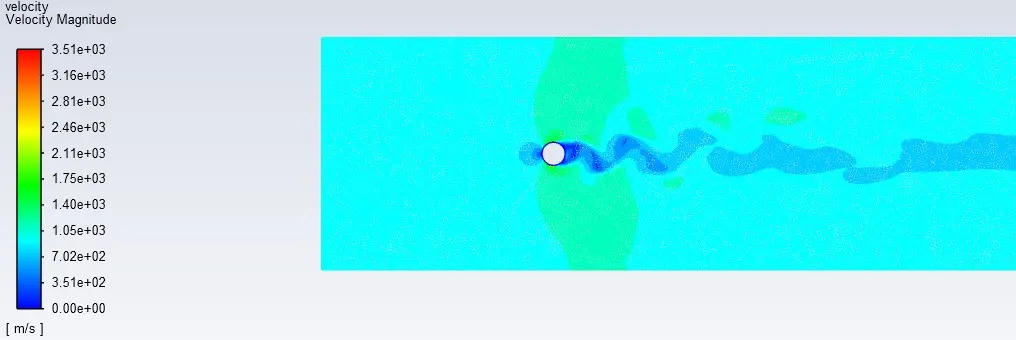
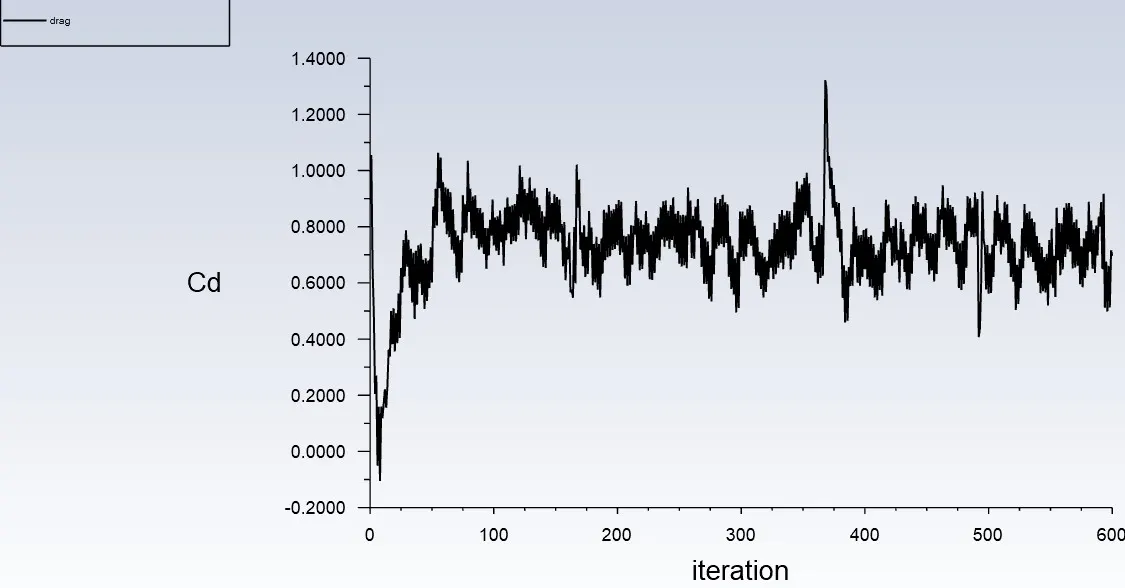
DRAG
LIFT
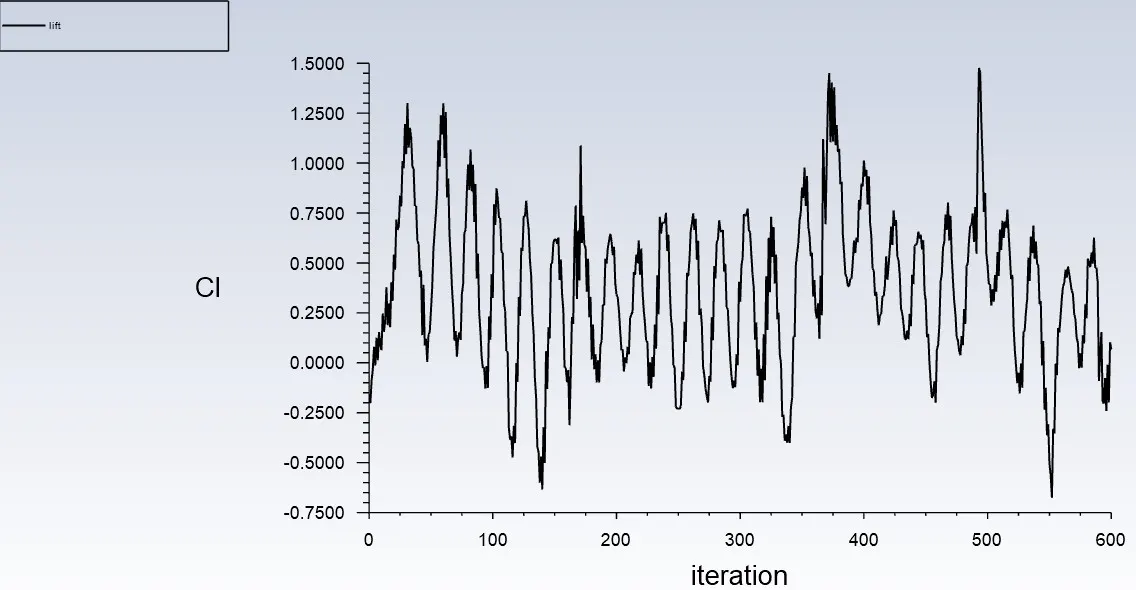
The values of the coefficients of Drag and Lift on the last iteration for different cases are tabulated below.
| S.NO | Reynolds number | Velocity | Density | Viscosity | Dia | Drag | Lift |
| 1 | 10 | 0.1 | 1 | 0.02 | 2 | 3.32 | 0.00104 |
| 2 | 100 | 1 | 1 | 0.02 | 2 | 0.013 | 0.00073 |
| 3 | 1000 | 10 | 1 | 0.02 | 2 | 0.70 | -0.13 |
| 4 | 10000 | 100 | 1 | 0.02 | 2 | 0.7009 | 0.173 |
| 5 | 100000 | 1000 | 1 | 0.02 | 2 | 0.697 | 0.0664 |