Simulation for Frontal crash using Radioss and Hypermesh
AIM
* Simulation for frontal crash using Radioss and Hypercrash.
OBJECTIVES
- Check the unit system and either follow [Mg mm s] or [Kg mm ms].
- Create appropriate interface with friction 0.2 and recommended parameters.
- Make sure of no penetrations and intersection.
- Correctness on rigid bodies if any issues.
- Create rigid wall with friction 0.1.
- Compare the model weight with the full scale 300k nodes model and use added masses to reach target weight 700kg while getting CG about the required range.
- Initial velocity should be assigned as 35 mph.
- Use model checker to ensure good quality.
- Time-step :0.5 to 0.1 microseconds.
- Run 80 ms.
METHODOLY
- Import the model in Hypermesh/ Hypercash.
- Terminate the free parts if it is not possible to connect with the component.
- Assign contact interface, kinematic conditions and boundary conditions.
- Create rigid wall and assign given value for initial velocity.
- Add mass to reach the target weight.
- Create data history for cross sections, accelerometer and intrusions.
- Run the simulation in Radioss workbench and plot the graphs obtained.
CRASHWORTHINESS
Crashworthiness is also highly dependent on how the materials, construction and design of the vehicle work together. From a collision point of view, a vehicle can be considered as two primary kinds of structure. First, there is the passenger cabin, within which the occupants should be belted to the seating. This compartment should represent a ‘safety cage’. Ideally this cage will not distort or deform. Trapping feet with a collapsing firewall or having the roof structure deform onto heads is extremely poor from an injury point of view. Very strong passenger compartments are essential for these safety cages. The present material of choice for primary structural pillars is boron-containing hot stamped steels, which have very high strength and are easily manufacturable. The other important element is the crush zone that surrounds the cabin. This zone is tuned to absorb energy and provide deformation. Crash performance is improved by controlling the acceleration of an occupant’s chest and minimizing a head injury criterion, which is also related to peak rates of acceleration or G-loading. Vehicle safety standards are based on these measures. To receive a 5-star crash rating, a passenger’s chest should receive fewer than 48 Gs of acceleration when a vehicle impacts with a fixed rigid barrier. Therefore, from a design point of view, the crush zone should crush from its original shape to nearly zero thickness in front of the cabin compartment, ideally with a nearly constant force that is no greater than 48 times the vehicle weight while the safety cage remains undeformed. For the deforming members, high strength or stiffness is not desired, but what is important is the ability to absorb energy in a controlled manner and the ability to crush the full distance from the bumper to cabin, while the force remain near the peak value it maximizes the energy absorbed. Governmental regulation impose strict standards on occupant protection, and on various crash modes including side impact and roof crush. The mass of vehicles could be dramatically reduced if crashworthiness were not a consideration. This is part of the long-term potential promise of computer-driven autonomous vehicles. If the chance of vehicle collision is driven to nearly zero by fail-safe robot operators, then much lighter, non-crashworthy vehicles could be built.
REQUIREMENTS OF CRASHWORTHINESS
The body structure includes various crush zones to absorb part of the kinetic energy. The vehicle should crumple on impact so that it doesn’t come to a sudden stop. Vehicles maintain the integrity of the passenger compartment and simultaneously control the impact of the crash. Accident reconstruction and analysis of vehicle crashes provide information regarding the safety performance. Crash test is done on four different modes: frontal, side, rollover and rear crashes. It is conducted under rigorous standards. Each crash test is very expensive so it is of paramount importance to collect maximum data from each test.
FRONTAL CRASH
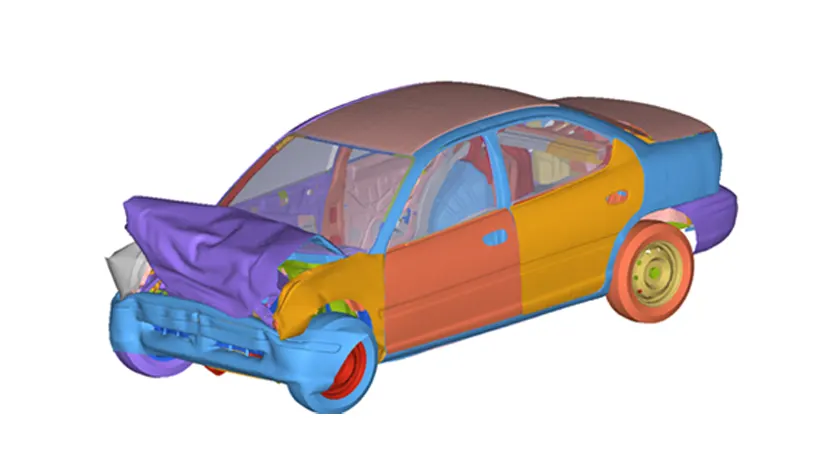
To minimize the injury of car occupants during a frontal crash not only the restraint system must be optimized, but also the crash pulse generated by the vehicle structure. It is clear that a low velocity crash with full overlap requires less structure stiffness than a high velocity offset crash. Ideally for each serious crash situation the whole available deformation length must be used and all the impact energy mustbe absorbed without deforming the passenger compartment. For compatibility it is necessary to have a stiffer structure in case of a heavy opponent and a softer structure in case of a lighter opponent. This paper discusses possibilities to design an adaptive vehicle structure that can change the stiffness real time for optimal energy absorption in different crash situations. Besides that all the energy is absorbed it is also important to manage the intensity during the crash time, because the resulting crash pulse has a large influence on the injury level. Especially at high crash velocities a stiff structure in the first phase of the crash followed by a softer part is effective but difficult to realize with traditional structures.
PROCEDURE
* Open the model in Hypercrash by importing the given rad file.
* Run the model checker for connectivity and terminate free parts if present.
* Make sure the free parts are not acting as a necessary component in the model or else appropriate connection should be given to the particular component.
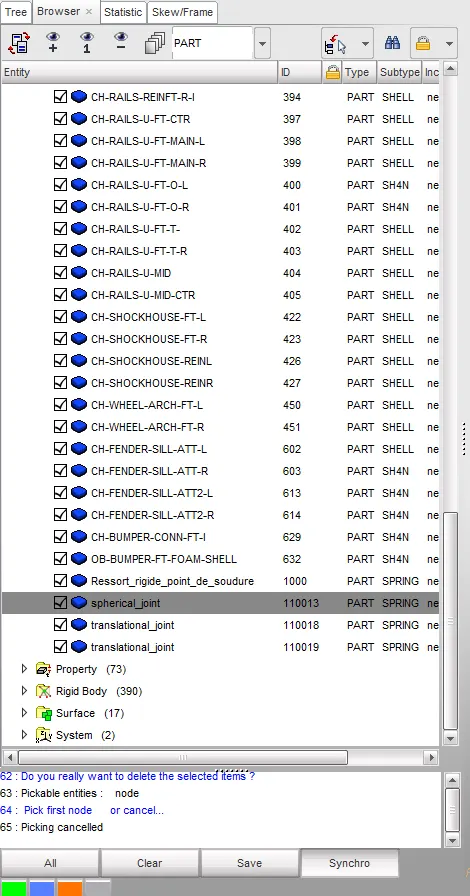
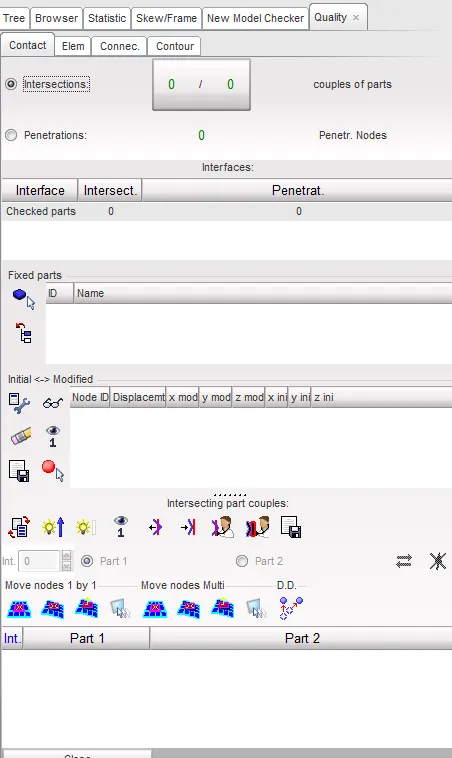
* Check for penetrations and intersections using quality check in Hypercrash because presence of any sort of penetrations or intersections leads to wrong result.
* The model is free of penetrations and intersections as shown below.
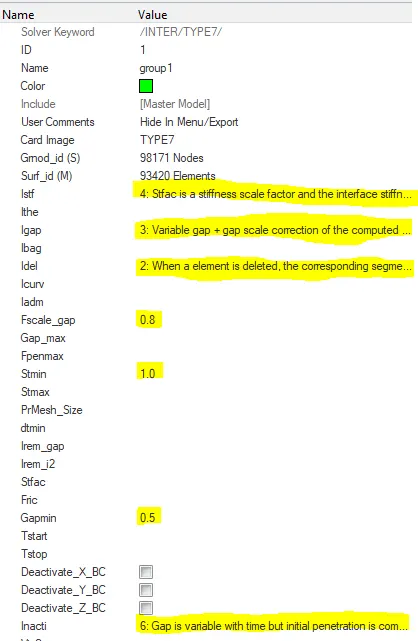
* Introducing type 7 interface in a group for all the components.
* The recommended parameters for type 7 are assigned as shown below.
* Determine the nodes and elements in interface by masking all the 1D elements.
Rigid Wall
* Rigid walls allows for an easy way to define an interface between a rigid surface and nodes of a deformable body.
* A rigid wall is defined as surface type and a group of slave nodes. Each wall can be fixed or moving and is a kinematic condition.
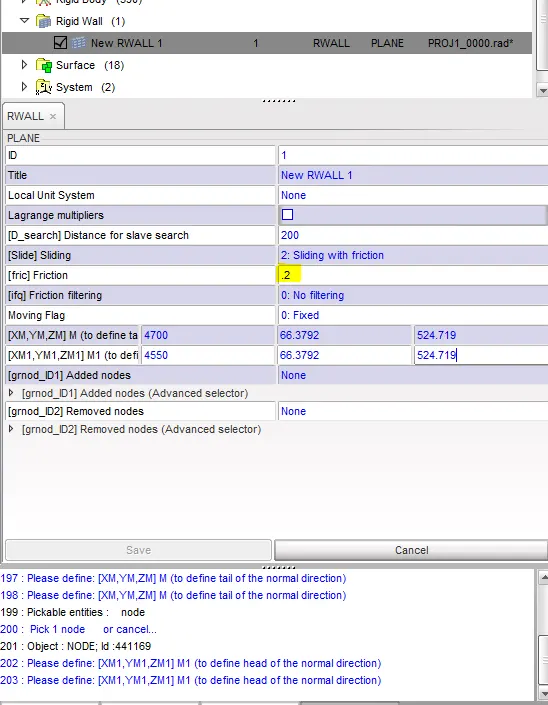
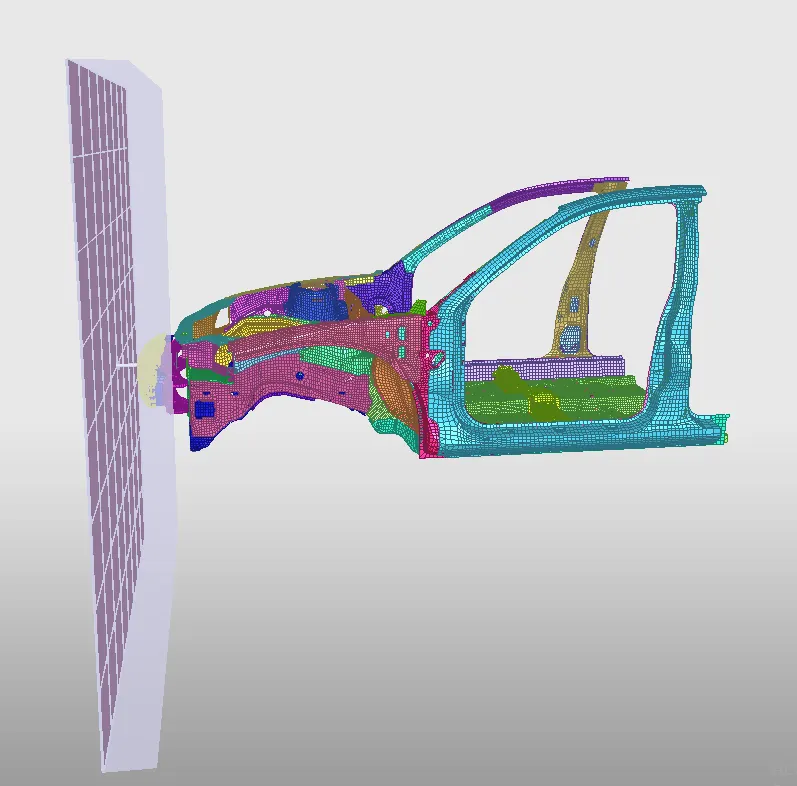
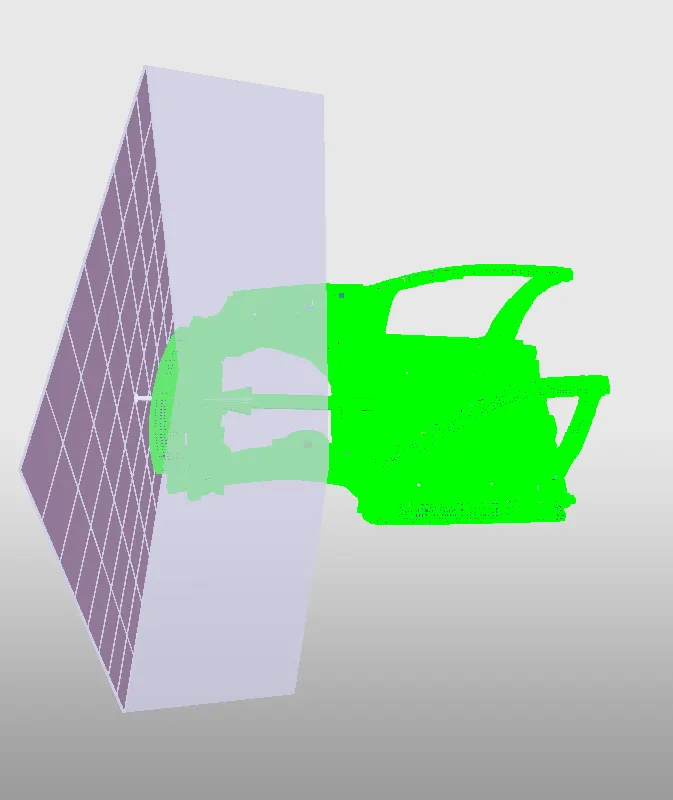
* The model is imported in Hypercrash and the Rigid wall with the given friction is created as shown below.
COG
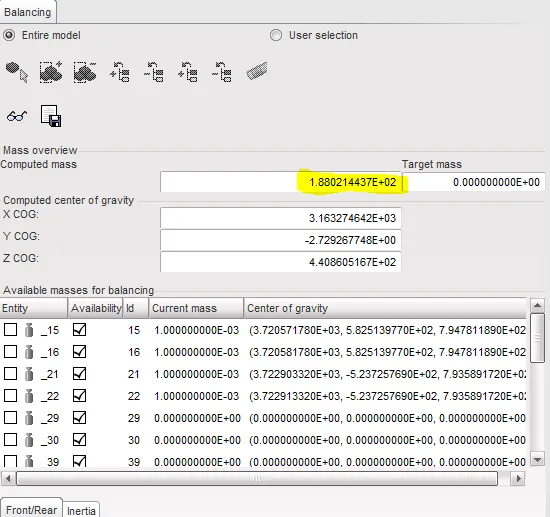
* Considering the total mass of the vehicle, it has to be balanced with the given reference model.
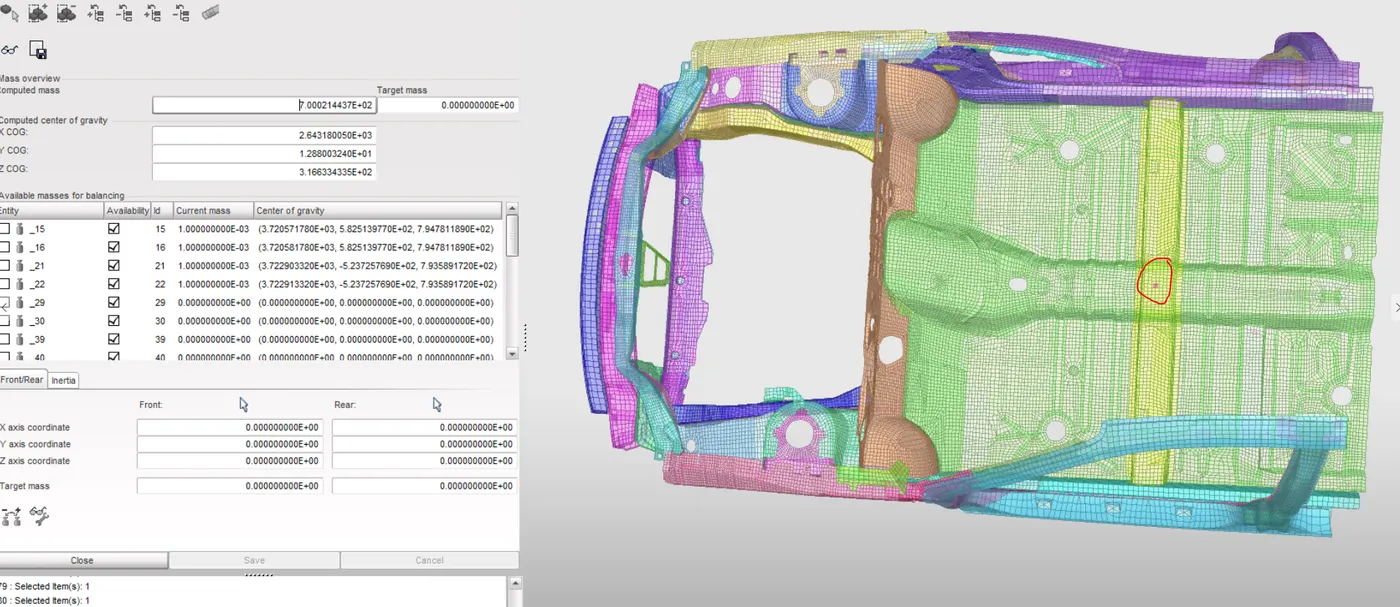
* In addition of mass, added mass is used from Load case in Hypercrash and the weight is balanced by giving additional masses to defferent nodes in the model and the target
* The addition of mass is given in that way to make the COG falls in the middle of the car as shown below.
Initial Velocity
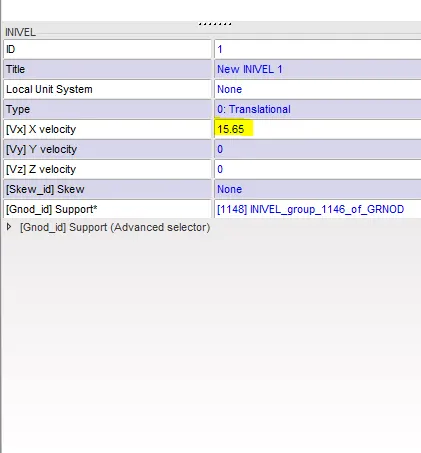
* Initial velocity defines an initial velocity on a group of nodes and no function is required in this case but the velocity in X,Y Z directions should be assigned.
* The initial velocity is given as 35 mph and since different unit system is followed here it is converted and assigned as 15.65 in the initial velocity card as shown below.
* The direction is given as X axis because hereby it is assumed that the vehicle is approaching to the rigid wall at the given speed following the global coordinates.
CROSS SECTIONS
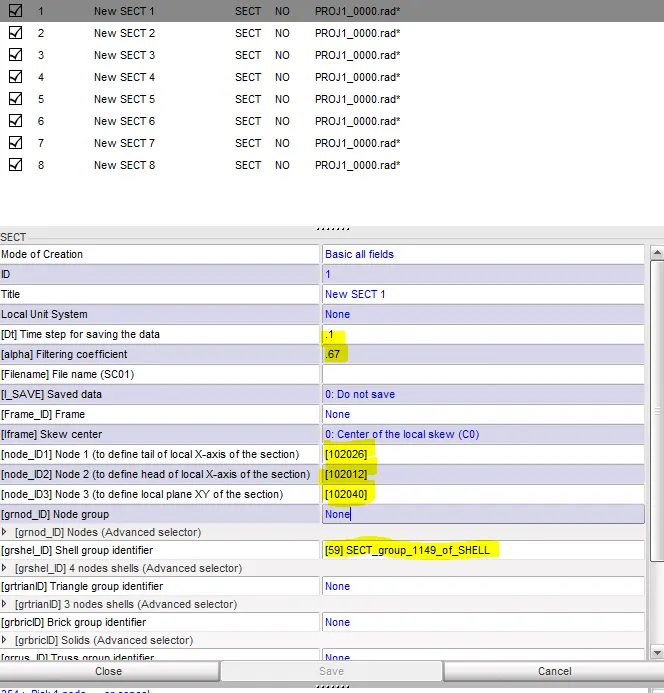
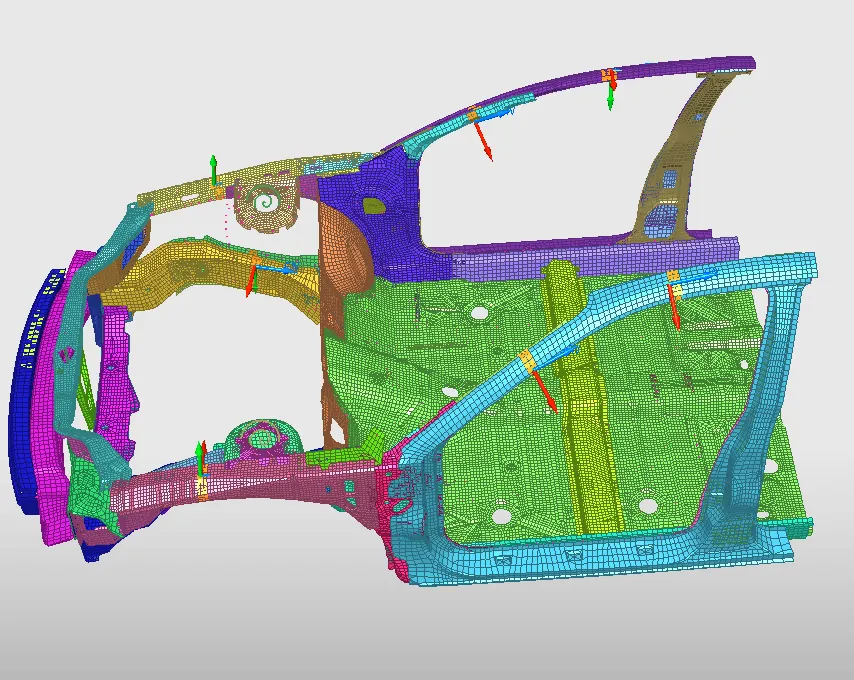
* Cross sections are created in A pillars shotgun and rails as per the question and it is shown below.
* A local coordinate is introduced to the cross section with the help of skew.
* Time step is given as 0.1 here to capture all the data related to the force acting at the particular section in a specified time frame and the filter coefficient is given as 0.67.
ACCELEROMETER
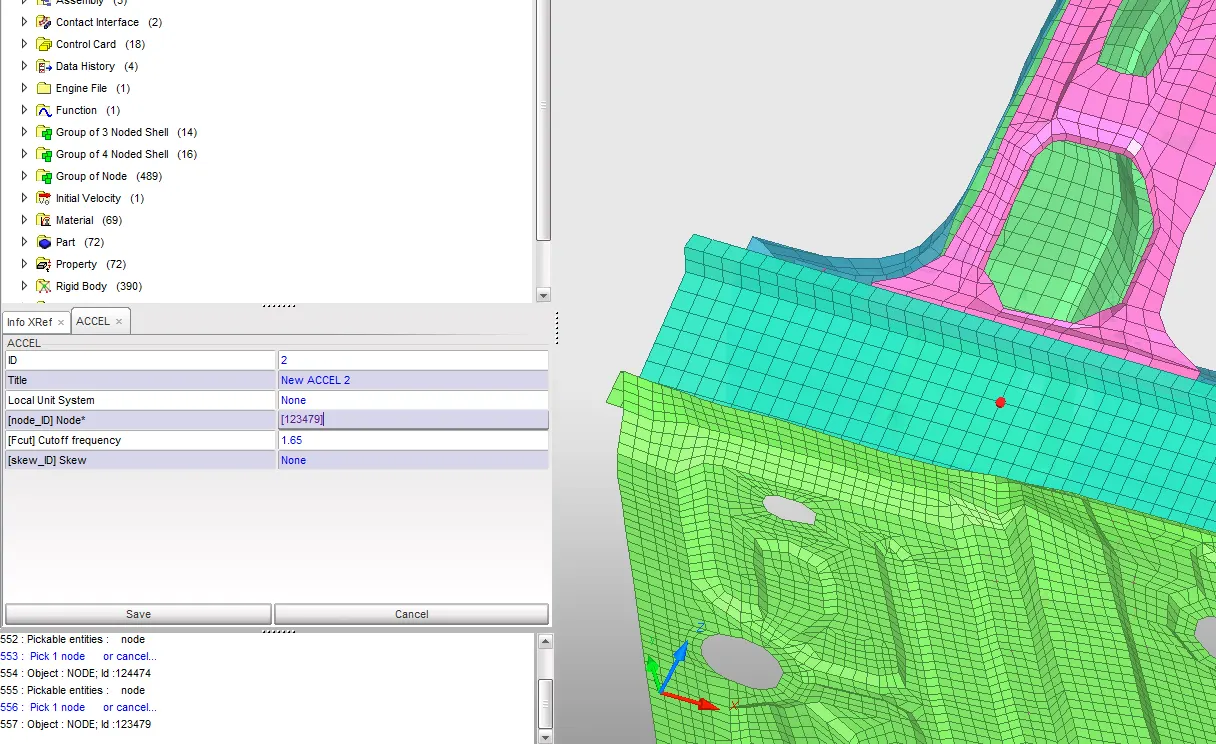
* Accelerometers can be used to measure vibration on cars and they can also be used to measure seismic activity, inclination, dynamic distance and speed with or without the influence of gravity.
* Accelerometers are introduced near to the B Pillar at both sides to get the acceleration at the particular nodes selected in the model.
AXIAL FORCE
*A stress that tends to change the length of a body. Compressive stress is axial stress that tends to cause a body to become shorter along the direction of applied force. Tensile stress is axial stress that tends to cause a body to become longer along the direction of applied force.
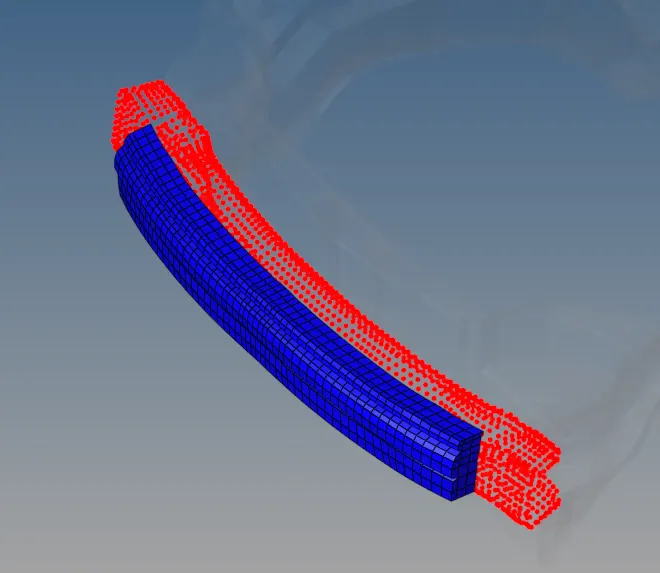
* Hereby as per the question the axial force acting on the rail from bumper should be calculated and inorder to calculate force in the rail member a Type 7 contact interface is introduced where the slave node and master suface should be determined.
* In this case the rail acts as a slave and the bumper as a master because the force should be calculated on the rail transferred from bumper.
OUTPUT REQUEST
*Introducing the output request for gathering all datas and graphical representations at certain areas in the BIW model to analyse the variation of forces and displacements in different nodes throughout the simulation.
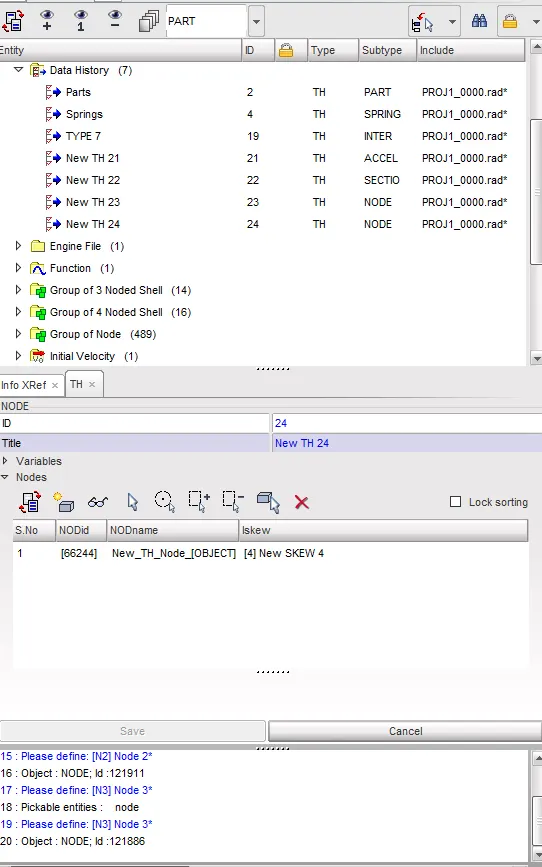
* In Hypercrash create new files in data history to generate outputs for the cross sections, acceleration and intrusions of nodes.
FRAME
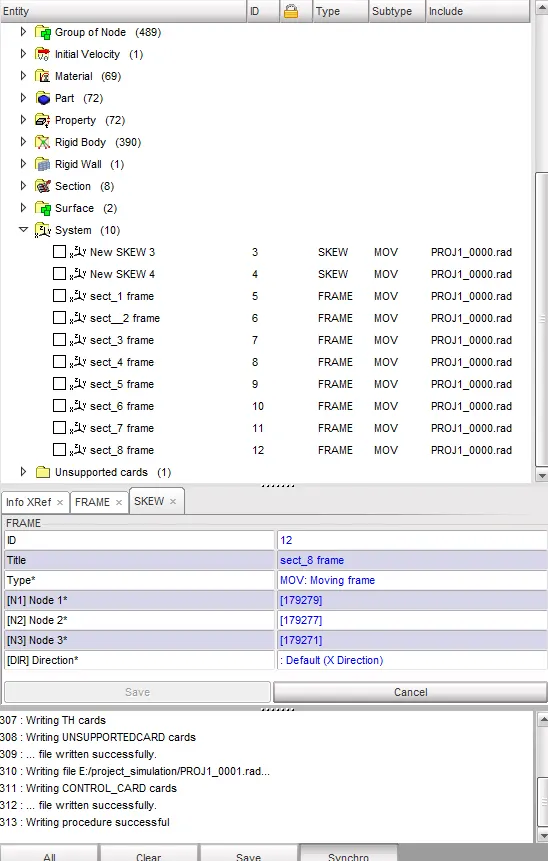
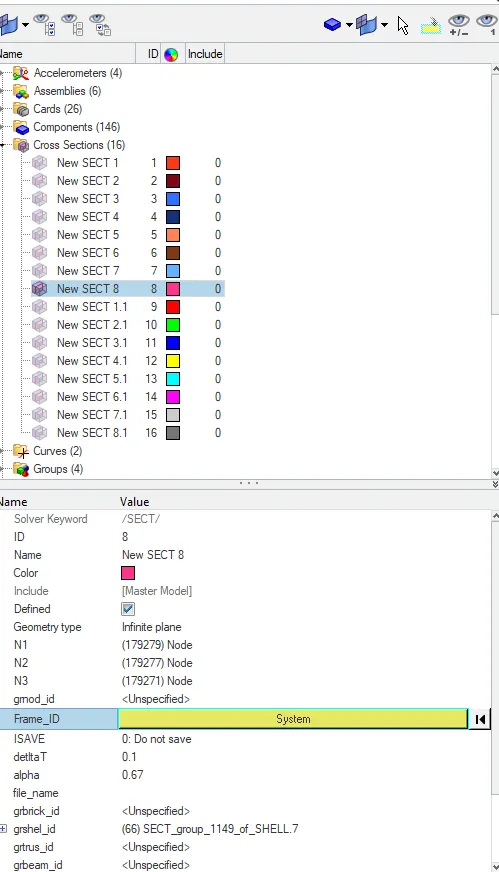
* The frame is created each and every cross sections created throughout the model and the Frame ID generated is referred in the section card in Hypermesh and it is shown below.
* In Hypermesh the section card allows to define the frame ID and the referred frame to the particular section is selected through Systems as shown below.
Time step & Model Checker
* The time step is assigned as 0.00051 milli second in the DT file in data history and the final simulation time is 80ms.
* The model checker helps in showing up the errors and warnings before running the simulation.
OUT FILE
* The out file genberated is as follows
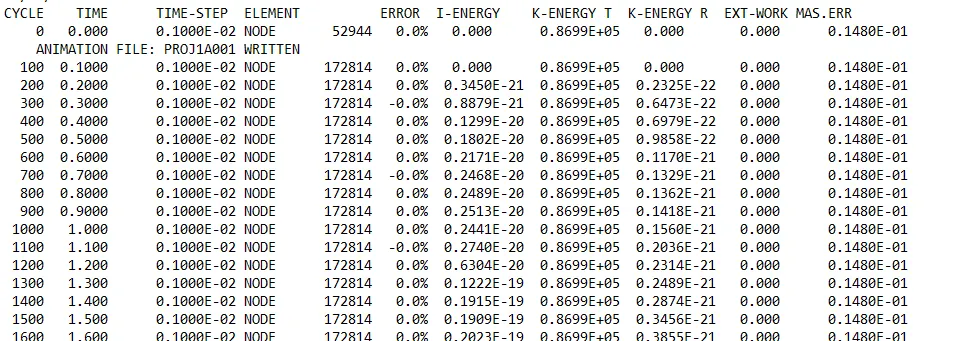
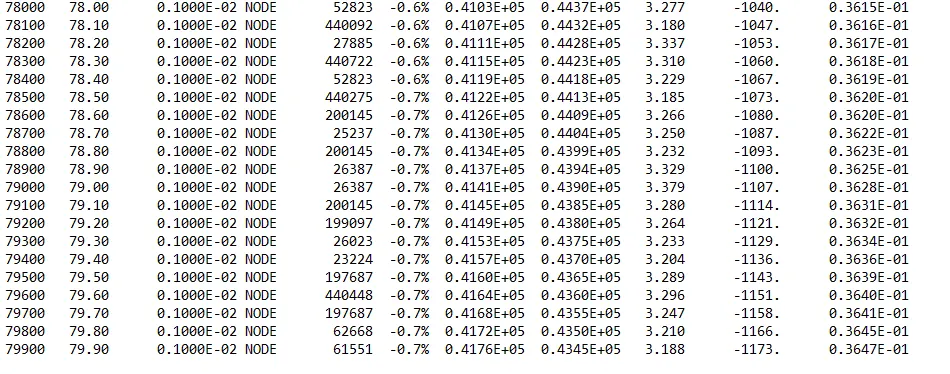
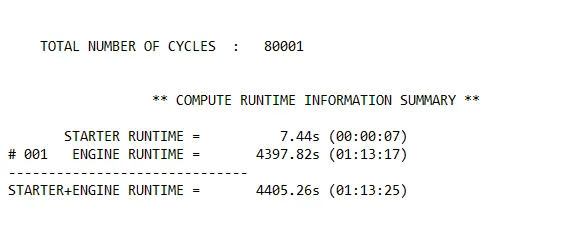
* The standard energy error percentage is between +5 and -15 and in this simulation the energy error percentage is noted as -0.7 which is within the acceptable range.
* The mass error percentage is noted as 0.0365 which is less than 1% and so the simulation is stable.
Animation Output
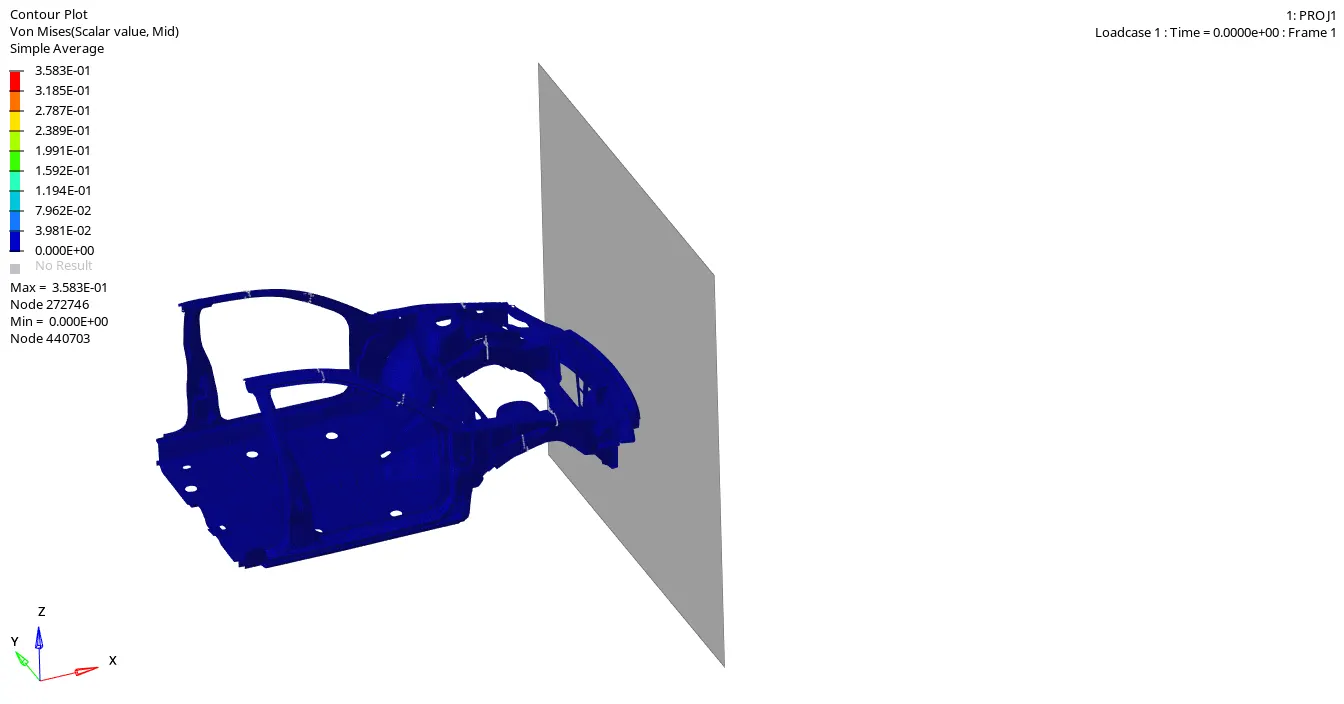
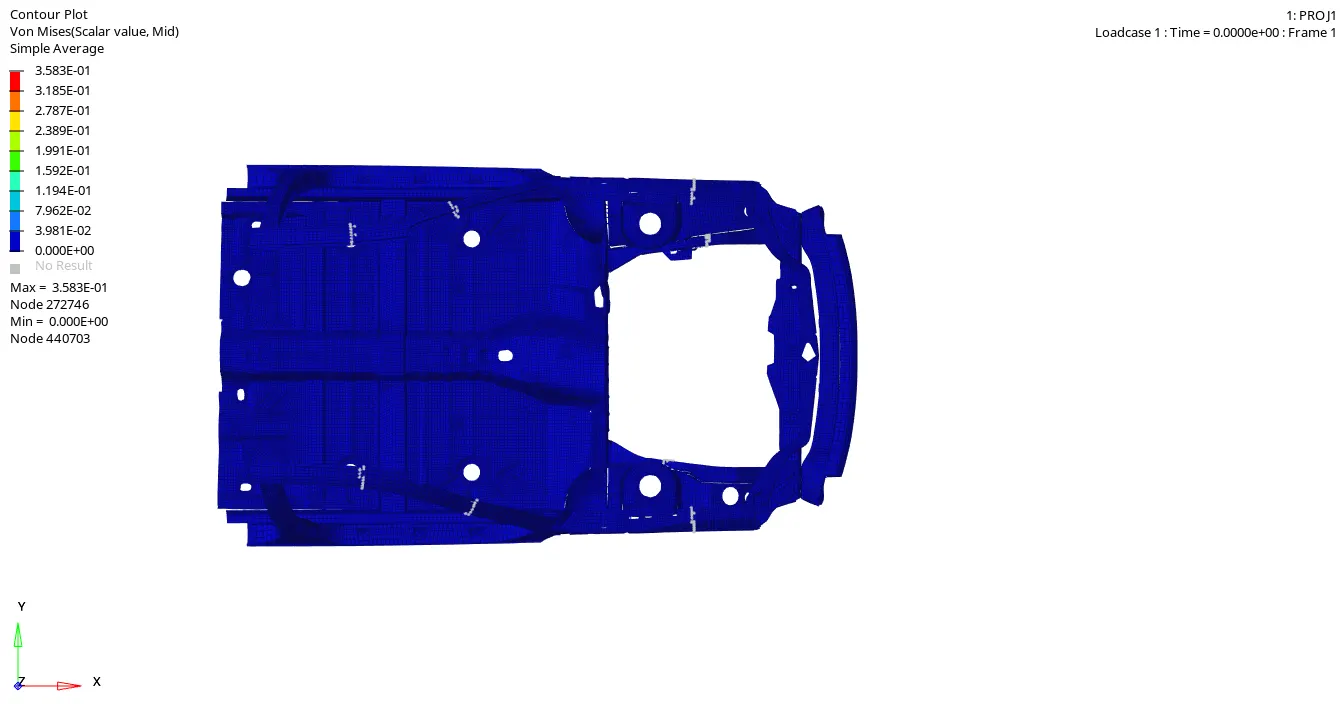
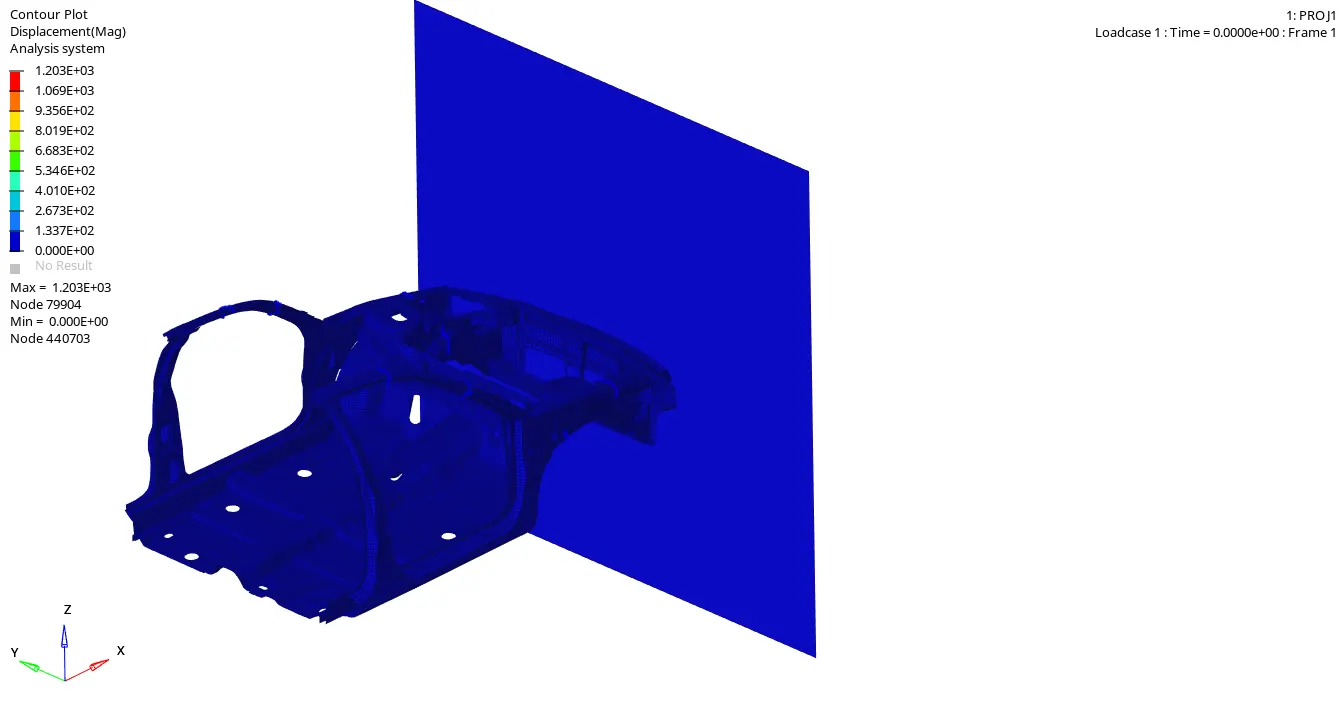
* Animation file is generated with the help of Hyperview workbench in Radioss.In this case as the bumper comes in contact with the rigid wall, it starts absorbing energy and transfers to the rail followed by shotgun and A pillar. Whereas there is an energy flow going towards the cabin of the car effecting the floor panel elements. The effect on the mid chassis can be avoided by introducing a multi node rigid connection in the centre portion of the model.
*On analysing the animation video, the bumper, rail and shotgun starts absorbing energy in a large amount and gets deformed in the starting stage of simulation and it seems like the left shotgun is absorbing more energy compared to the RHS shotgun.
*During the simulation on front crash, the parts starts deforming and it gets teared on reality.
ENERGY PLOTS
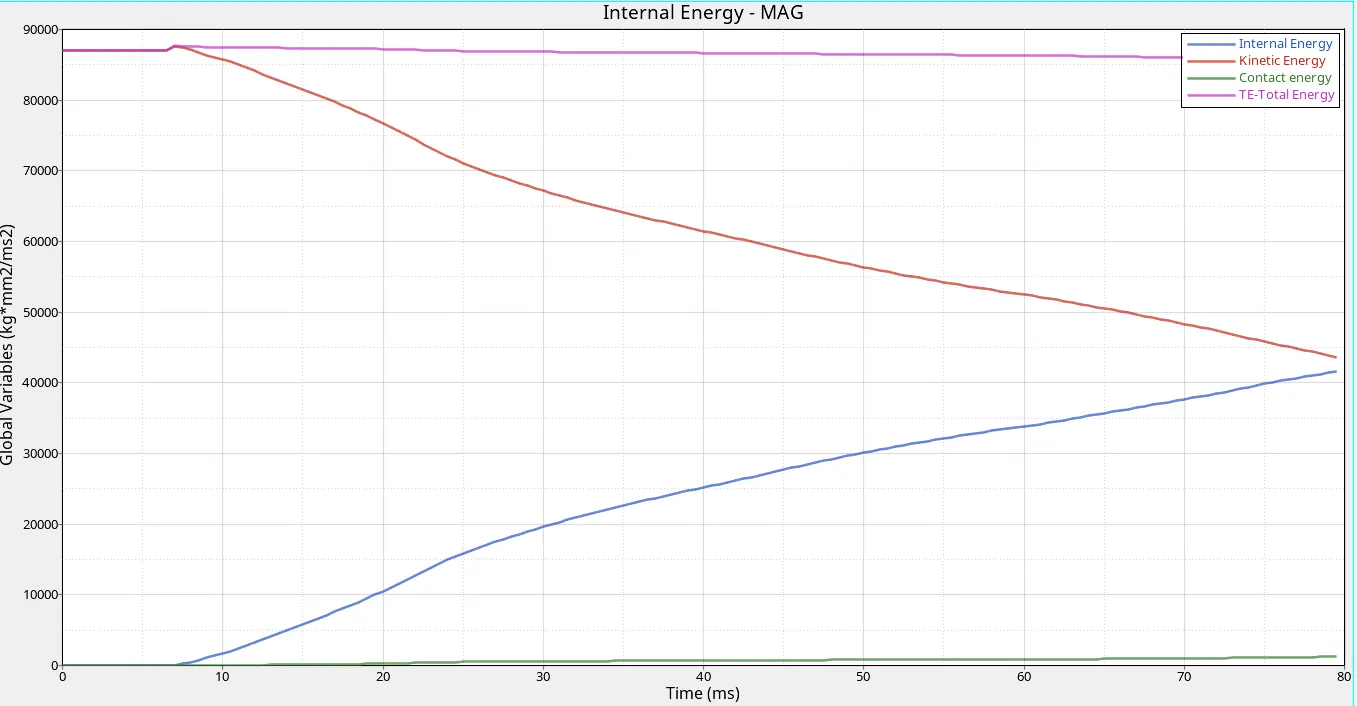
* On studying the graph the internal energy increases throughout the simulation whereas the kinetic energy decreases as both energy is in equilibrium.
* The contact energy seems stable because on crashing the absorption of energy and deformation takes place part by part and therefore the contact energy that is the energy created in the master side and the slave side follows a flatten curve throughout the simulation.
CROSS SECTIONAL FORCES
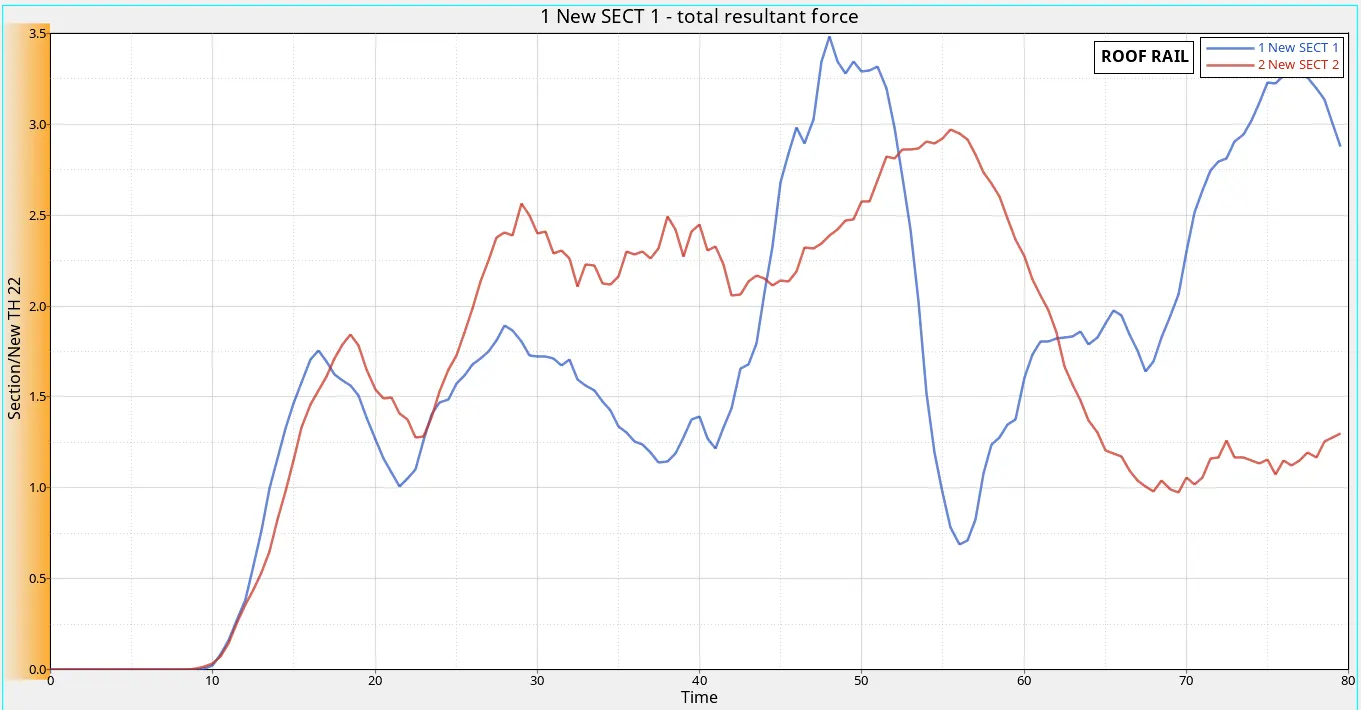
* Above graph represents the resultant force acting on the cross section created on the LH & RH roof rail in the BIW model. A maximum force of 3.84 KN is noted in the LH roof rail and 2.97 KN in RH roof rail.
* The LH rail is recieving more force because as per the animated video more absorption of energy and deformation takes place in LH parts of the model which leads to an increase in force acting in the LH cross section of roof rail.
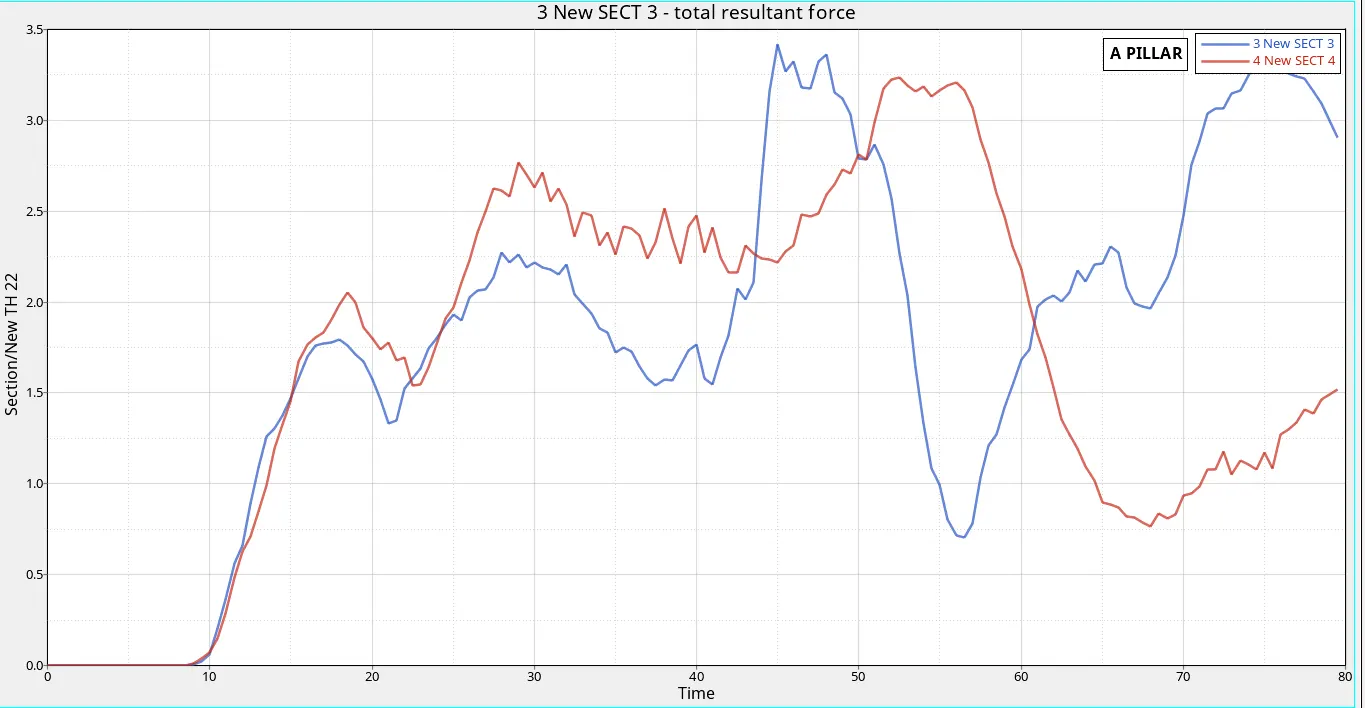
* The maximum force acting in A pillar on LH side of the model is noted as 3.42 KN whereas the max force acting on RH A pillar is 3.23 KN.
* As per the above explanation the LH A pillar is recieving more force compared to the RH side.
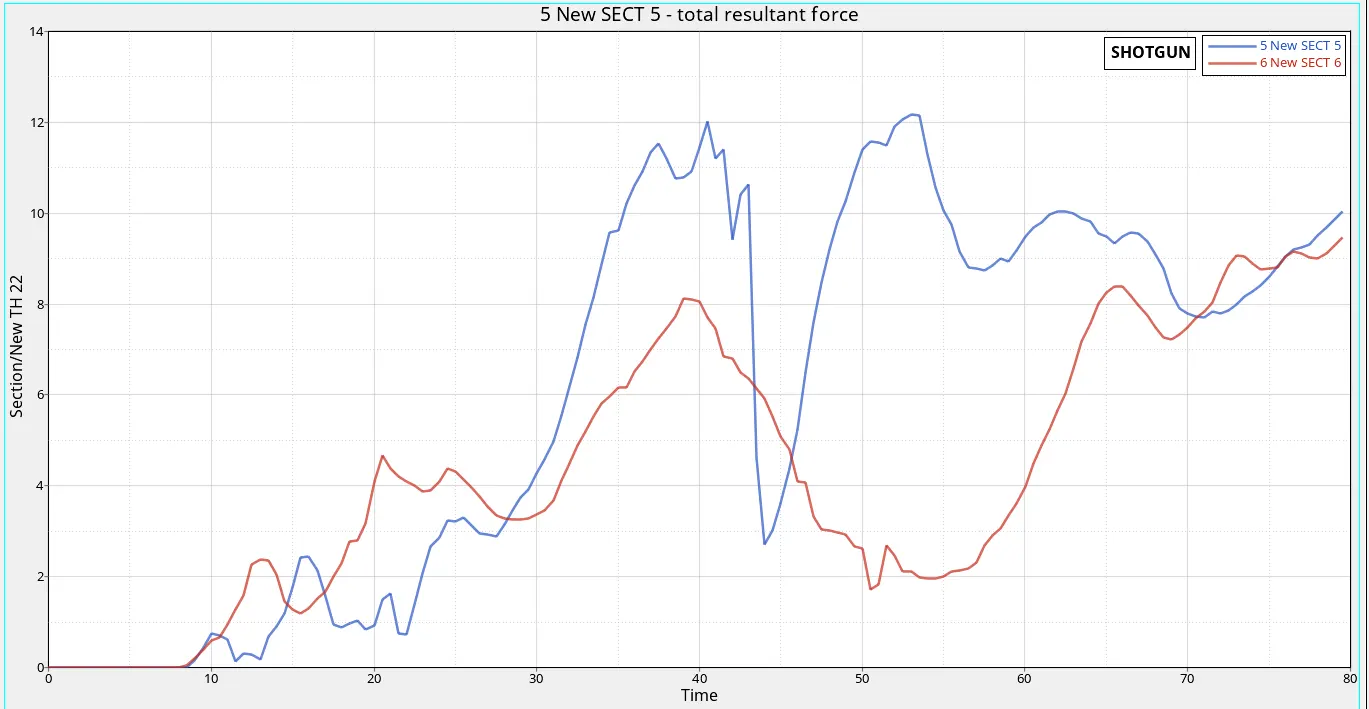
* A maximum force of 12.16 KN is acting on the LH shotgun whereas a force of 9.46 KN is acting on the RH shotgun. The force acting on the cross sections of shotgun is more compared to the cross section in A pillar because since it is in close proximity to rigid wall the absorption of energy will be more in shotgun which also results in large deformation.
* After 25ms the force acting increases abruptly as the bumper and rail is already in a deformed in that stage and tends to transfer large amount of force to shotgun due to the kinetic energy which leads to a sudden increase in force.
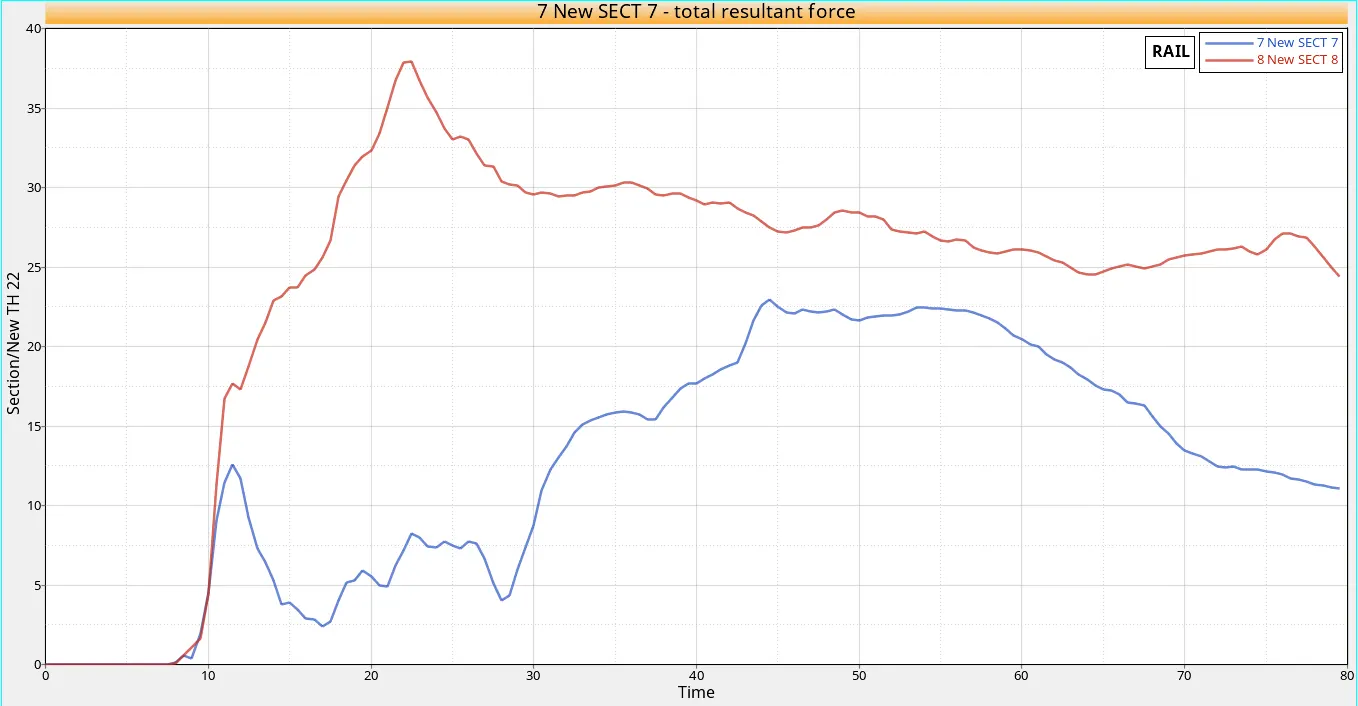
*At 10ms the force acting on rail starts due to the crash and there is sudden increase in force acting LH rail compared to the RH. It is because as shown in the animation video more absorption of energy and deformation is taken place in the LH side and so the cross section of RH rail is less affected compared to the LH rail.
* The maximum force acting on the LH rail is noted as 37.93 KN whereas the force on RH rail is recorded as 22.96 KN.
AXIAL FORCE
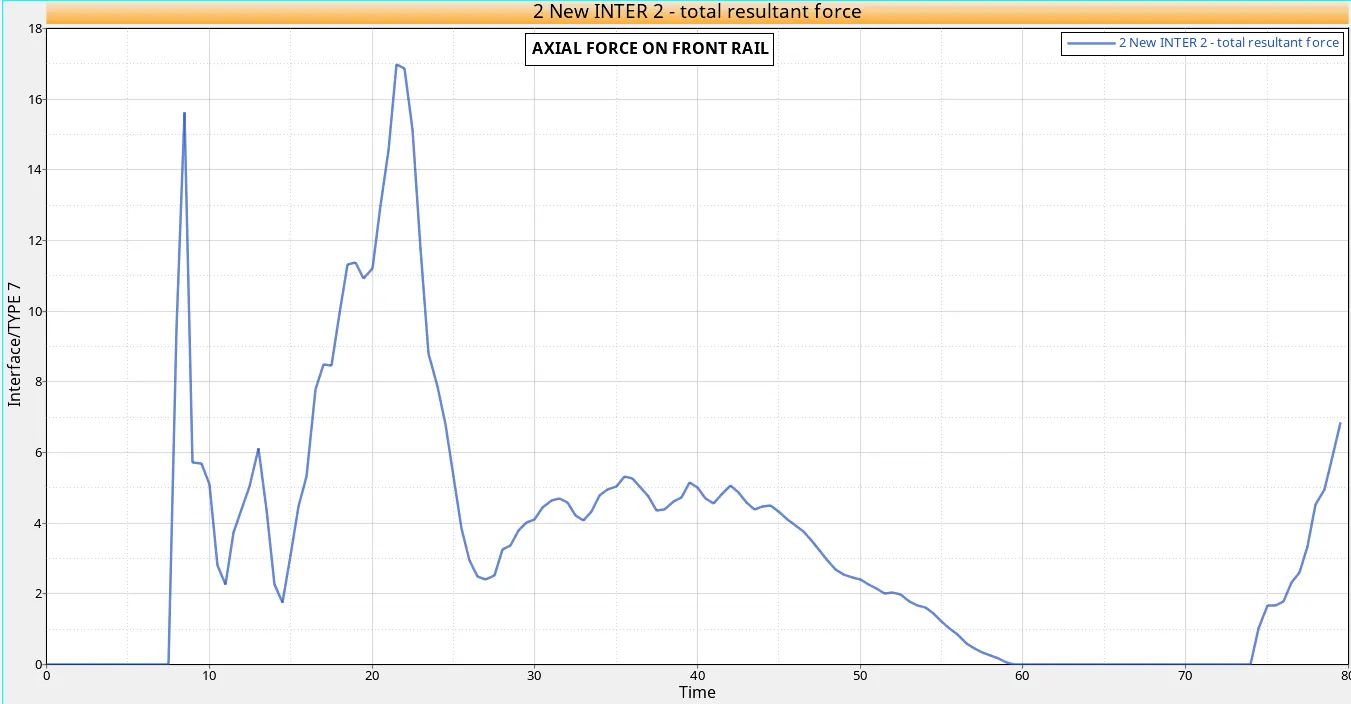
* At the very first stage of the simulation the bumper gets ruptured and at about 8ms a large amount of force is applied on rail from bumper and then the force fluctuates throughout the simulation and a maximum force of 16.99N is noted.
* Then it is noted there is a fall in the force because due to the force acting the rail gets deformed and starts transferring the force to the rail.
ACCELEROMETER
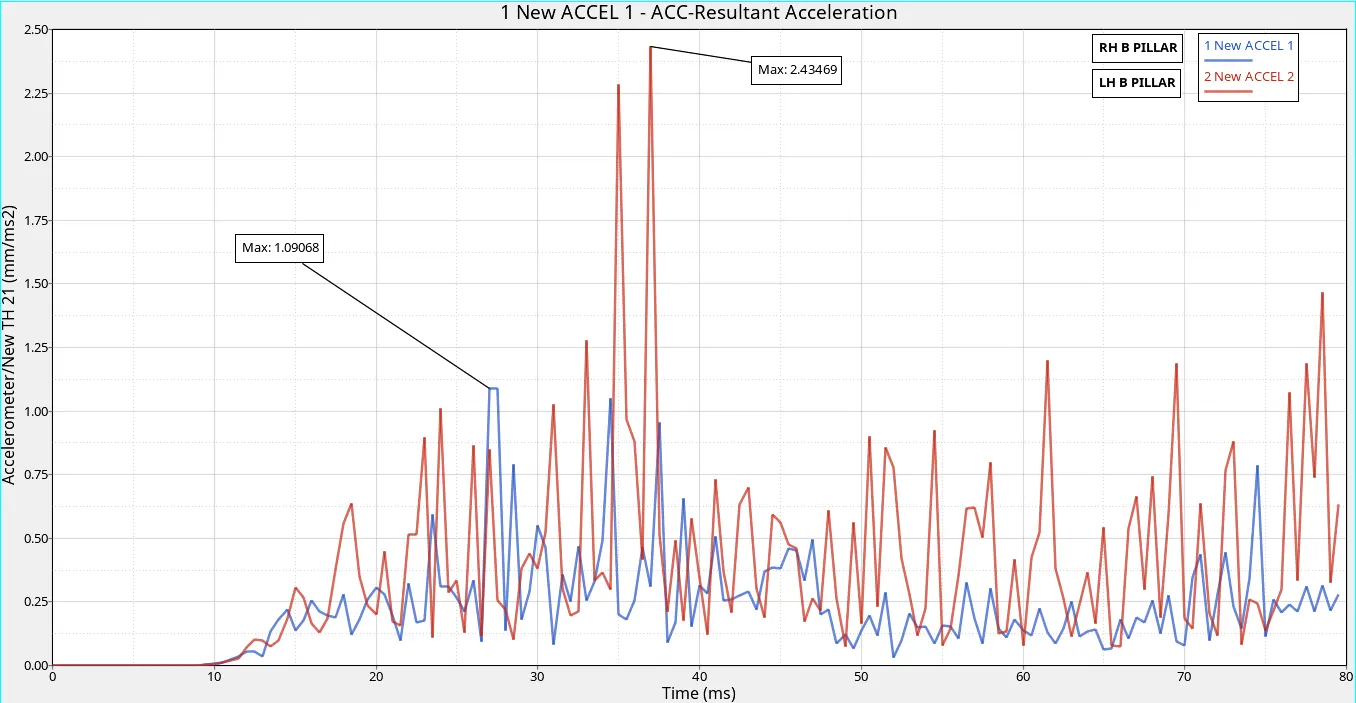
* Accelerometers are provided just below the B pillar in both sides of the model. Analysing the graph the acceleration at LH pillar is very more compared to the RH pillar. Since more of the energy absorption is taken from LH of the BIW it gets transferred to LH B pillar which resulted in a sudden rise in acceleration. Acceleration in RH pillar is fluctuating but low compared to the other pillar.
* Maximum acceleration in LH pillar is noted as 2.43 mm/ms^2 whereas in RH pillar it is 1.09 mm/ms^2.
INTRUSION ON NODES (66695,66244)
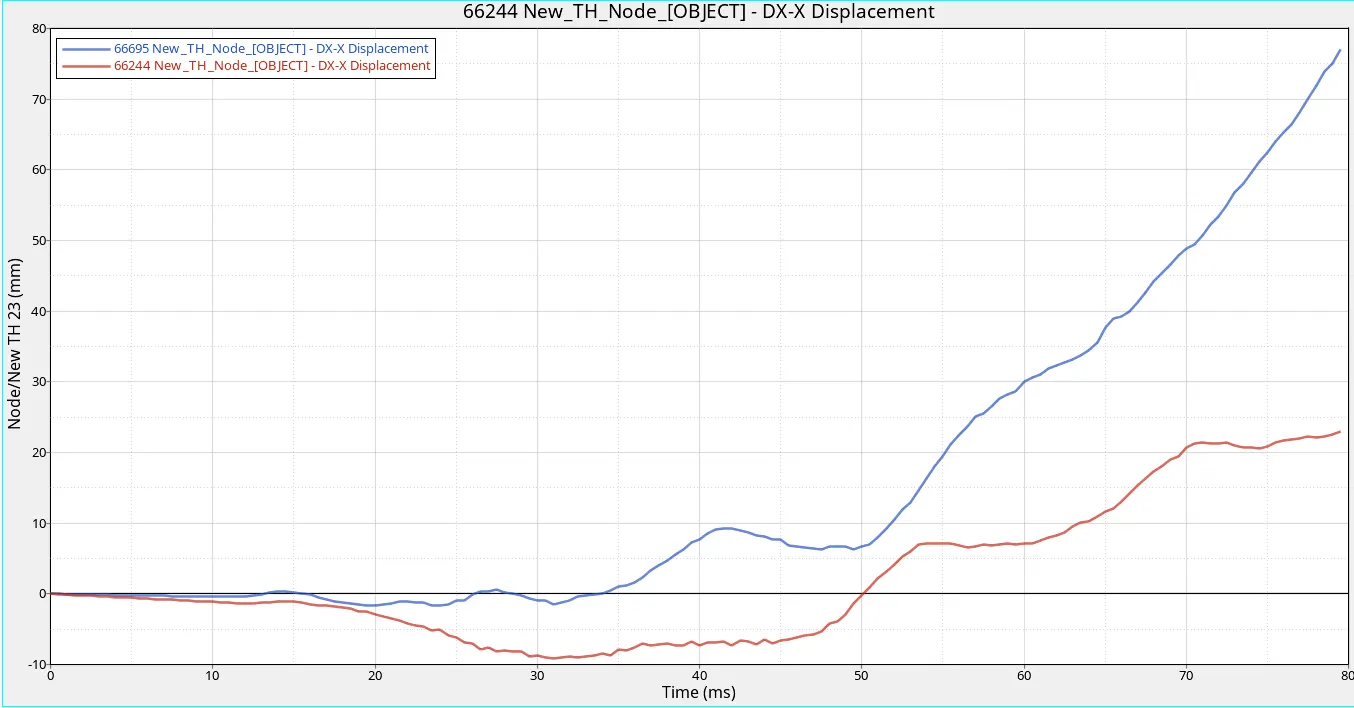
* The displacement of specified notes are given above where the first node attained a maximum diplacement of 76.983 mm and the second node of 22.944 mm.
CONCLUSION
* The LH side of the BIW model is absorbing more energy which resulted in large deformation and so the force acting on the LH pillars and rails is more compared to the RH side components.
* The actual destruction of the vehicle is avoided and the crash test using simulation becomes economical.
* The results are used to assess both the crashworthiness and to investigate the ways to improve the design.