Project - Data Handling and Interpolation
AIM: Perform the interpolation in the range of -17.3:0.1:0.9.
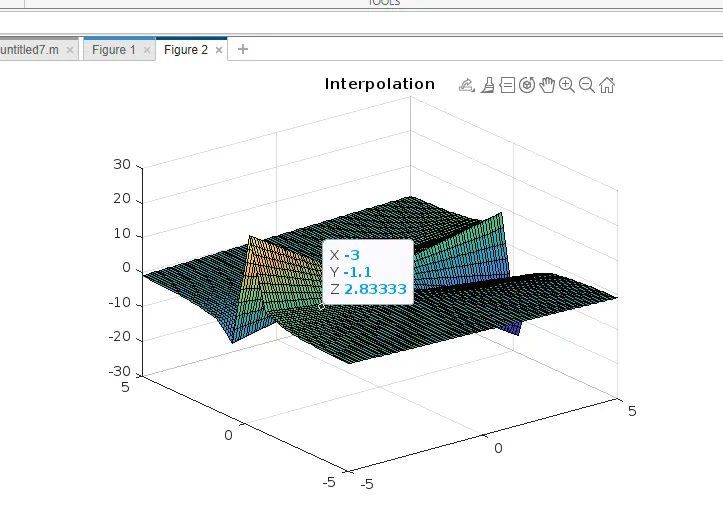
A) Generate the interactive plot for the interpolated data
B) compute the current values for given voltages below and store them in a text file
VV =[-17.2 -17.1 -13.8 -13.5 -13.0 -12.5 -11 -9 -5.76 -6 -1 0.11 0.25 0.5 0.61]’
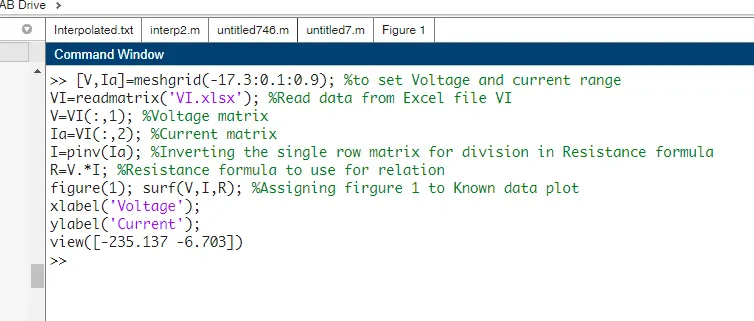
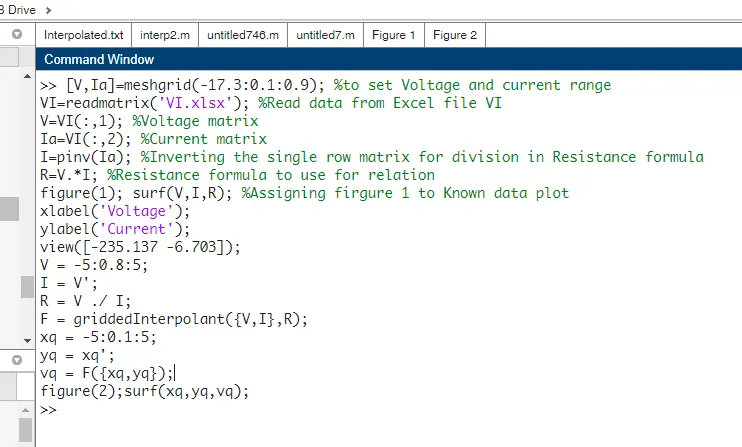
MATLAB CODE:
[V,Ia]=meshgrid(-17.3:0.1:0.9); %to set Voltage and current range
VI=readmatrix('VI.xlsx'); %Read data from Excel file VI
V=VI(:,1); %Voltage matrix
Ia=VI(:,2); %Current matrix
I=pinv(Ia); %Inverting the single row matrix for division in Resistance formula
R=V.*I; %Resistance formula to use for relation
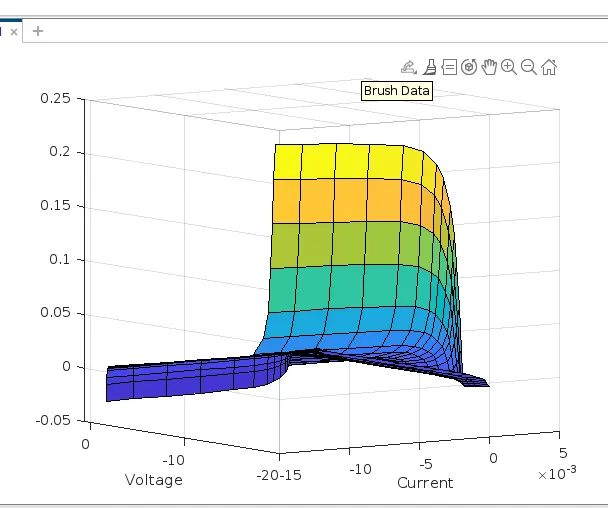
figure(1); surf(V,I,R); %Assigning firgure 1 to Known data plot
xlabel('Voltage');
ylabel('Current');
view([-235.137 -6.703]);
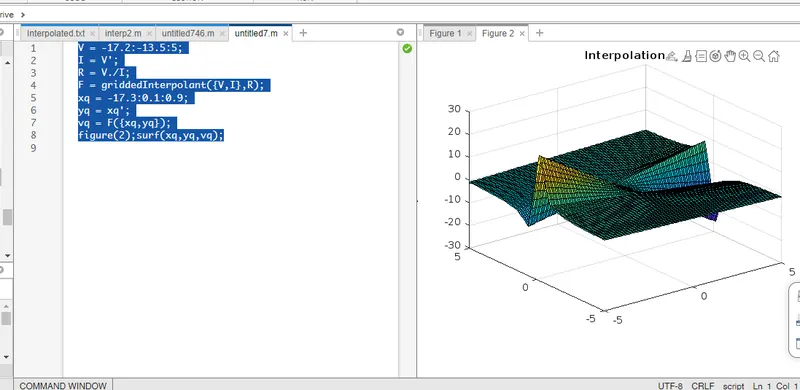
V = -5:0.8:5;
I = V';
R = V ./ I;
F = griddedInterpolant({V,I},R);
xq = -5:0.1:5;
yq = xq';
vq = F({xq,yq});
figure(2);surf(xq,yq,vq);
title('Interpolation');
fid=fopen("Interpolated.txt",'w'); %Opening a text file to input the data
len=length(F); %Reading the length matrix F
for i=1:len %Running for loop for writting
fprintf(fid,'%d ',F); %Writting data
end %Ending the process
fclose(fid);
end
figure(1):
figure(2)