Project - Data Handling and Interpolation
Interpolation is a process of determining the unknown values that lie in between the known data points. Interpolation is a technique for adding new data points within a range of a set of known data points. Interpolation can be used to fill-in missing data, smooth existing data, make predictions, and more.
Linear Interpolation Method – This method applies a distinct linear polynomial between each pair of data points for curves, or within the sets of three points for surfaces.
Spline Interpolation Method – This method fits a different cubic polynomial between each pair of data points for curves, or between sets of three points for surfaces.
interp1 function is uded for the interpolation of 1-D data and interp2 function is used for the interpolation of 2-D data in meshgrid format.
We will be using the interp1 command to solve the required problem.
Code with explaination
% Project - Data Handling and Interpolation
close all
clear
clc
% Downloading the excel file and storing it in the same directory of the
% matlab script file.
matrix = xlsread('VI.xlsx'); % Loading the data from the excel file

Volt = matrix(:,1);          % Retriving the Voltage data
Amphere = matrix(:,2);       % Retriving the Current data

% For Interpolating between the given range
Volt_q = [-17.3:0.1:0.9];    �finig the range for Interpolation
Amphere_q1 = interp1(Volt,Amphere,Volt_q); % Linear Interpolation
Amphere_q2 = interp1(Volt,Amphere,Volt_q,'spline'); % Spline Interpolation
% Plotting of Actual data and Linearly Interpolated Data
figure(1);
plot(Volt,Amphere,'o',Volt_q,Amphere_q1,':.');
grid;
title('Linear interpolation');
legend('Actual Value', 'Interpolated value', Location='southeast');
xlabel('Voltage (V)');
ylabel('Current (I)');
% Saving the figure of linear interpolation plot
print('Project - Linear Interpolation Plot','-djpeg');
% Plotting of Actual data and Spline Interpolated Data
figure(2);
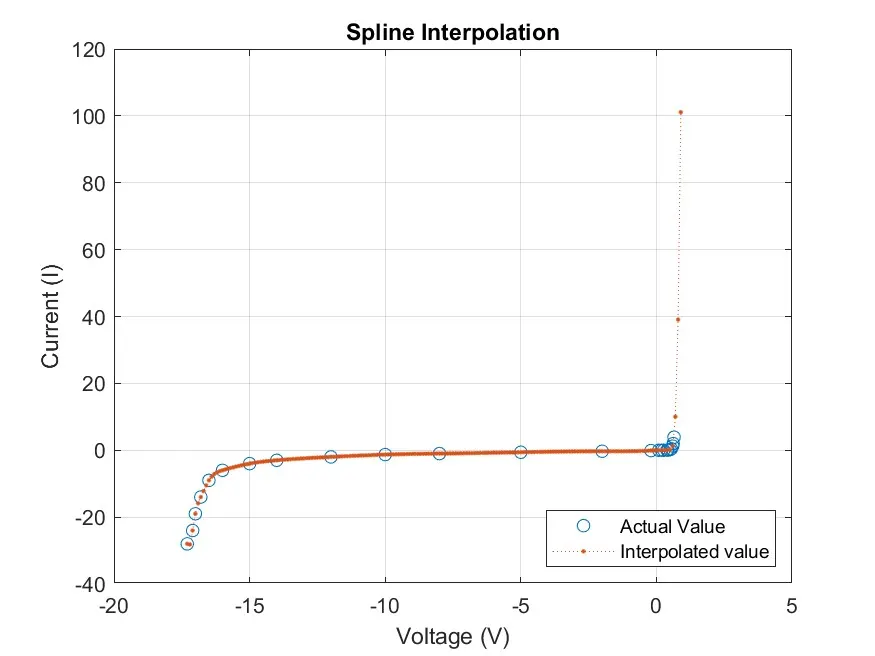
plot(Volt,Amphere,'o',Volt_q,Amphere_q2,':.');
grid;
title('Spline Interpolation');
legend('Actual Value', 'Interpolated value', Location='southeast');
xlabel('Voltage (V)');
ylabel('Current (I)');
% Saving the figure of spline interpolation plot
print('Project - Spline Interpolation Plot','-djpeg');
% To save the interpolation data to text file
% We will create separate files for linear interpolation data and Spline
% interplation data
% To create text file of linear interpolation data
fid = fopen('project_linear_interpolation_data.txt','w');
                         % Opening the text file "project_linear_interpolation_data.txt"
                         % and providing access to write by using 'w'.
fprintf(fid,'%d \n',Amphere_q1);
fclose(fid);             % To close the opened text file.
% To create text file of spline interpolation data
fid = fopen('project_spline_interpolation_data.txt','w');
                         % Opening the text file "project_spline_interpolation_data.txt"
                         % and providing access to write by using 'w'.
fprintf(fid,'%d \n',Amphere_q2);
fclose(fid);             % To close the opened text file.
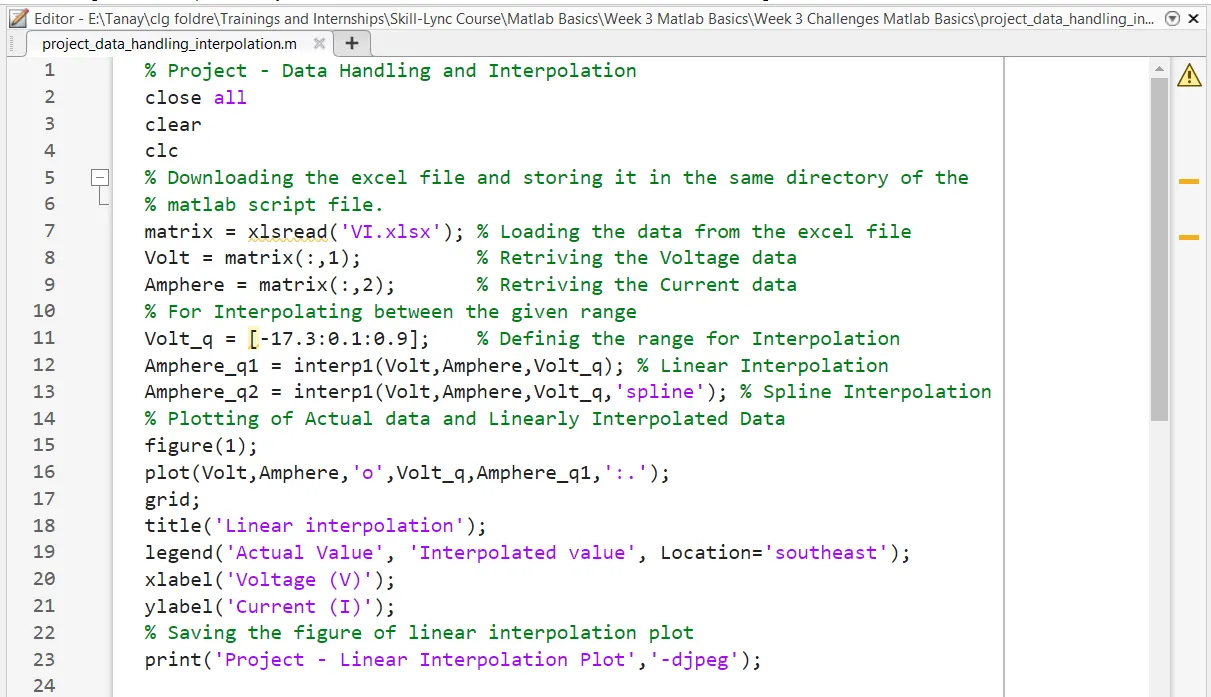
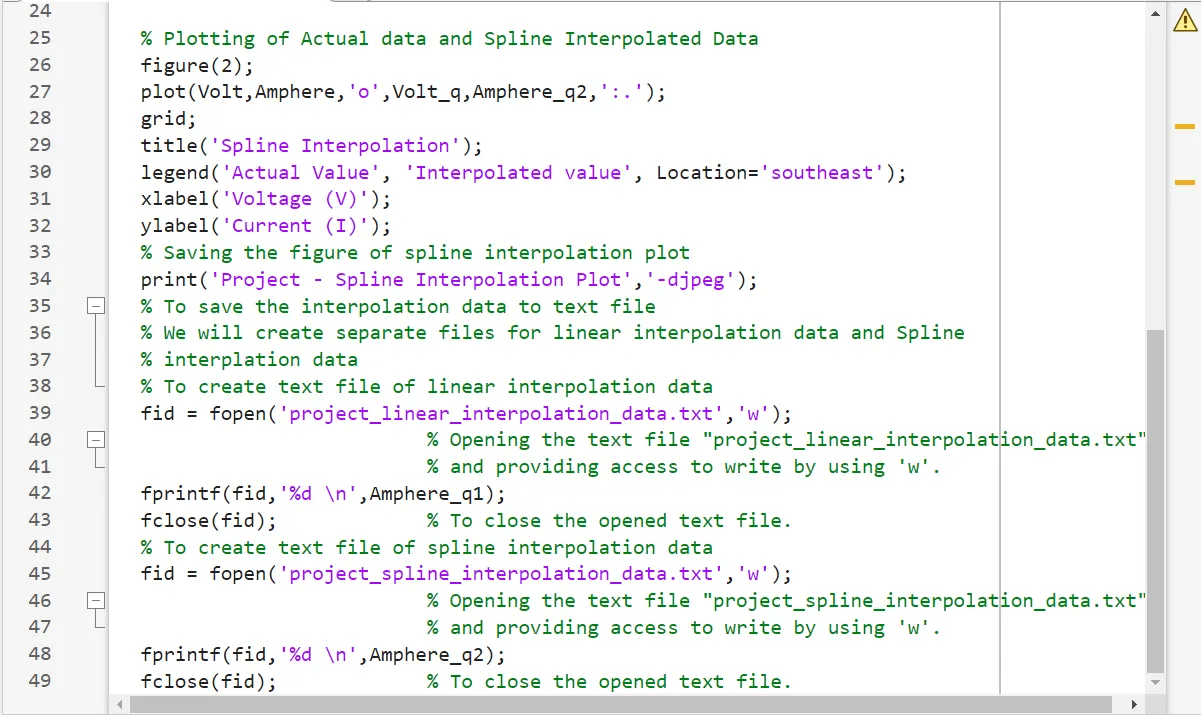
Screenshots of code
Output :-
Figure (1) Linear Interpolation
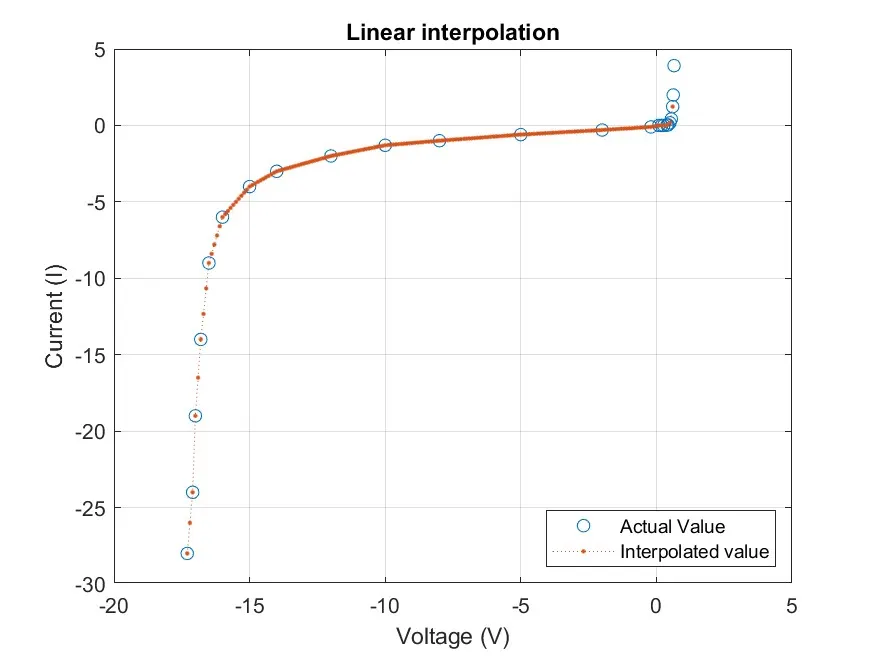
Figure (2) Spline Interpolation
Text file for Linear Interpolation
Text file for Spline Interpolation