Project - Data Handling and Interpolation
% read exel file for voltage and current data
Voltage=xlsread('VI.xlsx','A2:A25')
Current=xlsread('VI.xlsx','B2:B25')
% plot voltage v/s current
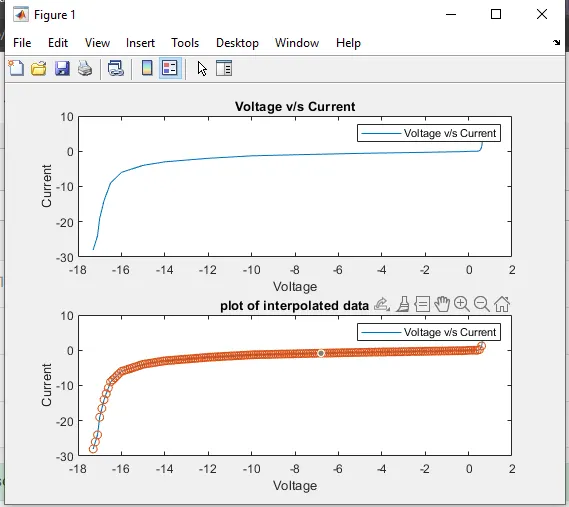
subplot(211);
plot(Voltage,Current)
xlabel('Voltage');ylabel('Current');
legend('Voltage v/s Current');
title('Voltage v/s Current');
% perform interpolation in range of -17.3:0.1:0.9
Voltage_1=[-17.3:0.1:0.9];
Current_1=interp1(Voltage,Current,Voltage_1,'linear');
% generate the interactive plot for the interpolarated data
subplot(212);plot(Voltage,Current,Voltage_1,Current_1,'o');xlabel('Voltage');ylabel('Current');legend('Voltage v/s Current');title('plot of interpolated data');
% additionally compute current(II) values for given voltage(VV) values and store in text file
% Voltage(VV)
VV = [-17.2 -17.1 -13.8 -13.5 -13.0 -12.5 -11 -9 -5.76 -6 -1 0.11 0.25 0.5 0.61]
%Current(II)
II = interp1(Voltage,Current,VV,'linear')
writematrix(II,'Current(II).txt')
Result :-