Project - Data Handling and Interpolation
Answer:
Matlab code:
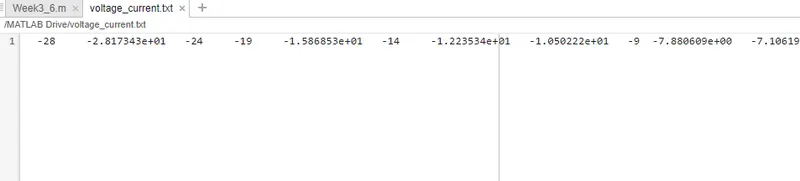
voltage=xlsread("VI.xlsx","A:A");%to get voltage data from xl file
current=xlsread("VI.xlsx","B:B");%to get current data from xl filef
I=-17.3:0.1:0.9;% defining the range for interpolation
h=interp1(voltage,current,I,'spline');% interpolation
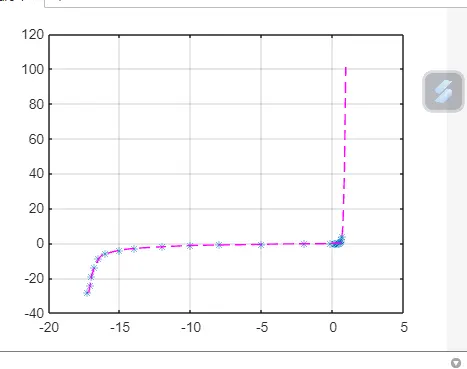
plot(voltage,current,'*',I,h,'m--');% plotting the interpolation
grid;
fileId = fopen('voltage_current.txt','w');
fprintf (fileId,'%d \t',h);% print the output xq1 to the text file
fclose(fileId);
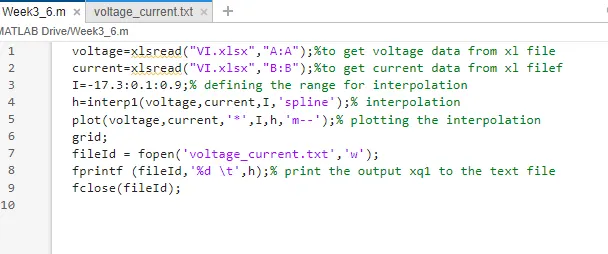
Text file:
Output plot: