Project - Data Handling and Interpolation
OBJECTIVE:
In a laboratory experiment, data of voltage and current has been recorded and the same is attached in an excel file ( Click on this link VI.xlsx ). Read the excel file in the Matlab program and perform the interpolation in the range of -17.3:0.1:0.9. Generate the interactive plot for the interpolated data and store them in a text file.
MATLAB CODE:
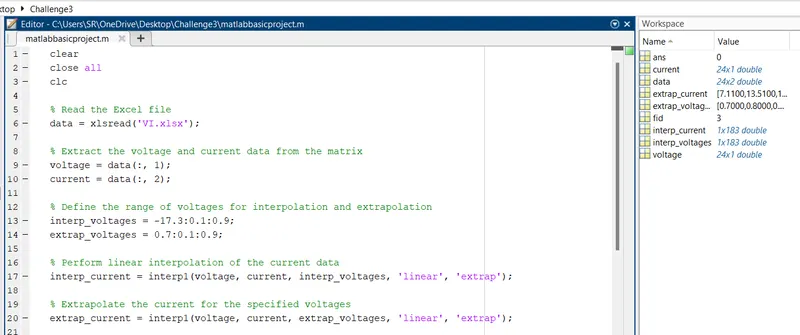
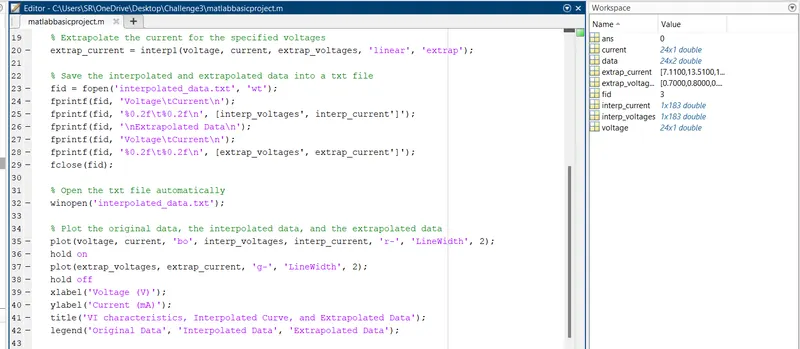
MATLAB CODE EXPLAINATION:
- The
clearcommand clears all variables from the workspace. - The
close allcommand closes all figures. - The
clccommand clears the command window. - The
xlsreadfunction reads an Excel file named "VI.xlsx" and returns the data as a matrix, which is stored in thedatavariable. - The voltage and current data are extracted from the
datamatrix using indexing and stored in thevoltageandcurrentvariables, respectively. - The range of voltages for interpolation and extrapolation is defined using the
:operator and stored in theinterp_voltagesandextrap_voltagesvariables, respectively. - The
interp1function performs linear interpolation of the current data. It takes the voltage and current data, the range of voltages for interpolation, and the options 'linear' and 'extrap' to specify linear interpolation and extrapolation beyond the range of the input data, respectively. The interpolated current data is stored in theinterp_currentvariable. - The
interp1function is used again to extrapolate the current for the specified voltages, which are beyond the range of the input data. The extrapolated current data is stored in theextrap_currentvariable. - The
fopenfunction opens a file named "interpolated_data.txt" in write text mode and returns a file identifier, which is stored in thefidvariable. - The
fprintffunction writes the headers and data into the file using tab and newline characters to separate the values. The interpolated data is written first, followed by the extrapolated data with a header that indicates it is the extrapolated data. - The
fclosefunction closes the file. - The
winopenfunction opens the file "interpolated_data.txt" using the default text editor of the operating system. - The
plotfunction creates a figure with three curves: the original data as blue circles, the interpolated data as a red line, and the extrapolated data as a green line. Thehold onandhold offcommands are used to keep the previous plot and add new plots to the same figure. Thexlabel,ylabel,title, andlegendfunctions add labels, title, and a legend to the plot. The'LineWidth'option specifies the width of the lines used for the curves.
RESULT:
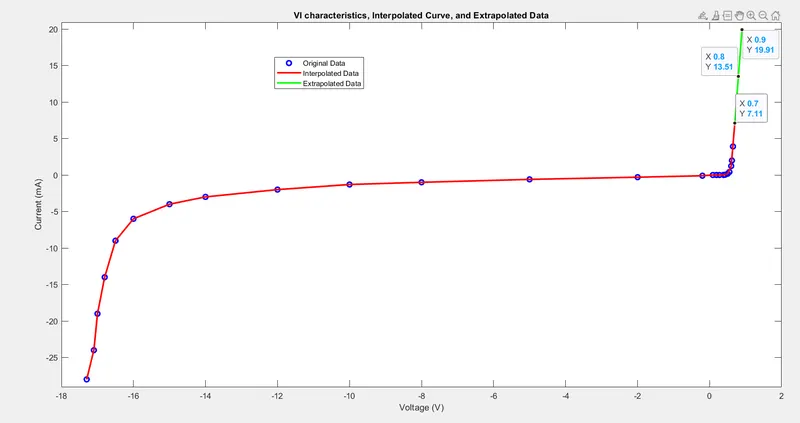
- The plot shows the vi characteristics from the input and output data.
- Blue dots is the original data from the vi.xlsx file
- Red+green line is the interpolated data.
- Green line is the extrapolated data.(positions are marked)
CONCLUTION:
- The above script file(matlabbasicproject.m) has been attached.
- The results in txt file(interpolated_data.txt) has been attached.
Pros:
- The code is well-organized and commented, making it easy to understand and modify.
- The code uses built-in MATLAB functions, which are efficient and optimized for performance.
- The code provides a visualization of the data and the results, which can help in understanding the behavior of the system being analyzed.
Cons:
- The code assumes that the input data is valid and error-free, without any missing or corrupted values.
- The code uses linear interpolation and extrapolation, which may not be suitable for all types of data and systems. More advanced interpolation and extrapolation methods could be used to improve the accuracy of the results.
- The code saves the results in a text file, which may not be the most efficient or flexible way to store and share the data.