Project - Data Handling and Interpolation
A1.
>> [num, txt, raw] = xlsread('D:\Rahul_Matlab\VI.xlsx');
>> voltage = num(:,1);
>> current = num(:,2);
>> missing_data = find(isnan(current));
>> missing_voltage = voltage(missing_data);
>> vq = interp1(voltage, current, -17.3:0.1:0.9);
>> plot(voltage, current, 'bo', missing_voltage, zeros(length(missing_voltage),1), 'rx', -17.3:0.1:0.9, vq, 'k-');
>> title('Voltage vs. Current Data with Interpolated Values');
>> legend('Measured Data', 'Missing Data', 'Interpolated Data', 'Location', 'northwest');
Warning: Ignoring extra legend entries.
> In legend>set_children_and_strings (line 643)
In legend>make_legend (line 328)
In legend (line 254)
>> grid on;
>> zoom on;
>> dlmwrite('interpolated_data.txt', vq, 'precision', '%.4f');
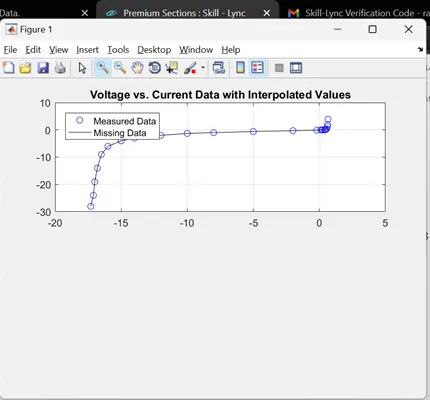
In this code, we first use xlsread to read the Excel file and extract the voltage and current data. We also use the isnan function to find missing data points in the current data and store the corresponding voltage values in missing_voltage.
Then, we use interp1 function to perform linear interpolation of the current data for the voltage values in the range of -17.3:0.1:0.9.
Next, we generate an interactive plot using plot function and add title, xlabel, ylabel, legend, grid, and zoom to enhance the visualization. The missing data points are plotted as red crosses, and the interpolated data points are plotted as a black line.
Finally, we use dlmwrite function to store the interpolated data in a text file named interpolated_data.txt with a precision of 4 decimal places.