Project - Data Handling and Interpolation
AIM:
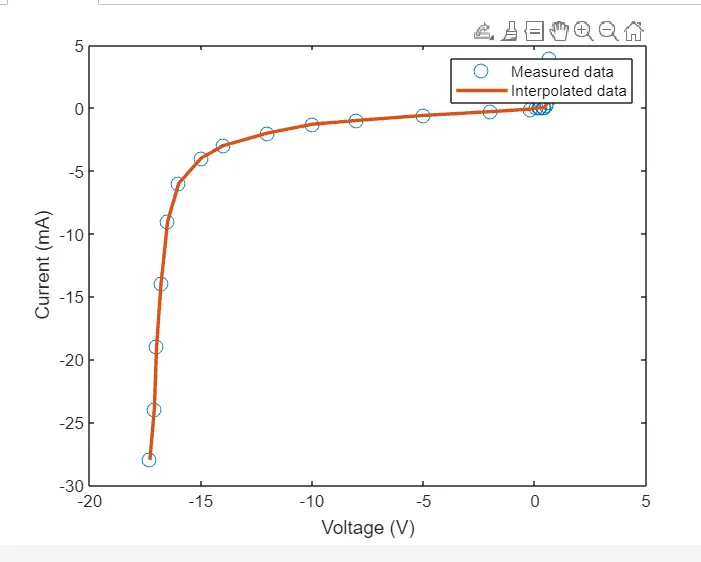
In a laboratory experiment, data of voltage and current has been recorded and the same is attached in an excel file ( Click on this link VI.xlsx ). Read the excel file in the Matlab program and perform the interpolation in the range of -17.3:0.1:0.9. Generate the interactive plot for the interpolated data and store them in a text file.
Procedure:
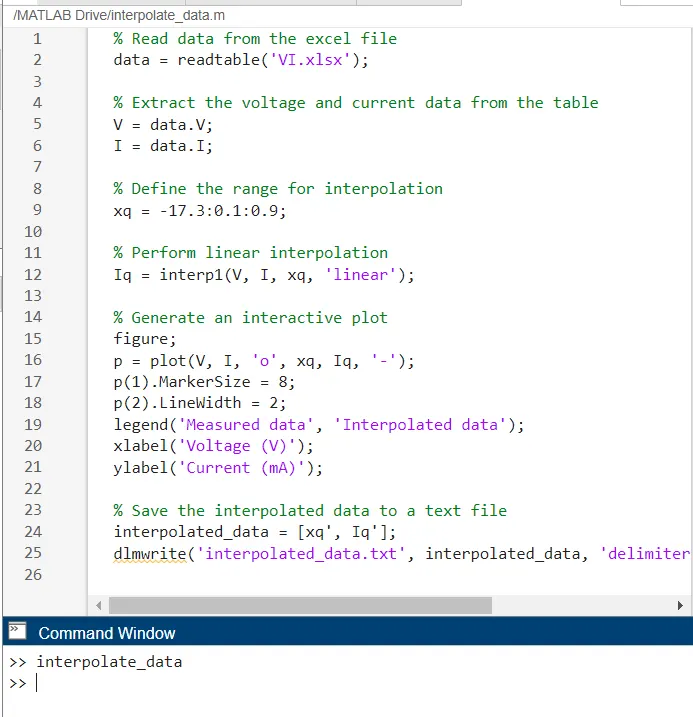
The MATLAB code to read the Excel file, perform interpolation, generate an interactive plot, and store the interpolated data in a text fileis as follows:
MATLAB code:
% Read data from the excel file
data = readtable('VI.xlsx');
% Extract the voltage and current data from the table
V = data.V;
I = data.I;
% Define the range for interpolation
xq = -17.3:0.1:0.9;
% Perform linear interpolation
Iq = interp1(V, I, xq, 'linear');
% Generate an interactive plot
figure;
p = plot(V, I, 'o', xq, Iq, '-');
p(1).MarkerSize = 8;
p(2).LineWidth = 2;
legend('Measured data', 'Interpolated data');
xlabel('Voltage (V)');
ylabel('Current (mA)');
% Save the interpolated data to a text file
interpolated_data = [xq', Iq'];
dlmwrite('interpolated_data.txt', interpolated_data, 'delimiter', '\t', 'precision', '%.4f');
Workspace:
Explaination:
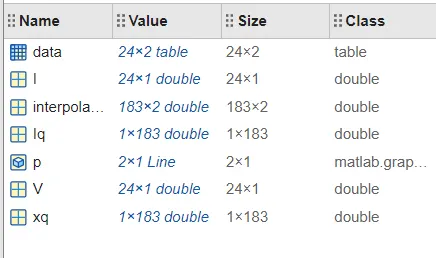
- This MATLAB code reads data from an Excel file named 'VI.xlsx' using the readtable function, which creates a table variable data. The voltage and current data are then extracted from the table and stored in variables named V and I, respectively.
- The code defines the range of voltage values to be interpolated using xq = -17.3:0.1:0.9, which specifies a range from -17.3 to 0.9 with an increment of 0.1.
- The interp1 function is used to perform linear interpolation of the current data (I) corresponding to the voltage data (V) over the range xq. The resulting interpolated current values are stored in the variable Iq.
- An interactive plot is generated using the plot function to display both the measured and interpolated data. The first plot argument (V, I) specifies the measured data, with marker 'o' and a size of 8. The second plot argument (xq, Iq) specifies the interpolated data, with a solid line and a width of 2. The legend function is used to label the two plots, and the xlabel and ylabel functions are used to label the axes.
- Finally, the interpolated data is saved to a text file named 'interpolate_data.txt' using the dlmwrite function. The delimiter is set to a tab character ('\t'), and the precision of the output is set to four decimal places using the 'precision' parameter.
Output: