Week-4 Challenge WOT Condition Part-2
Aim:
- What is the difference between mapped and dynamic model of engine, motor and generator? How can you change model type?
- How does the model calculate miles per gallon? Which factors are considered to model fuel flow?
- Run the HEV Reference Application with WOT drive cycle. Change the grade and wind velocity in the environment block. Comment on the results.
- Keeping all other parameters same, compare the simulated results of hybrid and pure electric powertrains.
Q.1 a) What is the difference between mapped and dynamic model of engine, motor and generator?
ANS:
Mapped model of Engine:
- Mapped model uses a set of steady-state lookup tables to characterize engine performance.
- The lookup tables provide overall engine characteristics, including actual torque, fuel flow rate, BSFC, and engine-out exhaust emissions.
- In mapped model,vehicle's required torque is sensed and which is generated by engine or motor without analyzing real time parametrs.
- The output values are collected with respect to the input values from engine/motor.
- The accuracy of this model is less than dynamic model.
- As it does not run by real time parametrs, so it takes less simulation time.
Dynamic Model of Engine:
- Dynamic model decomposes the engine behavior into engine characteristics that are separated into lower-level components. By combining components in this way, the models capture the dynamic effects. So it uses combination of outputs from the various subsystems to generates the output.
- This model runs by real time simulation parameters, where required inputs taken from the drive cycle and for that individual real time simulation gets performed. So the output of the simulation is the summation of all the results of the subsystems.
- According to the drive cycle requirement, the initial bus voltage and current is given along with the vehicle feedback, so that the actual simulation runs at that particular moment throughout the drive cycle.
- The accuracy of this model is very high, as it considers the real time parameters i.e, outputs from the various subsystems to generates the output.
- The simulation will take a very long time to complete, as it has so many individual real time simulations running by all the subsystems of the engine, motor/generator.
Q.1 b) How can you change model type?
ANS:
Steps to be followed to change the Model Type:
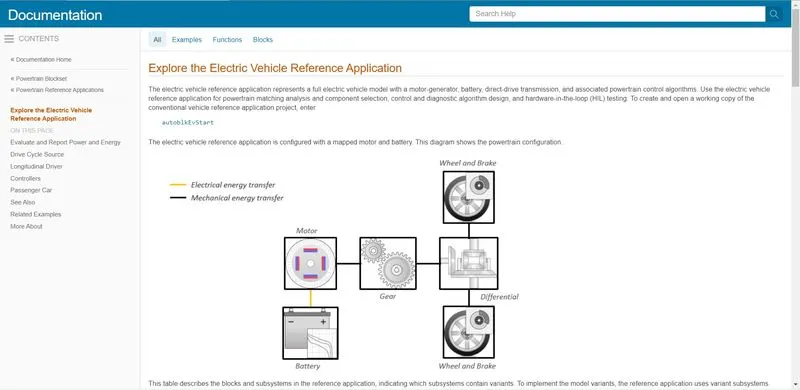
Step-1: Firstly, Goto Matlab's Help menu, then search for a Powertrain blockset. After that powertrain blocksets documentation shows on the screen. Open the "Explore the Electric Vehicle Reference Application" in that click on the Simulink model named as autoblkEvStart of the as shown in the fig. below.
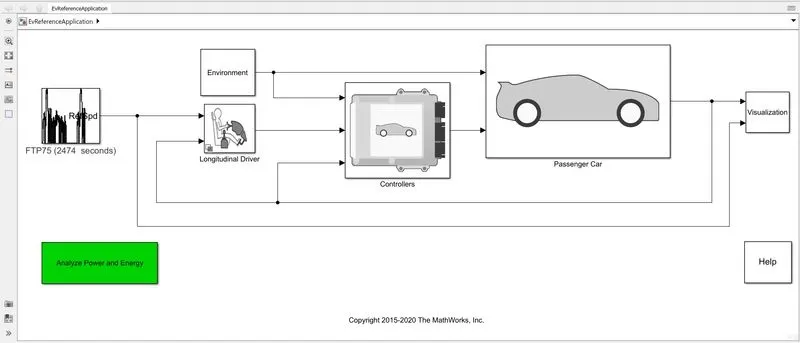
Step-2: After clicking on autoblkEvStart, the new window of simulink model of Electric Vehicle Reference Application simulink blockset opened. Now from the model, we have to open the Passenger Car block, shown in the fig. below.
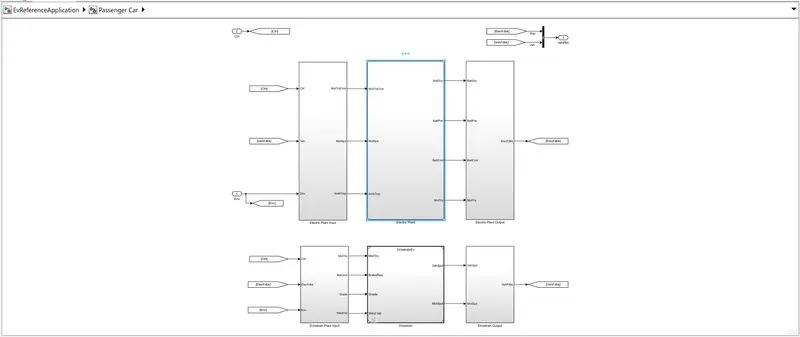
Step-3: In the Passenger Car block, we have seen so many blocksets, but we have to select the Electric plant block and open it.
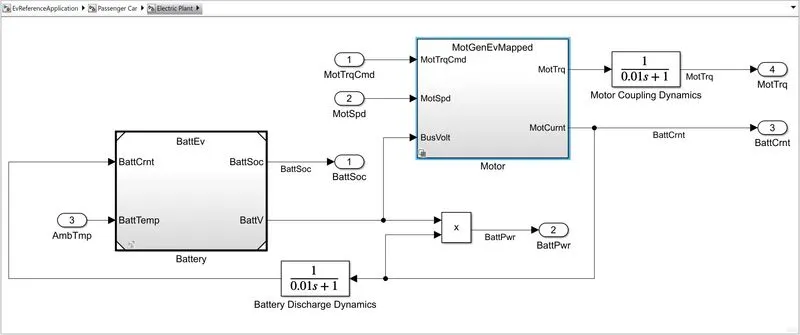
Step-4: In the Electric plant block we have seen two blockset which are,
1. MotGenEvMapped Model
2. MotGenEvDynamic Model
Now, we have to activate MotGenEvDynamic block, So Right-click on the MotGenEvDynamic model block.
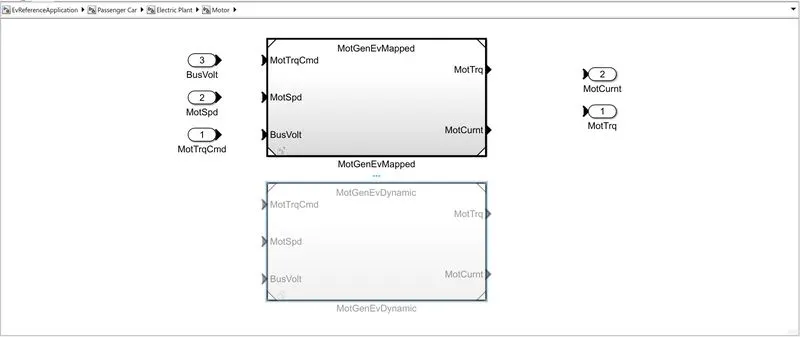
Step-5: After right-click on MotGenEvDynamic model block, select the Variant Manager after choosing one tab new window opened. Then we have to select MotGenEvDynamic model option and right-click on it, then click on Set as Lable Mode Active Choice. So finally, MotGenEvDynamic Model Activated. shown in fig. below.
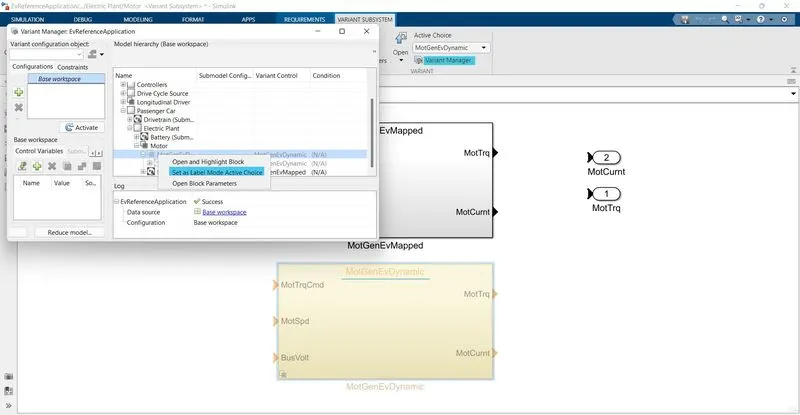
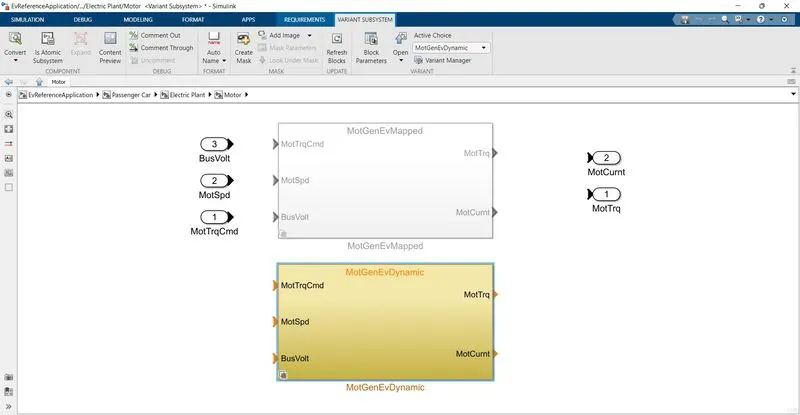
Hence, MotGenEvMapped model changed to MotGenEvDynamic model.
Q.2 a) How does the model calculate miles per gallon?
ANS:
Miles per Gallon:
- Miles per Gallon is a fuel economy rating determined by how far a car can travel on a gallon of petrol or Diesel for an Engine powered car.
- In case of an Electric vehicle, it recognises the energy which is equivalent to that of an engine-powered car to propel the car through a certain distance.
- The amount of Fuel Energy required to move an engine-powered car through a distance is determined and then it is compared to the equivalent amount of electric energy required to move the car through the same distance and is expressed as the miles per gallon.
- The powertrain block set has a model that calculates the miles per gallon for all kinds of vehicles.
The transformation from a Mile per Gallon to Fuel Flow is mentioned below,
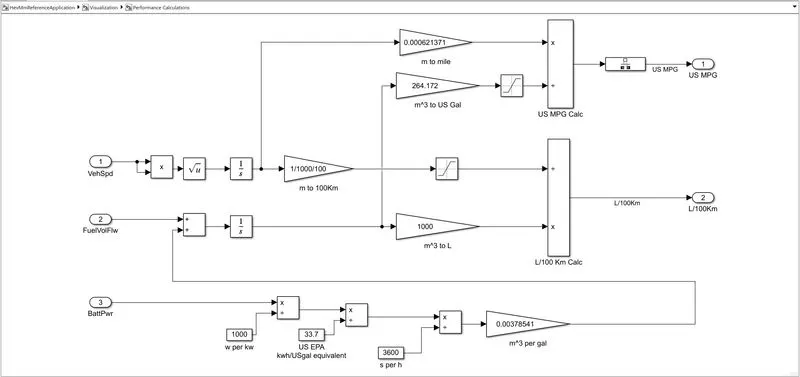
Conversion from Cubic Meter to Gallon (m^3 to a gallon) is,
As we know 264.172 US Gallons is equal to 1000L.
- The reference model taken here for consideration is HEV and as it operates on both the Battery and the Fuel Injection Engine.
- The final output/Fuel Efficiency is calculated by keeping into consideration of the Battery Output. Fuel Output and the Vehicle Speed/Kilometres are Driven. Therefore the fuel efficiency is calculated and it is converted after the saturation thus the FE is calculated.
Q.2 b) Which factors are considered to model fuel flow?
ANS:
Mainly three-factor are considered to model fuel flow as shown in fig.
- Vehicle Speed
- Fuel Flow
- Battery Power
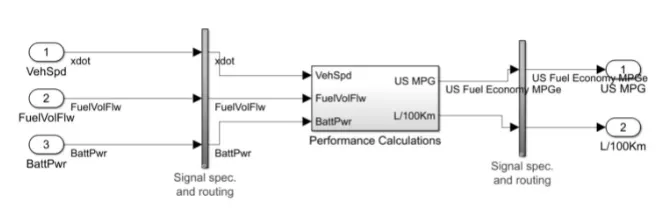
Vehicle Speed and Fuel Flow:
- The Vehicle speed is an important factor while considering the fuel consumption at that particular time. so to determine the fuel consumption throughout the drive cycle, speed of vehicle is taken into consideration.
- To convert speed to Distance, we can integrate it with respect to time. So we are doing the same for converting the velocity, to get the distance covered by integrating it w.r.t. time.
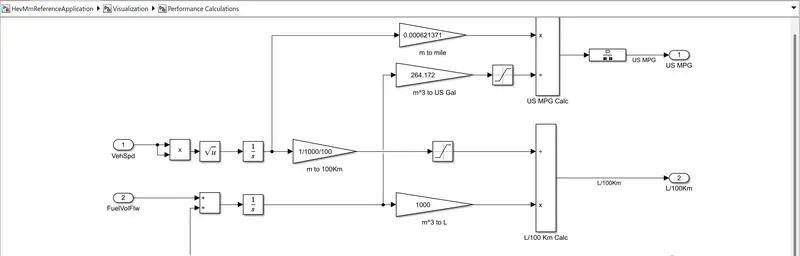
- The Fuel flow is expressed as the mass flow rate (i.e) the amount of fuel at each moment in Kg/sec.
- Now, integrating this with result in the mass of the fuel and by using this, we convert it to the volume and multiply it by 1000 to get it in Litres.
- By comparing both the results, we can get the amount of Litre consumed to run the vehicle for 100km.
Battery Power:
- The amount of Energy from battery power required to propel the vehicle Equivalent to that of the Engine is calculated here.
- The battery power is given in Watt and it is converted into KW by dividing it by 1000.

- After that, the battery power is converted into Energy i.e. KWh by multiplying with the time.
- Then, the Energy from KWh converted into its equivalent energy in US gallons of automotive gasoline by dividing it by 33.7. Since, we get the energy in US Gallons equal in KWh, we are trying to get this equivalent energy into LIS Gallons per second. So, we did this by dividing it with 3600 and converted the time from hours to seconds.
- Multiplying it with 0.00378541, so we converted the US Gallons per sec into the volume of the fuel flow in (m^3/sec) and then, multiply it with 739 (California Phase II Gasoline density) i.e. m^3/s. kg/m^3 which gives the result as mass flow rate in kg/s.
- Finally, the Battery energy equivalent in kg/s is given as an input for the fuel flow parameter to find the equivalent US Gallons of energy and estimate the Miles per Gallon.
Q.3) Run the HEV Reference Application with WOT drive cycle. Change the grade and wind velocity in the environment block. Comment on the results.
ANS:
Hybrid Electric Vehicle:
- A Hybrid Electric Vehicle (HEV) is a type of hybrid type that combines a conventional internal combustion engine (ICE) system with an electric propulsion system.
- The presence of the electric powertrain is intended to achieve either better fuel economy than a conventional vehicle or beer performance. An example of HEV is Toyota Prius.
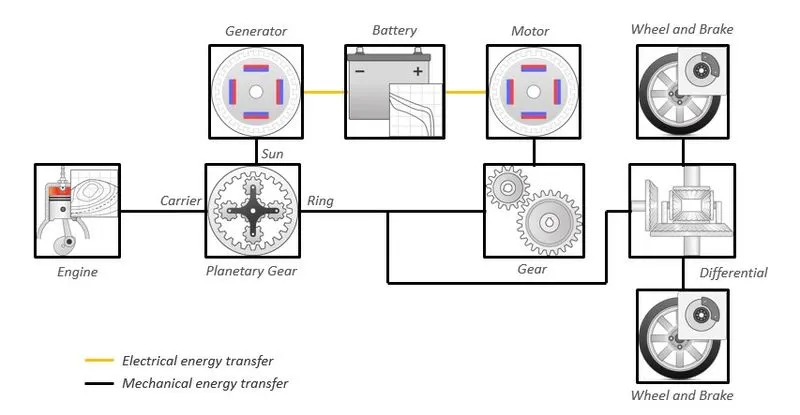
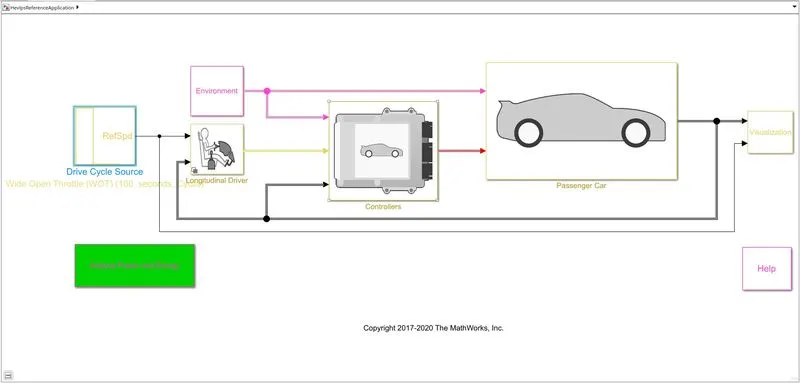
- From the powertrain blockset we have selected the hybrid electric vehicle and this is the Simulink model.
- Here, we can select the input parameters as we wish and we can simulate to check the results.
Part-1
Simulation situation:
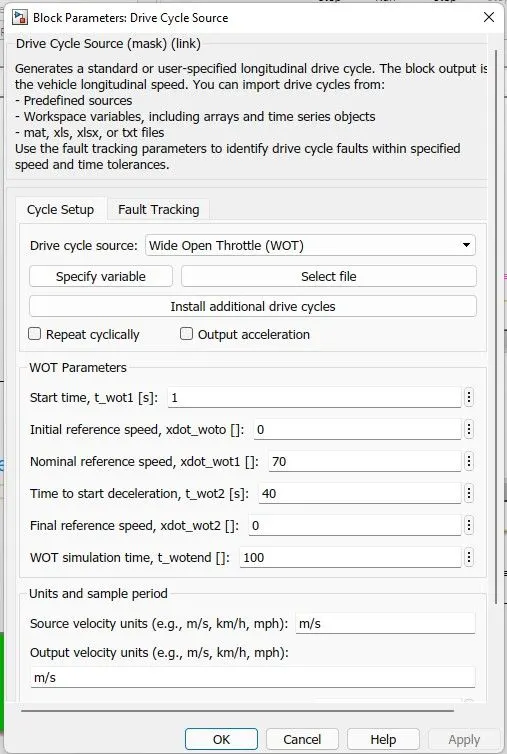
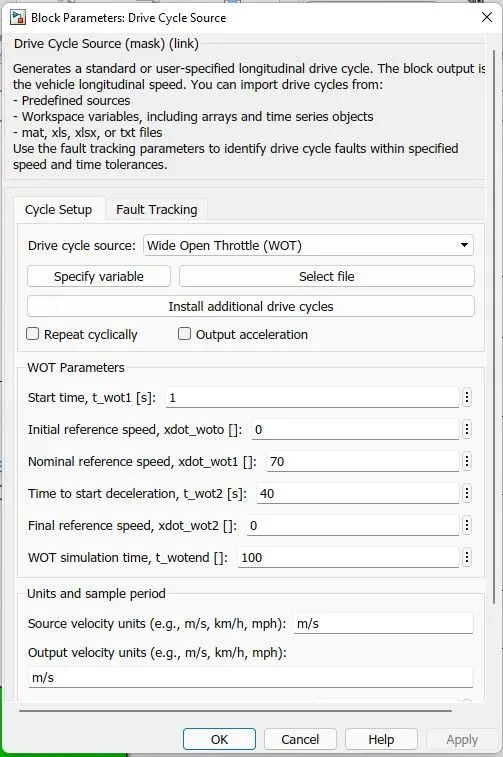
The simulation is done for a Hybrid electric vehicle with a Wide Open Throttle drive cycle.
- The Total cycle time=100 seconds.
- The Top speed of this cycle = 70 mph.
- Time to start deceleration =40seconds.
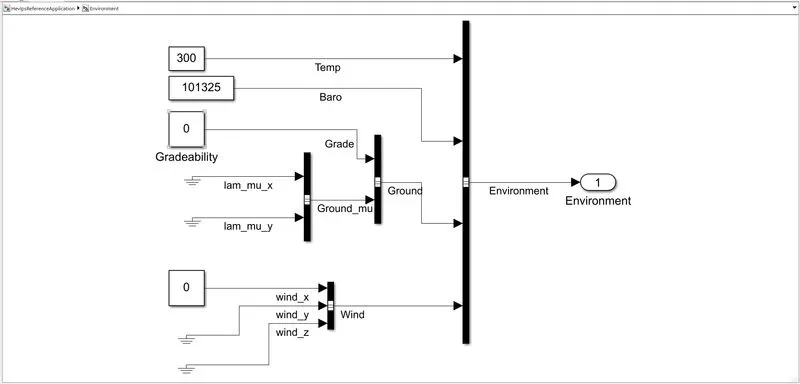
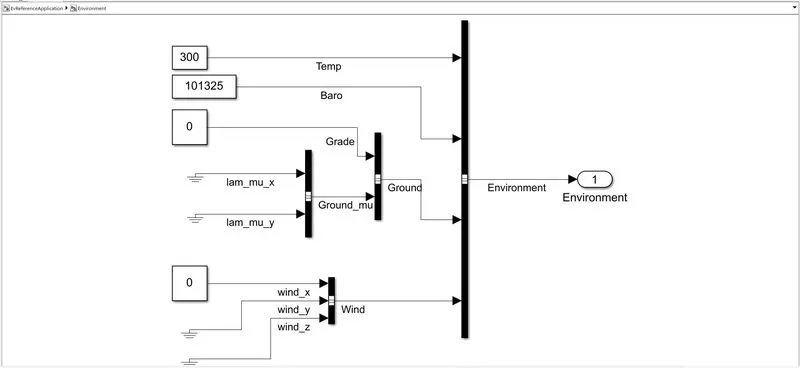
- The Grade angle =0 degrees.
- The wind velocity=0 m/s.
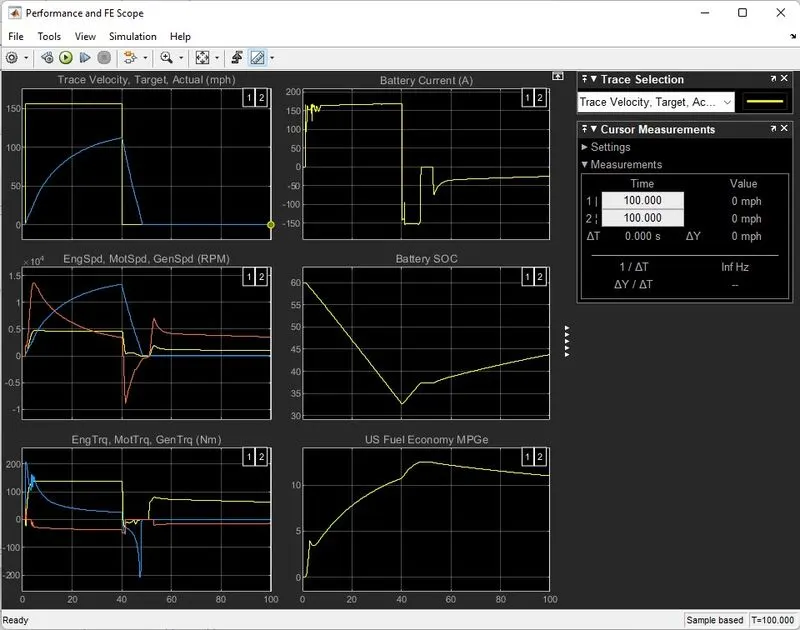
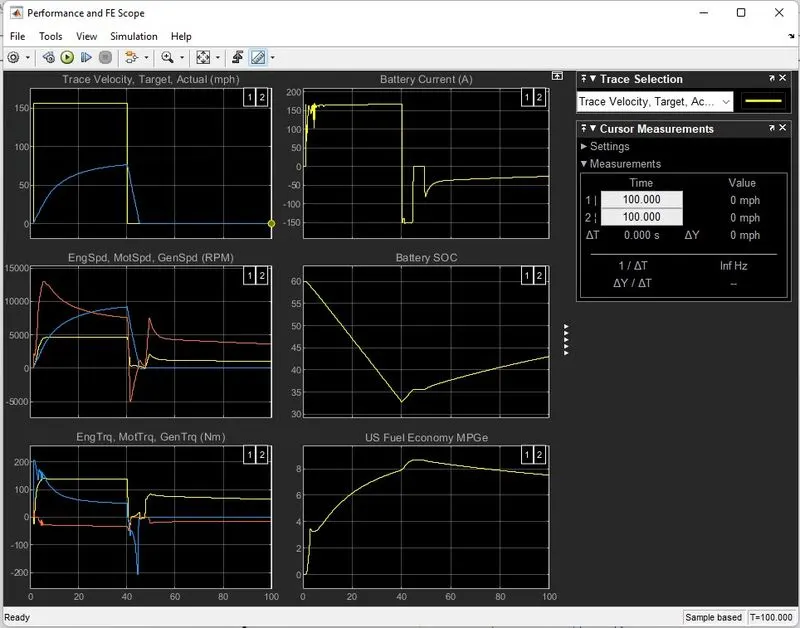
- The above figure shows the results for the man and there are six plots in them.
- Each plot shows a particular result and these plots are made in such a way that, there is a cursor measurement and if we change the cursor position, the cursor moves on to the other plots too, which paves the way to study the result.
- The cursor enables us to study the behavior of other result parameters better way corresponding to the acceleration of the vehicle.
Plot 1:
Shows the velocity of the vehicle concerning the Drive cycle data with the Time scale on the X- axis,
The acceleration time to reach 70 mph = 12.9 seconds
The deceleration time from 70 mph to a minimum of 5.5 seconds
Plot 2:
Shows the changes in the speed of the engine, motor and Generator in RPM throughout the drive cycle.
Peak Engine speed= 4780 Rpm
Peak Motor speed = 5497 Rpm
Peak Generator speed = 13690 Rpm
Plot 3:
Shows the Torque0 characteristics and its changes of engine motor and generator (Nm) throughout the drive cycle.
Peak Engine torque = 138.7 Nm
Peak Motor torque = 206.7 Nm
Peak Generator torque=-42.2 Nm
Plot 4:
Shows the Battery Current values (A) and their changes per the Drive cycle.
The peak current discharge from the battery=168.5A
The peak current charging to the battery=-151.7 A
Plot 5:
Shows the battery state of charge SOC (%) and its changes corresponding to the driving inputs. The state of charge decreased from 60% to 32.6% of charge in a time period of 40.3 seconds, for the specified driving conditions.
Plot 6:
Shows the Fuel Economy as Mile per Gallons for the corresponding conditions. The maximum miles that the car can run per gallon of fuel equivalent 46 Mile for the given vehicle at the specified driving conditions.
Part-2
Simution Situation:
The simulation is done for a Hybrid electric vehicle with a Wide Open Throttle drive cycle.
The Total cycle time=100 seconds.
The Top speed of this cycle = 70 mph.
Time to start deceleration =40seconds.
The Grade Angle =6 degrees.
The Wind Velocity=8 m/s.
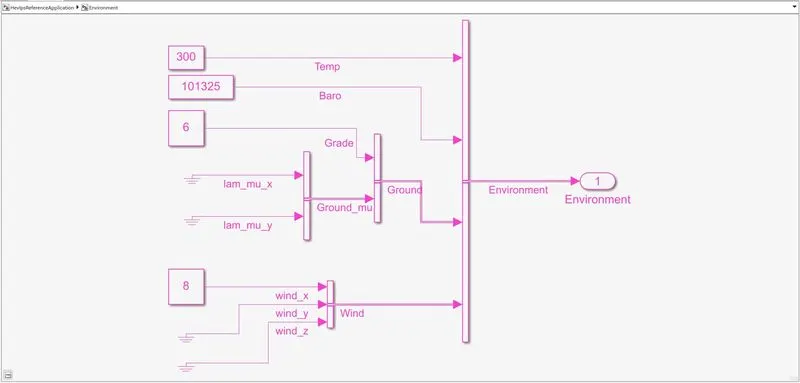
- From the above results, we can observe some changes from the previous case of simulation.
- In this case, the vehicle parameters and the drive cycle are the same here, as we considered some changes in the environment blocks by adding some hill climb angles and wind velocity.
- The changes in the results are given below,
Plot 1:
Shows the velocity of the vehicle concerning the Drive cycle data with the Time scale on the X-axis.
The top speed of vehicle cannot be achieved as we have some additional forces acting and so the car can only run up to 76.4 mph.
The acceleration time reaches to a top speed of 76.4 mph=40.1 seconds.
The deceleration time from 76.4 mph to a minimum of 5.29 seconds.
Plot 2:
Shows the changes in the speed of the engine, motor and Generator in RPM throughout the drive cycle.
Peak Motor speed=81005 Rpm
Peak Generator speed 12758.5 Rpm
Peak Engine speed= 4555 Rpm
Plot 3:
Shows the Torque characteristics and its changes of engine motor and generator in Nm throughout the drive cycle.
Peak Engine Torque=129.6 Nm.
Peak Motor torque=202.4 Nm.
Peak Generator torque=482 Nm.
Plot 4:
Shows the Battery Current values (A) and its changes for various per the Drive cycle.
The peak current discharge from the battery=168.1 A
The peak current charging to the battery=-152.1 A
Plot 5:
Shows the battery state of charge SOC (%) and its changes corresponding to the driving inputs.
The state of charge decreased from 60% to 32.72 % of charge in a time period of 40.1 seconds, for the specified driving conditions.
Plot 6:
Shows the Fuel Economy as Mile per Gallons for the corresponding input driving conditions.
The maximum miles that the car can run per gallon of fuel equivalent to 15.33 Miles for the given vehicle at the specified driving conditions.
Observation:
- The results for both the cases are found and we can see that re-enactment 1 without the incorporation of slope climbing conditions and the drag speed is significantly more proficient, when contrasted with the recreation which incorporates the slope climbing conditions and the breeze drag speed. The vehicle couldn't accomplish the necessary maximum velocity however utilizing the most elevated conceivable current release of that equivalent battery utilized previously.
- The condition of charge additionally shows that the release is likewise high contrasted with reproduction.
- The Fuel Economy is likewise down to half of the past recreation, So one can say it is clear that the effectiveness of no-heap is high contrasted with the vehicle with extra loads following up on them and above we have envisioned this utilizing the Powertrain blockset.
Q.4) Keeping all other parameters same, compare the simulated results of hybrid and pure electric powertrains.
ANS:
Pure Electric Vehicle:
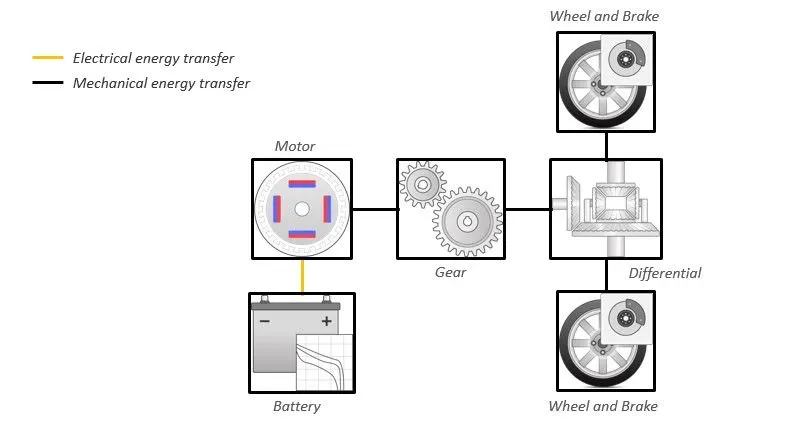
- A Battery Electric Vehicle or Pure Electric Vehicle is an EV that exclusively uses chemical energy stored in rechargeable battery packs with no secondary source of propulsion (eg. hydrogen fuel cell, internal combustion engine, etc.) of energy.
- BEV's uses electric motors and motor controllers instead of a conventional internal combustion engine for propulsion. They drive all power from battery packs.
- So they don't produce any emission of waste gas and they are eco friendly.
- They also have their own limitations such as range etc.
- Example of a Pure EV is Nissan Leaf.
3
Now, comparing both the Pure Electric and Hybrid Electric Vehicle with the gives conditions in a simulation to observe the behavior of both the types.
Part-1
Simulation Situation:
The simulation is done for a Pure electric vehicle with a Wide Open Throttle drive cycle.
The Total cycle time=100 seconds
The Top speed of this cycle = 70 mph
Time to start deceleration =40seconds
The Grade angle =0 degrees
The wind velocity=0 m/s
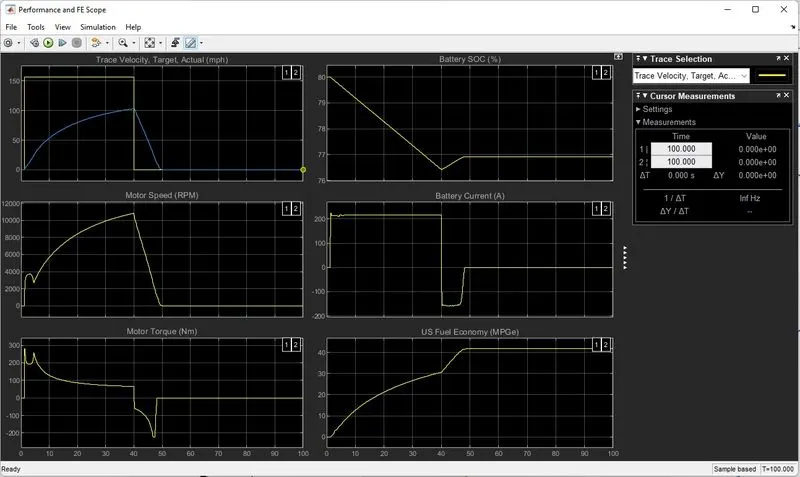
- The above figure shows the results for the man and there are six plots in them.
- Each plot shows a particular result and the plots are made in such a way that, there is a cursor measurement and if we change the cursor position, the cursor moves on to the other plots too, which paves the way to study the result.
- The cursor enables us to study the behavior of another result parameter better way corresponding to the acceleration of the vehicle.
Plot 1:
Shows the velocity of the vehicle with respect to the Drive cycle data with the Time scale on the X-axis.
The acceleration time to reach a top speed of 103.4 mph= 40.2 seconds.
The deceleration time from 103.4 mph to a minimum of 9.8 seconds.
Plot 2:
Shows the changes in the speed of the Motor in RPM throughout the drive cycle.
Peak Motor speed=1123 Rpm
Plot 3:
Shows the Torque characteristics cycle,
Peak Motor turque=280 Nm
Plot 4:
Shows the Battery Current values (A) and its changes for various acceleration per the Drive cycle.
The peak current discharge from the battery= 216.8 A
The peak current charging to the battery==158.7 A
Plot 5:
Shows the Battery state of SOC (%) and its changes corresponding to the driving charge inputs.
The state of charge decreased from 80% to 76.5% of charge in a time period of 40.3 seconds, for the specified driving conditions.
Plot 6
Shows the Equivalent Fuel Economy and Mile per Gallons for the corresponding input driving conditions.
Here, there is no fuel in the pure electric vehicle, however this gives equivalent battery energy required that of the fuel energy and calculates the fuel efficiency.
The maximum miles that the car can run per gallon of fuel equivalent to 20.45 Miles for the given vehicle at the specified driving conditions.
Part-2
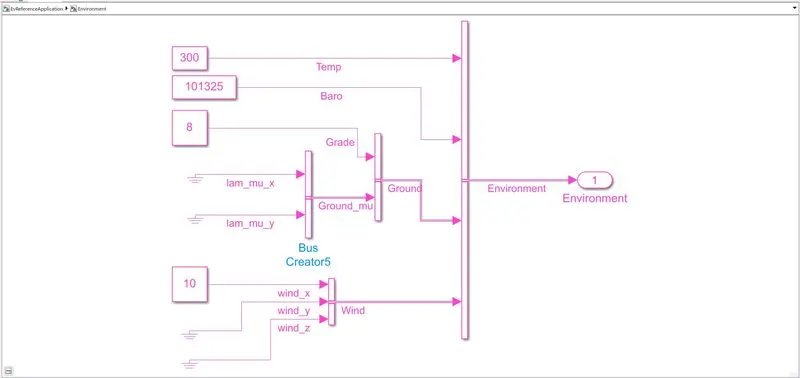
Simulation Situation:
The simulation is done for a Pure Electric Vehicle with a Wide Open Throttle drive cycle.
The Total cycle time=100 seconds
The Top speed of this cycle = 70 mph
Time to start deceleration =40seconds
The Grade Angle =6 degrees
The Wind Velocity=8 m/s
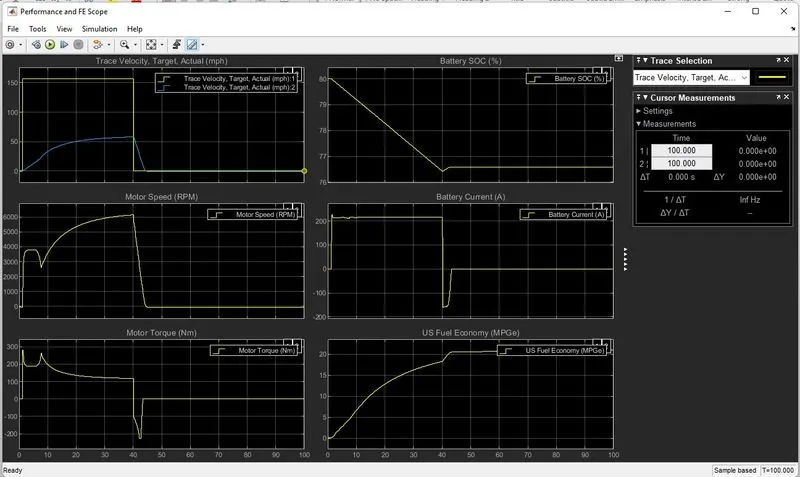
Plot 1:
Shows the velocity of the vehicle with respect to the Drive cycle data with the Time scale on X-axis.
The top speed of 70 mph cannot be achieved, as we have some additional forces acting on the car can only run up to 57.9 mph.
The acceleration time to reach a top speed of 57.9 mph to 40.1 seconds.
The deceleration time from 57.9 mph to minimum = 4.31 seconds.
Plot 2:
Shows the changes in the speed of the engine, motor and Generator in aim throughout the drive cycle.
Peak Motor speed=6254 Rpm
Plot 3:
Shows the Torque characteristics and its changes of engine motor and generator in (Nm) throughout the drive cycle.
Peak Motor torque=280.4 Nm.
Plot 4:
Shows the Battery Current values (A) and its changes for various per the Drive cycle.
The peak current discharge from the battery=225.8 A
The peak current charging to the battery=-159.1 A
Plot 5:
Shows the battery state of charge SOC (%) and its changes corresponding to the driving inputs.
The state of charge decreased from 80% to 76.5% of charge in a time period of 35 seconds, for the specified driving conditions.
Plot 6:
Shows the Equivalent Fuel Economy as Mile per Gallons for the corresponding input driving conditions.
Here there is no fuel in the pure electric vehicles however this gives equivalent battery energy required that of the fuel energy and calculates the Fuel efficiency.
The maximum miles that the car can run per gallon of fuel equivalent to 21.45 Miles, for the given vehicle at the specified driving conditions.
Observation (Pure Electric VS Hybrid Vehicle with Same Load Conditions):
- The electric vehicle when contrasted and a mixture of electric vehicles with the equivalent ecological and Drive cycle conditions brings about less maximum velocity accomplishment. The electric vehicle delivers more upsides of Motor speed and engine force contrasted with the half breed vehicle's engine alone, however, crossover vehicle when it joins the force of both engine and its motor it is higher than the electric vehicle's force. This is capable to pull the Hybrid vehicle at a higher maximum velocity contrasted with the unadulterated electric
- As the unadulterated electric vehicle here utilizes a Lithium-particle battery contrasted with the Nickel-metal hydride battery the releasing limit and the pace of charging is higher in the unadulterated electric vehicle. As it can release at a quick rate the engine can deliver a high measure of force immediately contrasted with the mixture vehicle. Likewise, the condition of charge shows the battery productivity of the unadulterated electric to be higher than the mixture vehicle and this is additionally because of the battery type utilized in these vehicles/
- The effectiveness of the Electric vehicle is higher than the crossover vehicle which is apparent from the miles per gallon quantities of both of these vehicles.
- The electric vehicle produces zero outflows while the half breed one's produce squanders gas discharges. These are a portion of the perceptions from the examination of the above recreations utilizing Powertrain Blockset.