Project - Data Handling and Interpolation
Project : Answer :
m- script :
a = xlsread('VI.xlsx') % xlsread file
v = a(:,1) % varible data
i = a(:,2) %varible data
x = -17.3: 0.1 :0.9
y = interp1(v,i,x) %interpuletd data
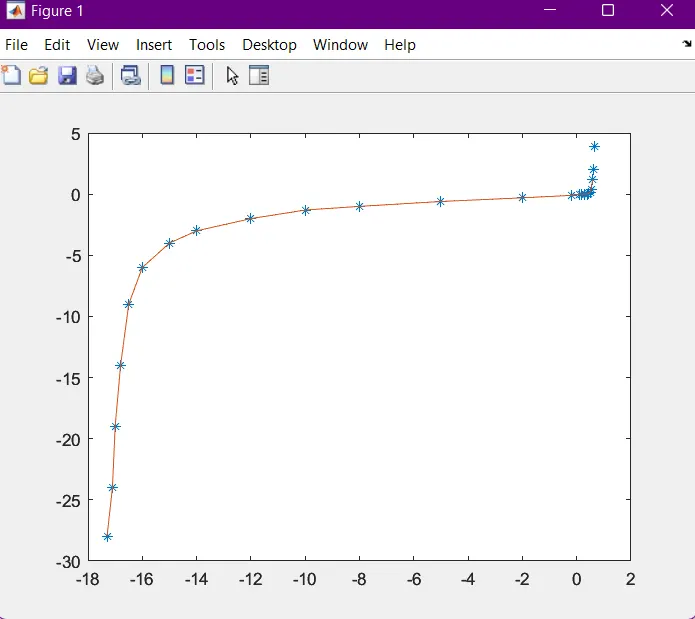
plot(v,i,'*',x,y) %ploting
iv = [-17.2
-13
-11
-9
-6
-1
0.11
0.25
0.5
0.61
0.66 ]
ii = interp1 (v,i,iv)
filename = fopen('Interpolate_data.txt','w')
fprintf(filename, '%f %f\n', 'iv','ii')
fclose(filename)
show in result :
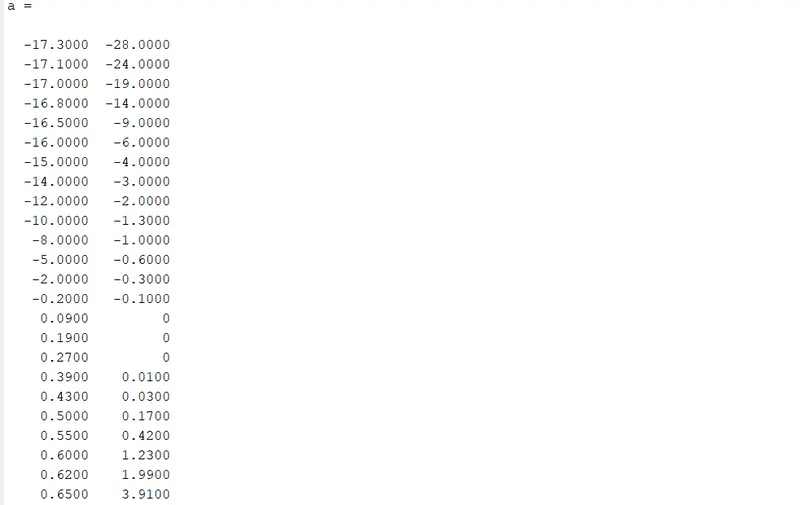
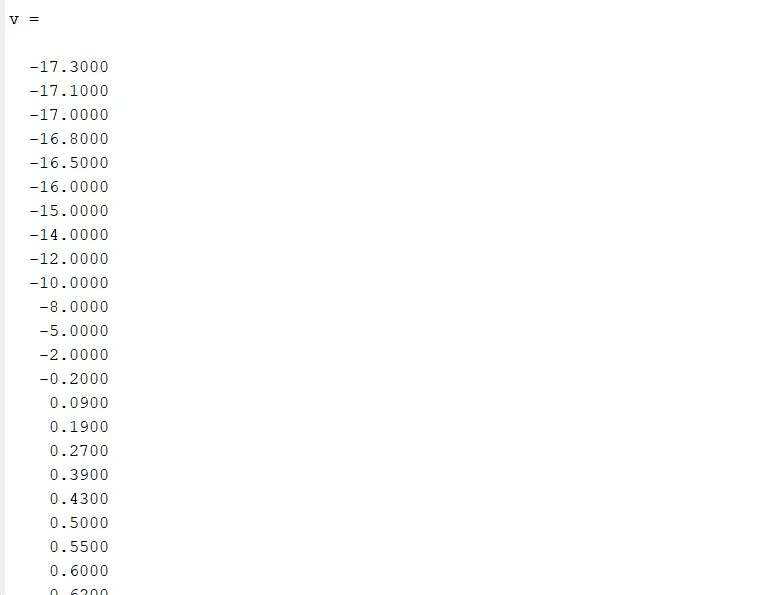
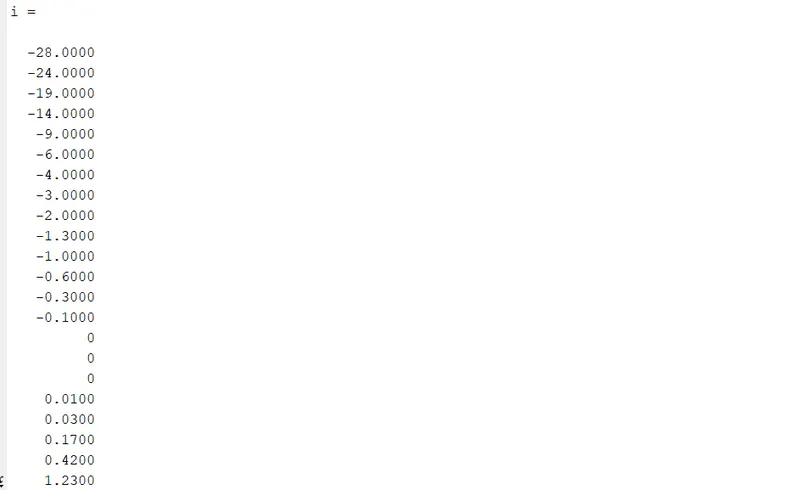
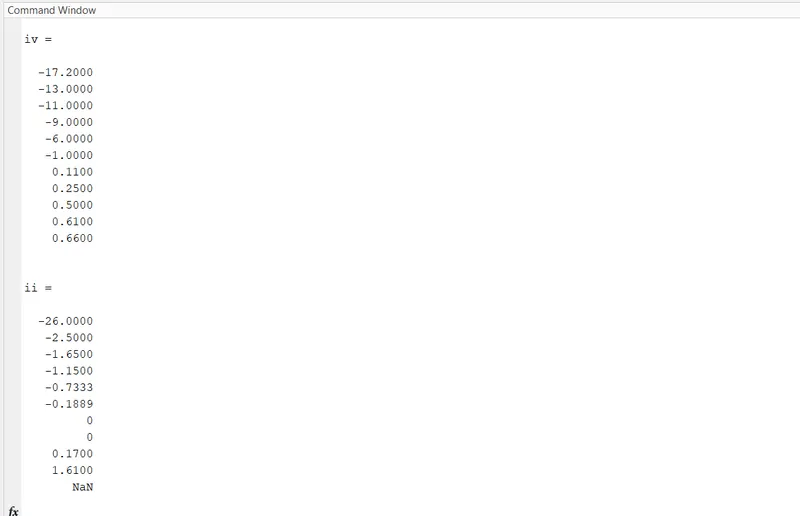
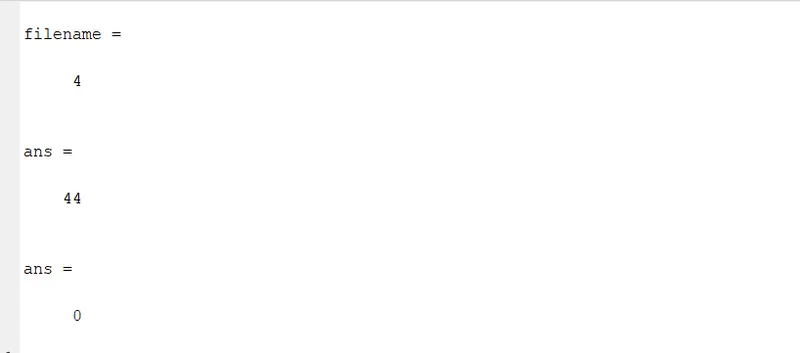
figure :