Project - Data Handling and Interpolation
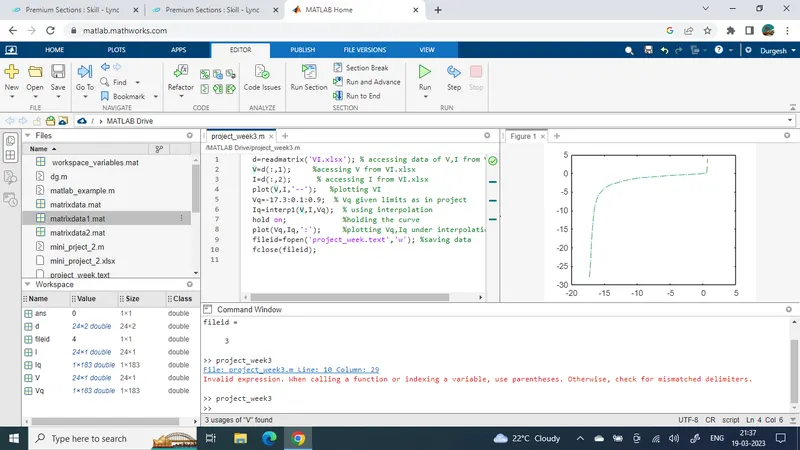
d=readmatrix('VI.xlsx');     % accessing data of V,I from VI.xlsx
V=d(:,1);                    %acessing V from VI.xlsx
I=d(:,2);                    % accessing I from VI.xlsx
plot(V,I,'--');               %plotting VI
Vq=-17.3:0.1:0.9;             % Vq given limits as in project
Iq=interp1(V,I,Vq);           % using interpolation
hold on;                      %holding the curve
plot(Vq,Iq,':');              %plotting Vq,Iq under interpolation
fileid=fopen('project_week.text','w');      %saving data
fclose(fileid);
save project_week3.m