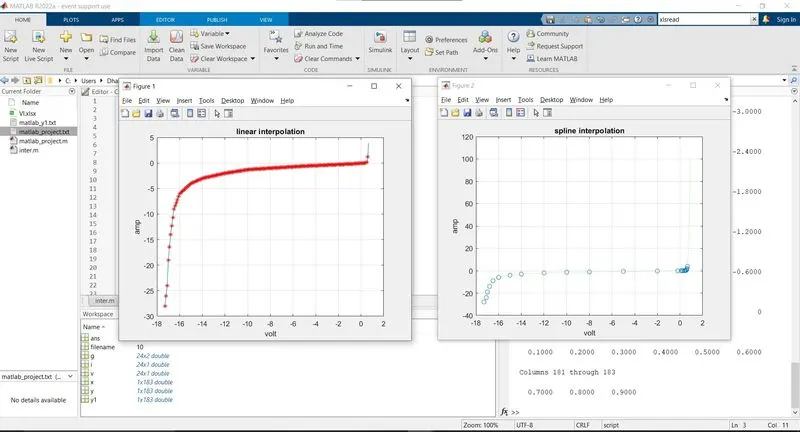
Project - Data Handling and Interpolation
1.
Program:
clear all;
clc;
close all;
g=readmatrix('VI.xlsx') %read the excel file using readmatrix command
v=g(:,1)
i=g(:,2)
x=-17.3:0.1:0.9
y=interp1(v,i,x,'linear'); %2d interpolating the values in linear format
y1=interp1(v,i,x,'spline'); %2d interpolating the values in spline format
figure(1)
plot(v,i,x,y,'*r')
grid on;
xlabel('volt')
ylabel('amp')
title('linear interpolation')
figure(2)
plot(v,i,'o',x,y1,'g:')
grid on;
xlabel('volt')
ylabel('amp')
title('spline interpolation')
filename=fopen('matlab_project.txt','w');
fprintf(filename,'%d \n',y);
filename=fopen('matlab_y1.txt','w');
fprintf(filename,'%d \n',y1);
fclose(filename);
output: