Project - Data Handling and Interpolation
Code :
values = xlsread("VI.xlsx");
x1 = values(:,1);
x2 = values(:,2);
P = x1.*x2;
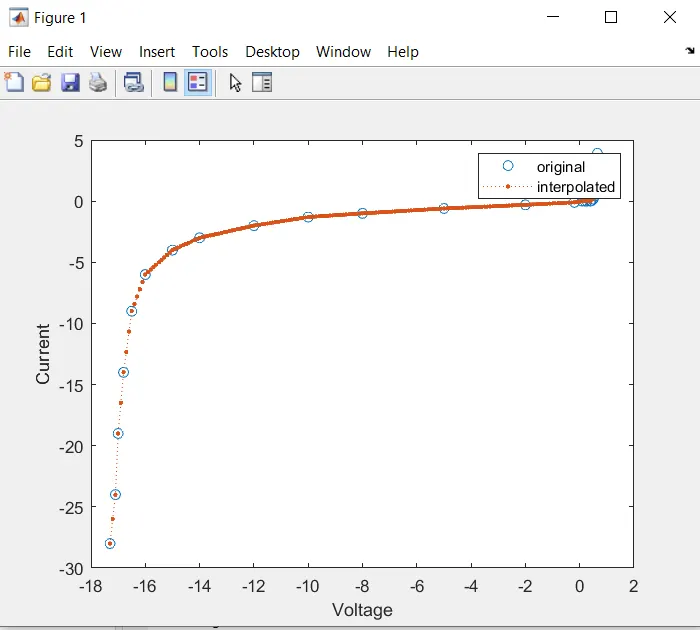
xq = [-17.3:0.1:0.9];
yq = interp1(x1,x2,xq);
figure(1);
plot(x1,x2,'o',xq,yq,':.');
xlabel('Voltage');
ylabel('Current');
legend('original','interpolated');
fileID = fopen('New values.txt', 'w');
fprintf(fileID,'Interpolated data included\n\n');
fprintf(fileID,'%6.2f %12.2f\n', xq,yq);
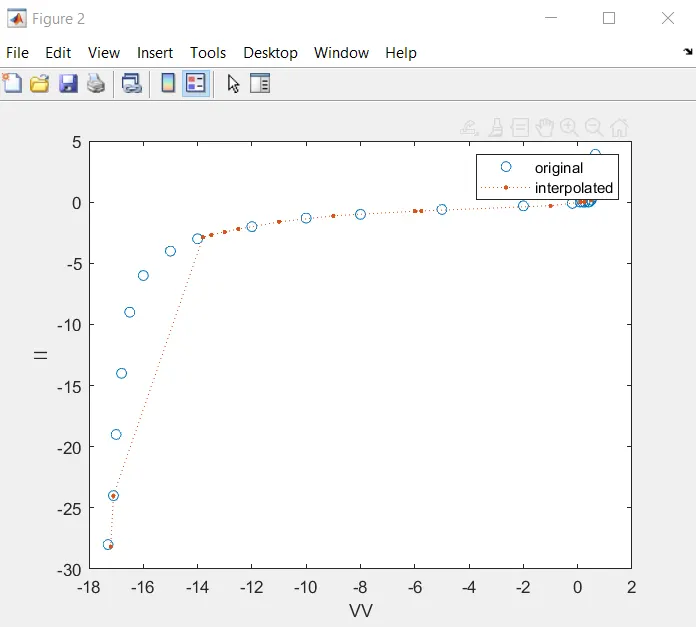
VV =[-17.2 -17.1 -13.8 -13.5 -13.0 -12.5 -11 -9 -5.76 -6 -1 0.11 0.25 0.5 0.61]';
II = interp1(x1,x2,VV,'spline');
figure(2);
plot(x1,x2,'o',VV,II,':.');
xlabel('VV');
ylabel('II');
legend('original','interpolated');
fileID = fopen('Missing values.txt', 'w');
fprintf(fileID,'Interpolated data included\n\n');
fprintf(fileID,'%6.2f %12.2f\n', VV,II);
fclose(fileID);
OUTPUT :