Project - Data Handling and Interpolation
Project: Interpolated data for laboratory experiment on VI characteristics.
MATLAB Code -
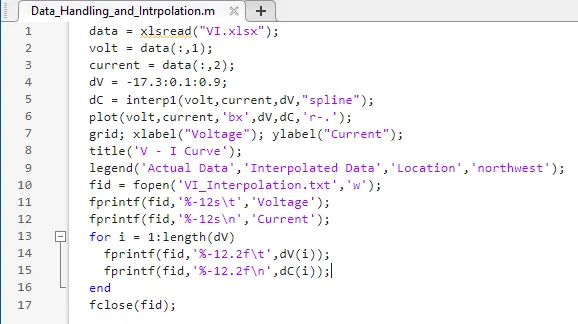
>> data = xlsread ("VI.xlsx"); % reading data from excel file
>> volt = data (:,1); % assigning column 1 all rows data to volt array
>> current = data (:,2); % assigning column 2 all rows data to current array
>> dV = -17.3 : 0.1 : 0.9; % sample time interval
>> dC = interp1 (volt, current, dV, "spline"); % data interpolation using interp1 function & spline method
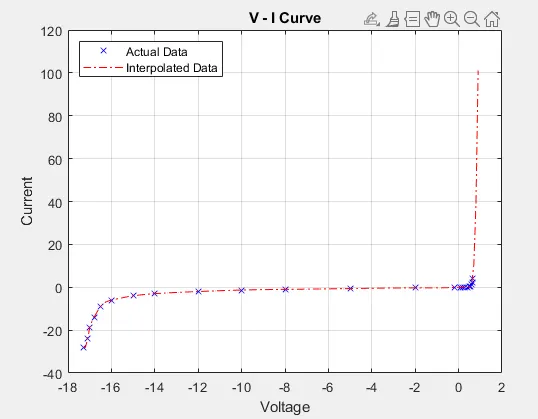
>> plot (volt, current, 'bx', dV, dC, 'r-.'); % plotting graph for actual & interpolated data
>> grid; % grid ON
>> xlabel ("Voltage"); ylabel ("Current"); % giving label to x & y axis
>> title ('V - I Curve'); % giving title to the plot
>> legend ('Actual Data', 'Interpolated Data, 'Location', 'northwest'); % giving legend to the plot
>> fid = fopen('VI_Interpolation.txt','w'); % open file to write data
>> fprintf (fid, '%-12st', 'Voltage'); % writing 'Voltage' heading to file with format specifiers & horizontal tab character
>> fprintf (fid, '%-12sn', 'Current'); % writing 'Current' heading to file with format specifier & new line character
>> for i = 1:length(dV) % for loop to store all values of dV vs dC to file
fprintf (fid, '%-12.2ft', dV(i)); % store voltage value upto 2 decimal places
fprintf (fid, '%-12.2fn', dC(i)); % store current value upto 2 decimal places
end % ending of for loop
>> fclose (fid); % closing the file
VI Plot (Actual Data vs Interpolation Data) -