Project - Data Handling and Interpolation
MATLAB Basics Project - Data Handling and Interpolation
Project : In a laboratory experiment, data of voltage and current has been recorded and the same is attached in an excel file ( Click on this link VI.xlsx ). Read the excel file in the Matlab program and perform the interpolation in the range of -17.3:0.1:0.9. Generate the interactive plot for the interpolated data and store them in a text file.
Solution:
Steps followed:
- From the given link in the problem statement, the experimental records of Voltage and Current saved in an excel file is downloaded and the file is saved in the same pathway as that of the Matlab program.
- The experimental data of voltage and current are loaded from the excel file using the command 'xlsread', and they are saved in vector variables V_exp and I_exp respectively.
- According to the given problem statement, the range of Voltage is chosen as [-17.3:0.1:0.9] for performing the interpolation, and it is stored in a vector variable 'V_interp'.
- As it is a two dimensional interpolation, therefore 'interp1' command is used to get the corresponding interpolated Current datas in the entire voltage range as specified above, and it is stored in a vector variable 'I_interp'.
- The graphs of the experimental Voltage-Current values and the interpolated datas are plotted in a same figure titled as 'Voltage and Current interpolation' and the plot is saved as an image file named 'VI_interpolation.jpg'.
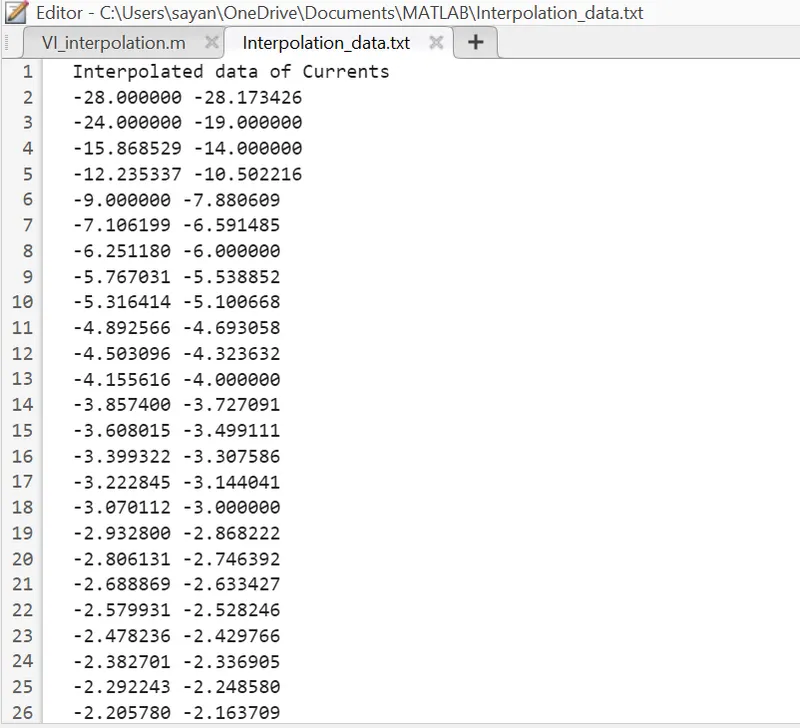
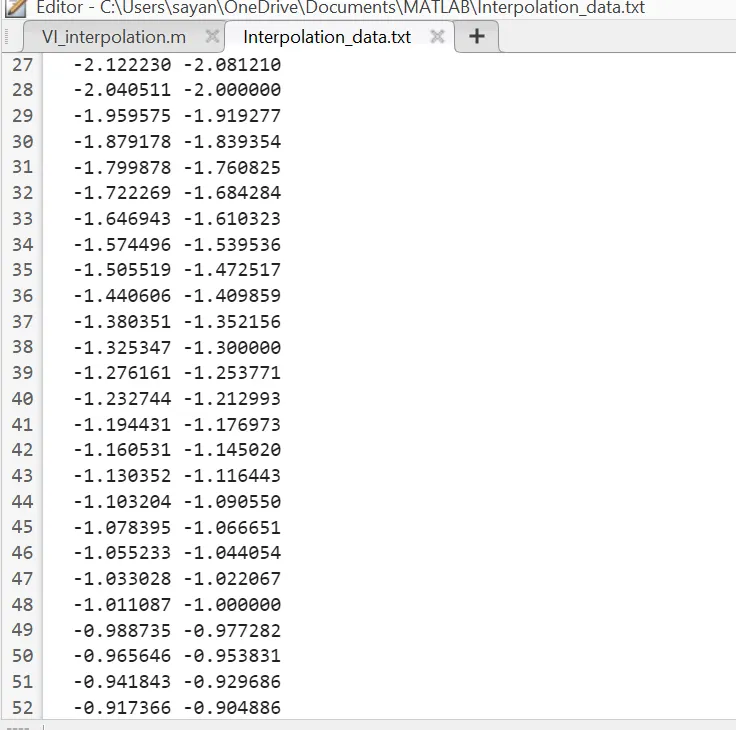
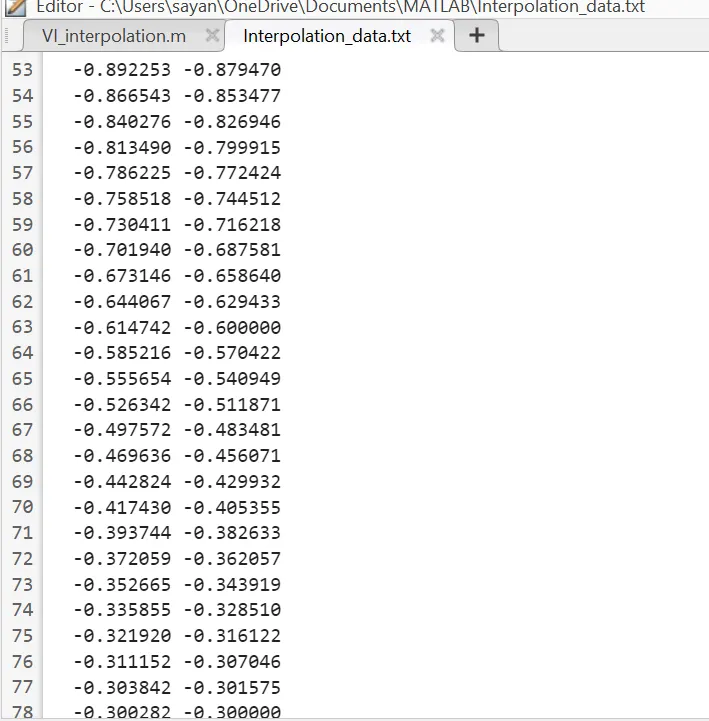
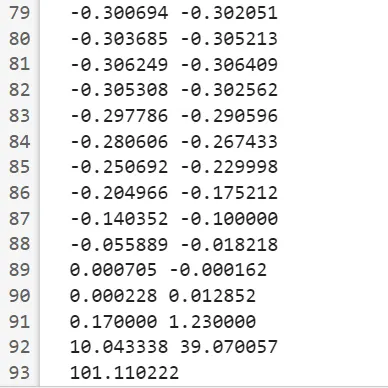
- Next, the interpolated datas of current are stored in a text file named as 'Interpolation_data.txt'.
Matlab Code:
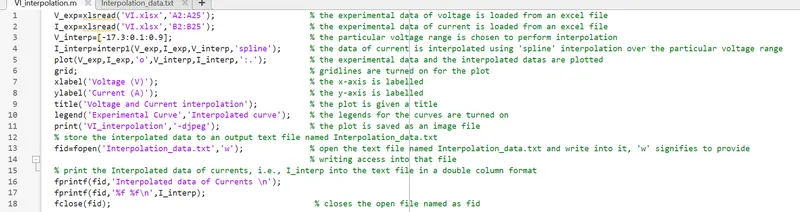
V_exp=xlsread('VI.xlsx','A2:A25'); % the experimental data of voltage is loaded from an excel file
I_exp=xlsread('VI.xlsx','B2:B25'); % the experimental data of current is loaded from an excel file
V_interp=[-17.3:0.1:0.9]; % the particular voltage range is chosen to perform interpolation
% the data of current is interpolated using 'spline' interpolation over the particular voltage range
I_interp=interp1(V_exp,I_exp,V_interp,'spline');
% the experimental data and the interpolated datas are plotted
plot(V_exp,I_exp,'o',V_interp,I_interp,':.');
grid; % gridlines are turned on for the plot
xlabel('Voltage (V)'); % the x-axis is labelled
ylabel('Current (A)'); % the y-axis is labelled
title('Voltage and Current interpolation'); % the plot is given a title
legend('Experimental Curve','Interpolated curve'); % the legends for the curves are turned on
print('VI_interpolation','-djpeg'); % the plot is saved as an image file
% store the interpolated data to an output text file named Interpolation_data.txt
% open the text file named Interpolation_data.txt and write into it, 'w' signifies to provide writing %access into that file
fid=fopen('Interpolation_data.txt','w');
% print the Interpolated data of currents, i.e., I_interp into the text file in a double column format
fprintf(fid,'Interpolated data of Currents \n');
fprintf(fid,'%f %f\n',I_interp);
fclose(fid); % closes the open file named as fid
Output:
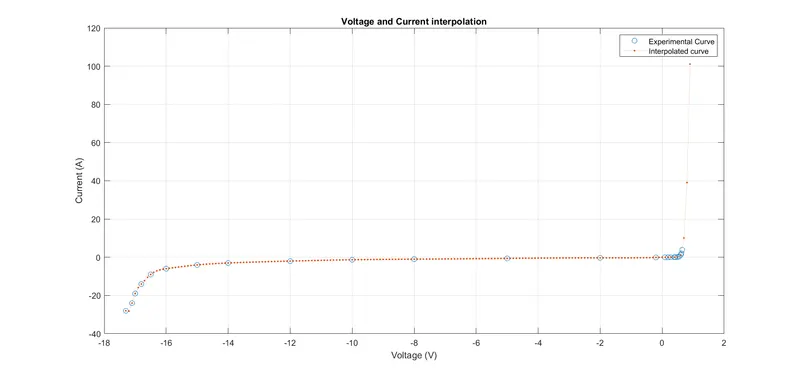
The above figure shows the plots between the experimental values of Voltage and Current, and the interpolated graph between Voltage and Current.
The following figures show the interpolated current datas saved in a .txt file.
Conclusion: In this project, first, the experimental values of the voltage and current are loaded into Matlab from an excel file, and then a particular voltage range is chosen over which the missing current values are found out using the interpolation method. Both the experimental and the interpolated graphs between the voltage and current are plotted, and it is saved as an image file. The interpolated datas of current are stored in a text file. The Matlab program file, the image file of the plot, and the text file are attached herewith.