Project - Data Handling and Interpolation
Project :
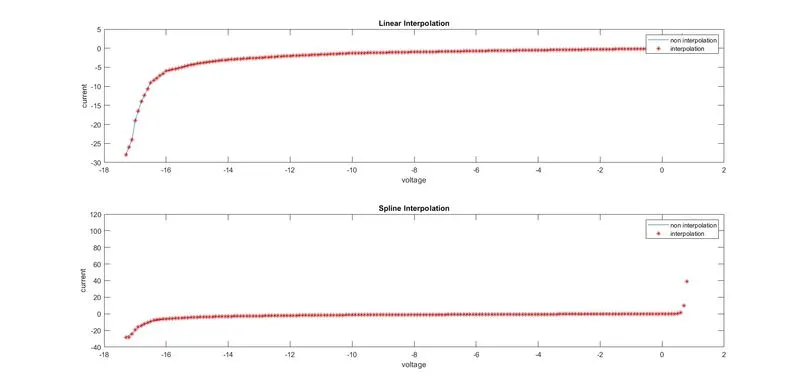
In a laboratory experiment, data of voltage and current has been recorded and the same is attached in an excel file ( Click on this link VI.xlsx ). Read the excel file in the Matlab program and perform the interpolation in the range of -17.3:0.1:0.9. Generate the interactive plot for the interpolated data and store them in a text file.
Ans.
VI=xlsread("VI.xlsx"); % importing the data from excel to current folder and workspacev=VI(:,1); % seperation of first collum in the excel sheet
i=VI(:,2); % seperation of second collum in the excel sheet
vq=-17.3:0.1:0.9; % creating the interpolation range
Iq=interp1(v,i,vq,'linear'); % creating the linear interpolation using interp1 function
Iq2=interp1(v,i,vq,'spline'); % creating the spline interpolation using interp1 function
subplot (211);plot(v,i,vq,Iq,'r*'); % assigning the subplot and ploting the liner interpolation using " v,i,vq,Iq"
title('Linear Interpolation'); % assigning the title to the graph
xlabel('voltage');ylabel('current'); % assigning the x and y coordinates to graph
legend('non interpolation','interpolation'); % assigning the names to graphs
subplot (212);plot(v,i,vq,Iq2,'r*') % assigning the subplot and ploting the spline interpolation using " v,i,vq,Iq"
title('Spline Interpolation') % assigning the title to the graph
xlabel('voltage');ylabel('current'); % assigning the x and y coordinates to graph
legend('non interpolation','interpolation'); % assigning the names to graphs