Project - Data Handling and Interpolation
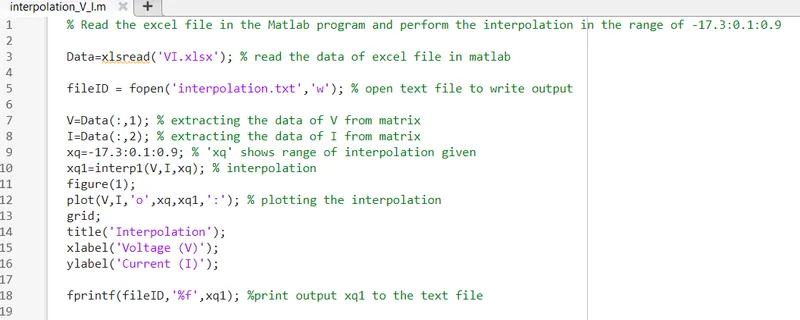
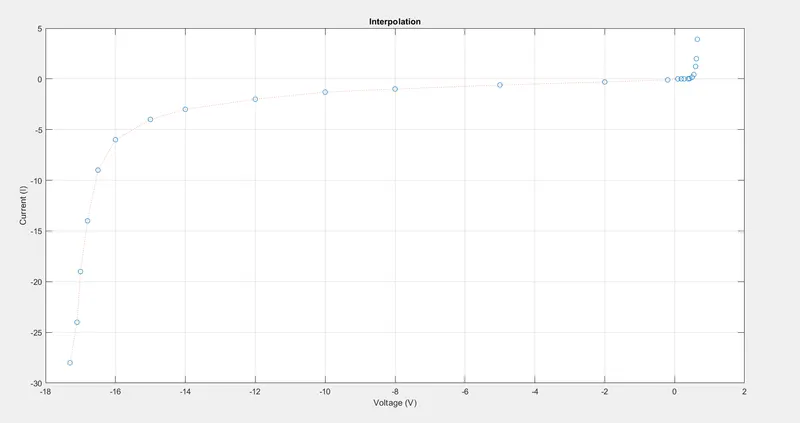
Q. Read the excel file in the Matlab program and perform the interpolation in the range of -17.3:0.1:0.9. Generate the interactive plot for the interpolated data and store them in a text file.
Matlab Code:
Graph Output:
Text format Output:
