Project - Data Handling and Interpolation
Qustion (matlab project):In a laboratory experiment, data of voltage and current has been recorded and the same is attached in an excel file ( VI.xlsx ). Read the excel file in the Matlab program and perform the interpolation in the range of -17.3:0.1:0.9. Generate the interactive plot for the interpolated data. Additionally, compute the current values for given voltages below and store them in a text file.
ANS:
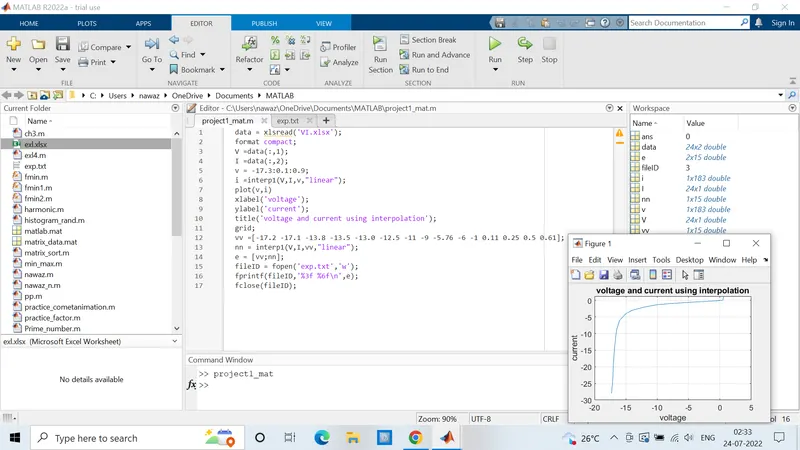
data = xlsread('VI.xlsx');
format compact;
V =data(:,1);
I =data(:,2);
v = -17.3:0.1:0.9;
i =interp1(V,I,v,"linear");
plot(v,i)
xlabel('voltage');
ylabel('current');
title('voltage and current using interpolation');
grid;
vv =[-17.2 -17.1 -13.8 -13.5 -13.0 -12.5 -11 -9 -5.76 -6 -1 0.11 0.25 0.5 0.61];
nn = interp1(V,I,vv,"linear");
e = [vv;nn];
fileID = fopen('exp.txt','w');
fprintf(fileID,'%3f %6f\n',e);
fclose(fileID);
exp data:
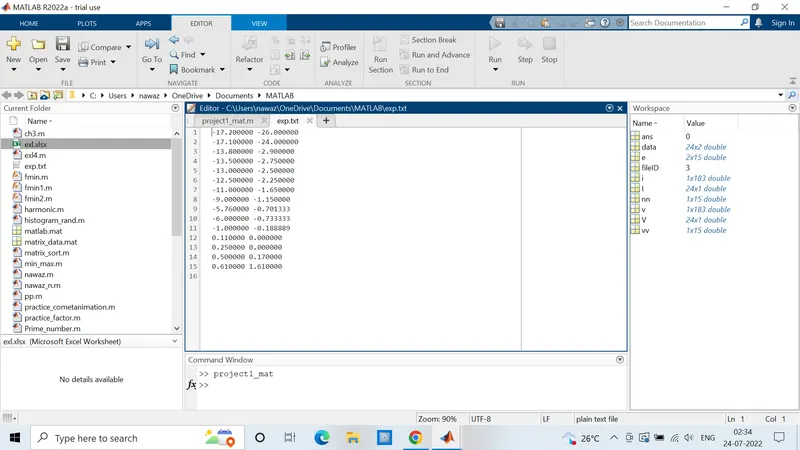
-17.200000 -26.000000
-17.100000 -24.000000
-13.800000 -2.900000
-13.500000 -2.750000
-13.000000 -2.500000
-12.500000 -2.250000
-11.000000 -1.650000
-9.000000 -1.150000
-5.760000 -0.701333
-6.000000 -0.733333
-1.000000 -0.188889
0.110000 0.000000
0.250000 0.000000
0.500000 0.170000
0.610000 1.610000
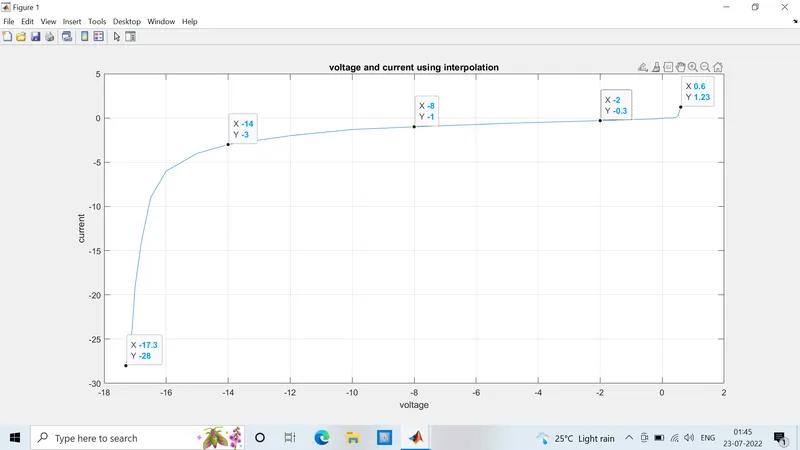
Waveform(Plot):
NOTE: attached screenshots and codes. give me max marks...........Thanks.