clear all;
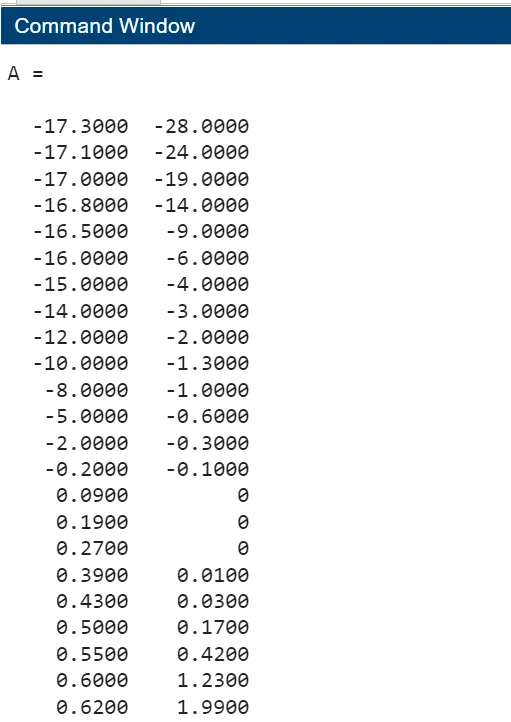
A=xlsread('VI.xlsx') % xlsreads the saved file in matlab
V=A(:,1)      % Column A is for voltage
I=A(:,2)     %  A column B is for current
V1=[-17.3:0.1:0.9]   % inter polatation range
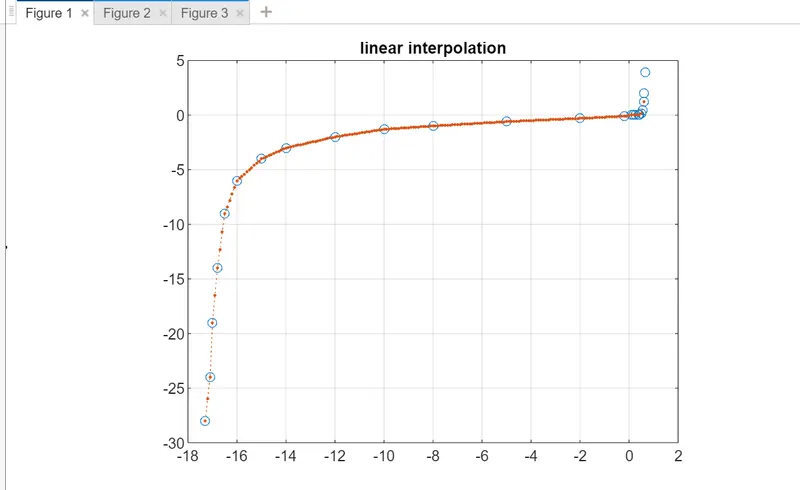
Ib1=interp1(V,I,V1)  % lilnear inter polatation
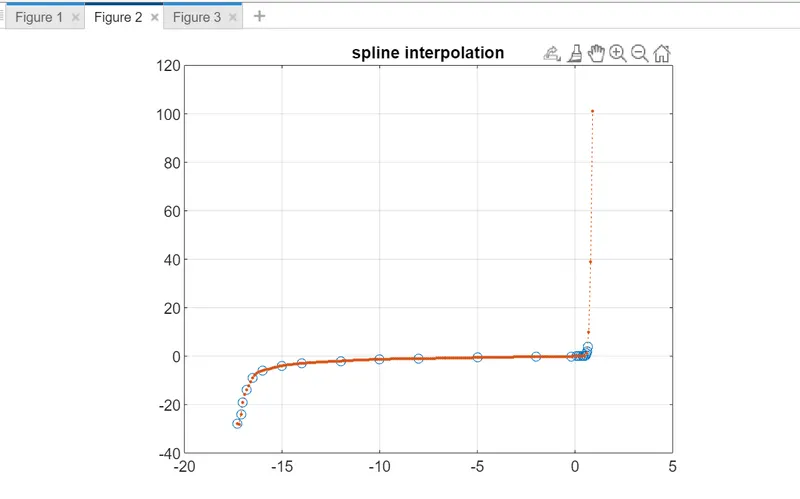
Ib2=interp1(V,I,V1,'spline') %spline interpolatation
figure(1)
plot(V,I,'O',V1,Ib1,':.')  %plot linear interpolatation
grid
title('linear interpolation')
figure(2)
plot(V,I,'O',V1,Ib2,':.') %plot spline interpolatation
grid
title('spline interpolation')
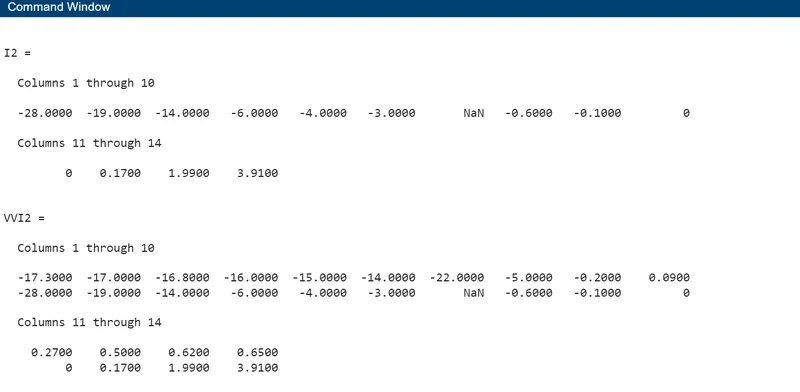
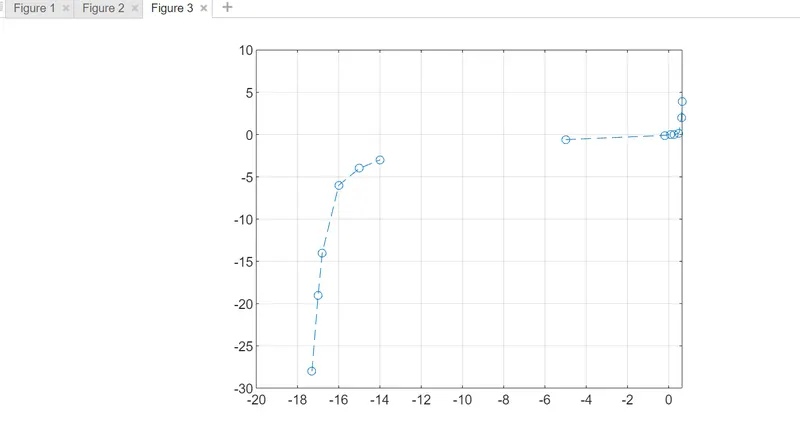
VV=[-17.3 -17.0 -16.8 -16.0 -15.0 -14.0 -12.0-10.0 -5.0 -0.20 0.09 0.27 0.50 0.62 0.65]%random new voltage
I2=interp1(V,I,VV) %linear interpolation for find value of current
figure(3)
plot(VV,I2,'O--') %  plot linear interpolation for new voltage and current
grid
VVI2=[VV;I2] % save the values in matrix
fid=fopen('I.txt','w') % write to text  file
fclose(fid)