Project - Data Handling and Interpolation
Project :
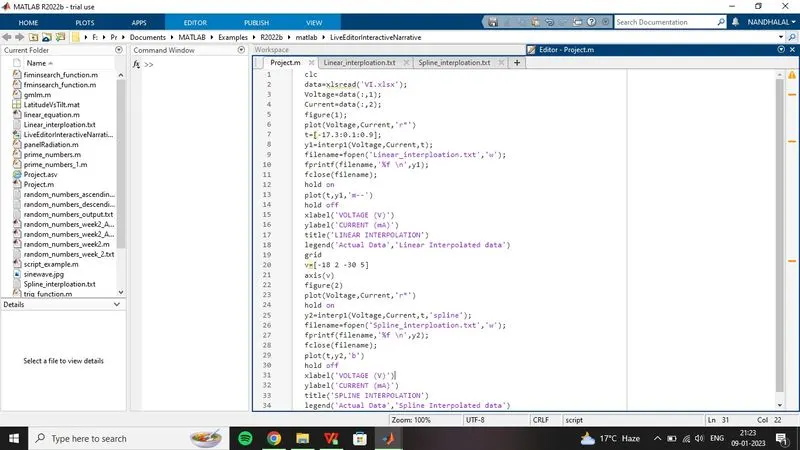
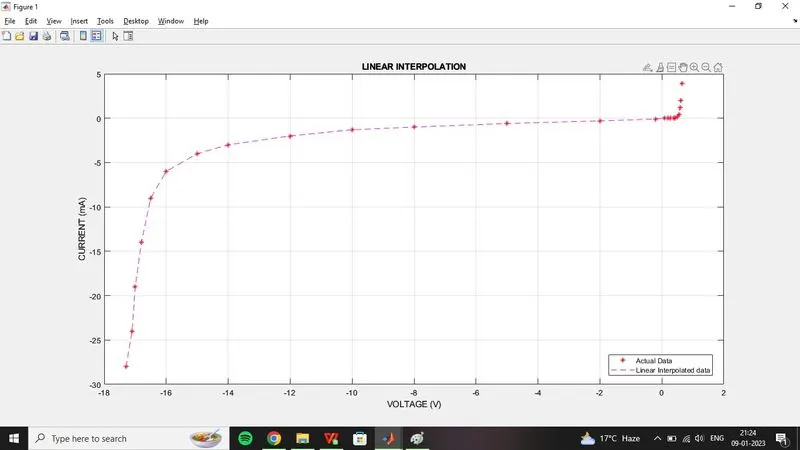
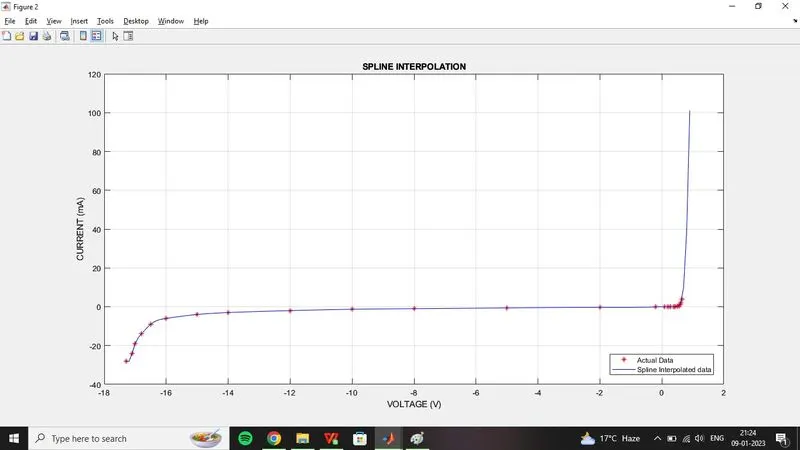
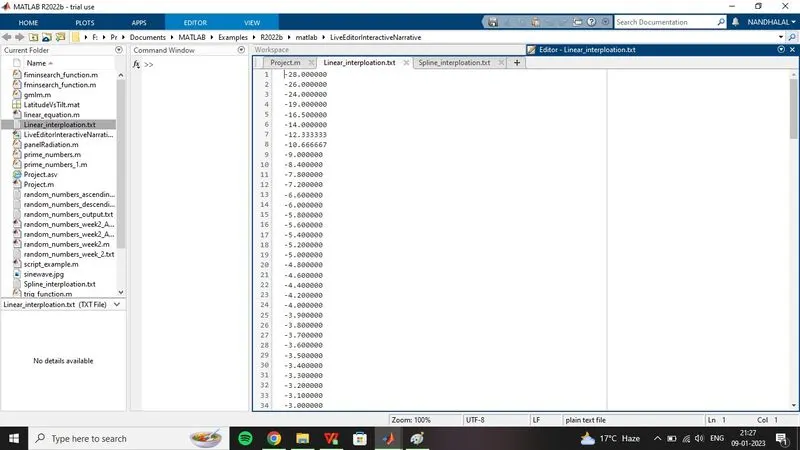
In a laboratory experiment, data of voltage and current has been recorded and the same is attached in an excel file ( Click on this link VI.xlsx ). Read the excel file in the Matlab program and perform the interpolation in the range of -17.3:0.1:0.9. Generate the interactive plot for the interpolated data and store them in a text file.
clc
%clear
data=xlsread('VI.xlsx');
%xlsread command used to read excel file
Voltage=data(:,1);
Current=data(:,2);
figure(1);
plot(Voltage,Current,'r*')
%ploting voltage and current from given data
t=[-17.3:0.1:0.9];
%interpolation range mentioned as t
y1=interp1(Voltage,Current,t);
%interp1 function is used to perform interpolation with voltage, current and t
filename=fopen('Linear_interploation.txt','w');
%interpolated data stored in Linear_interploation.txt file
fprintf(filename,'%f \n',y1);
%fprintf function used to print data of y1 in a text file
fclose(filename);
hold on
%hold function to plot multiple graphs in one figure
plot(t,y1,'m--')
%interpolated data plotted and it defined with magenta colour with -- lines
hold off
xlabel('VOLTAGE (V)')
%xlabel function used to define label for x-axis
ylabel('CURRENT (mA)')
%ylabel function used to define label for y-axis
title('LINEAR INTERPOLATION')
%title function used to give title for the plot
legend('Actual Data','Linear Interpolated data')
%legend function used to categorise two plots
grid
%grid function to grid the plot
v=[-18 2 -30 5]
axis(v)
% axis function to update the axis in lot for a better view
figure(2)
plot(Voltage,Current,'r*')
%ploting voltage and current from given data
hold on
y2=interp1(Voltage,Current,t,'spline');
%interp1 function is used to perform interpolation with voltage, current and t. Spline function used to interpolant piecewise polynomial for analysis
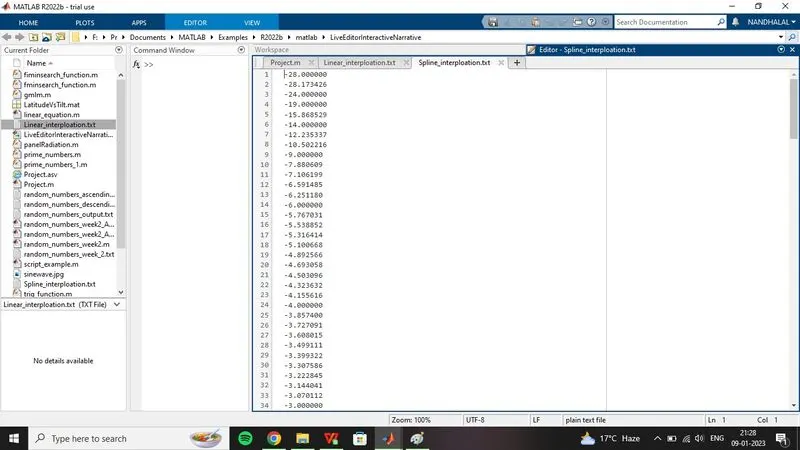
filename=fopen('Spline_interploation.txt','w');
%interpolated data stored in Spline_interploation.txt file
fprintf(filename,'%f \n',y2);
%fprintf function used to print data of y2 in a text file
fclose(filename);
plot(t,y2,'b')
%interpolated data plotted and it defined with blue colour
hold off
xlabel('VOLTAGE (V)')
%xlabel function used to define label for x-axis
ylabel('CURRENT (mA)')
%ylabel function used to define label for y-axis
title('SPLINE INTERPOLATION')
%title function used to give title for the plot
legend('Actual Data','Spline Interpolated data')
%legend function used to categorise two plots
grid