Project - Data Handling and Interpolation
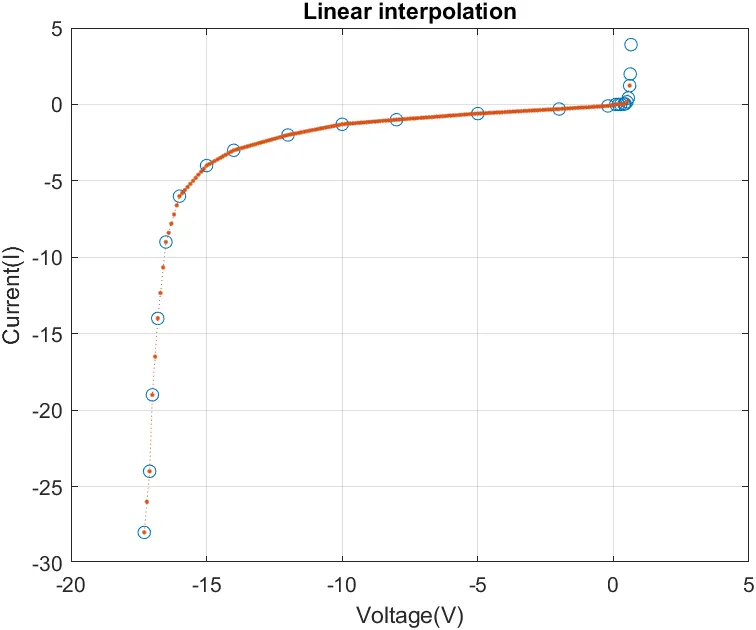
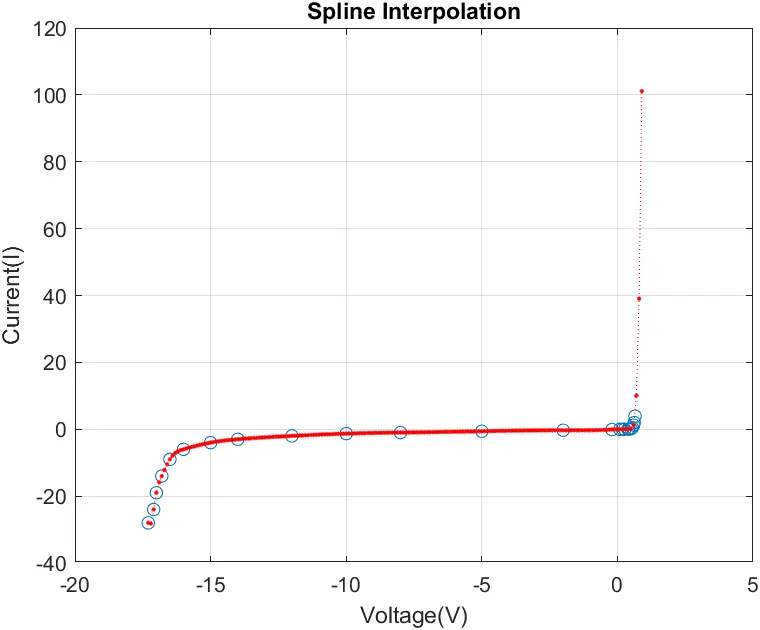
1.In a laboratory experiment, data of voltage and current has been recorded and the same is attached in an excel file ( Click on this link VI.xlsx ). Read the excel file in the Matlab program and perform the interpolation in the range of -17.3:0.1:0.9. Generate the interactive plot for the interpolated data and store them in a text file.
Key Highlights:
- Graphical solutions are more visual and appealing
- Interpolation of data
- Read excel file
- Write to text file
Deliverables:
- Find missing data and save it in text
- Interpolate the data set
- Save your program and attach the same.
Save txt file and upload in attachment
MATLAB CODE:
Z = xlsread('VI.xlsx');

V = Z(:,1); % voltage data
I = Z(:,2); % current data
xq=[-17.3:0.1:0.9];% given interval
yq1 = interp1(V,I,xq); % Linear interpolation
yq2=interp1(V,I,xq,'spline'); % Spline interpolation

figure(1);
plot(V,I,'o',xq,yq1,': .');
grid;
title('Linear interpolation');
xlabel('Voltage(V)');
ylabel('Current(I)');

figure(2);
plot(V,I,'o',xq,yq2,'r: .');
title('Spline Interpolation');
xlabel('Voltage(V)');
ylabel('Current(I)');
grid on;
% % saving the file interpolation data
% open the file
vol_cur = fopen('Voltage_current_output,txt','w');
fprintf(vol_cur,'Voltage  Currentn');
fprintf(vol_cur,'%4.3f  %5.3fn',xq,yq2);% writing the voltage current value
savefig(1,'VIlinear.fig');
savefig(2,'VIspline.fig');
fclose(vol_cur);
RESULT:
OUTPUT: