Project - Data Handling and Interpolation
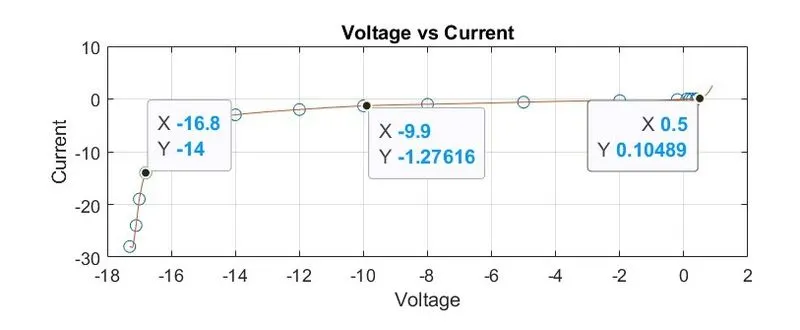
Aim: To perform the interpolation in the range of -17.3:0.1:0.9 by reading the excel file attached, in the Matlab program, and generating the interactive plot for the interpolated data. And also compute the current values for given voltages below and store them in the text file.
VV = [-17.2 -17.1 -13.8 -13.5 -13.0 -12.5 -11 -9 -5.76 -6 -1 0.11 0.25 0.5 0.61]
Procedure:
% Read the excel file in Matlab.
% Interpolate the values in the range of -17.3:0.1:0.9.
% Plot the values, and apply the required annotations like the grid, text, labeling, etc.
% Compute the current values for given voltages and store them in the text file.
Program:
file=xlsread('VI.xlsx');
format compact;
V = file(:,1);
I = file(:,2);
x = (-17.3:0.1:0.9);
y = interp1(V,I,x,'spline');
subplot(211);
plot (V,I,'O',x,y);
grid on
title('Voltage vs Current');
xlabel('Voltage');
ylabel('Current');
grid on
%%%
w=[-17.2
-17.1
-13.8
-13.5
-13
-12.5
-11
-9
-5.76
-6
-1
0.11
0.25
0.5
0.61]
II=interp1(V,I,VV);
z=[VV II]
fileID=FOPEN('VVII.text','w');
fprintf(fileID,'%6.2f%12.8f\n','VV','II');
fprintf(fileID,'%6.2f%12.8f\n',z);
fclose(fileID);
Result:
- Using the Matlab program generated the interactive plot for the interpolated data.
- Computed the current values for given voltages and stored them in the text file.