Project - Data Handling and Interpolation
Ans. Program to load data from excel to matlab
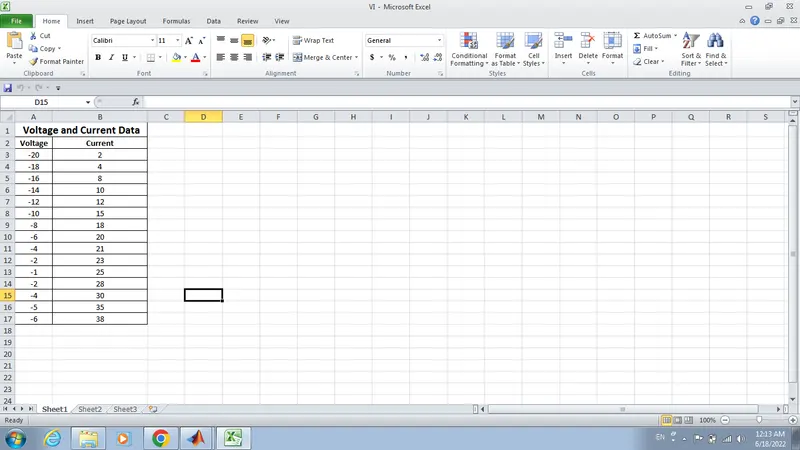
Above is the data in excel file. Values of Current and voltages.
%Program to load data from Excel file to matlab
clear all
clc
VI=xlsread('VI.xlsx');% command to load the data directly
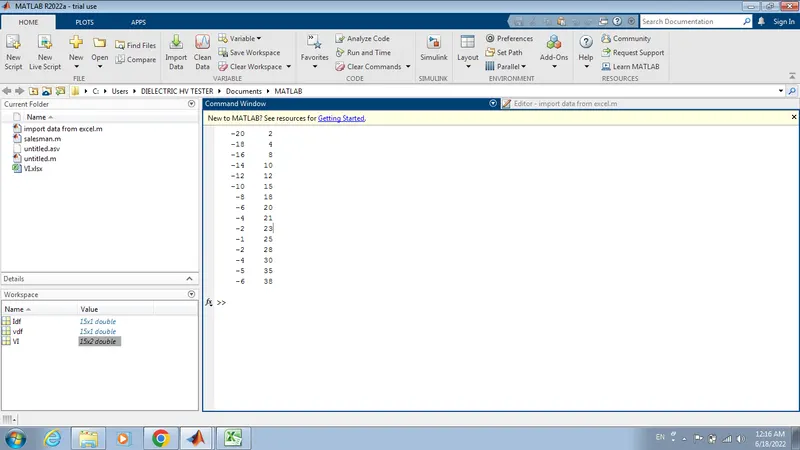
disp(VI)% display result in command window
vdf=VI(:,1);
Idf=VI(:,2);
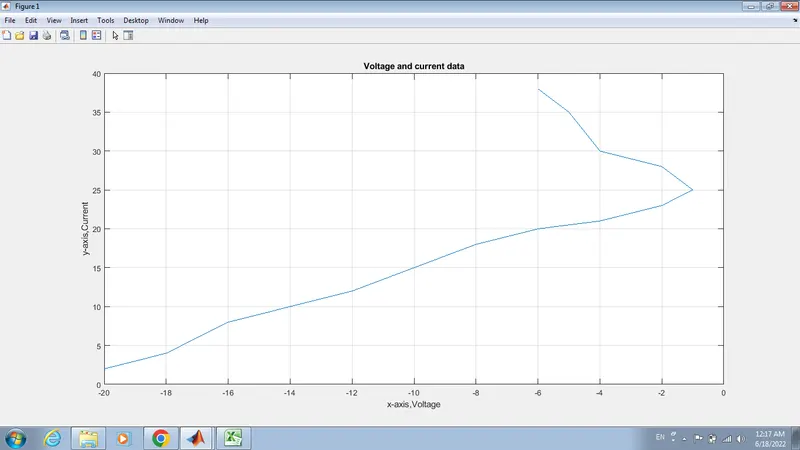
plot(vdf,Idf)% function to plot graph between current and voltage
xlabel('x-axis,Voltage')% name to X-axis as Voltage
ylabel('y-axis,Current')% name to Y-axis as Current
title('Voltage and current data')% title of the Graph
grid
Result.
-20 2
-18 4
-16 8
-14 10
-12 12
-10 15
-8 18
-6 20
-4 21
-2 23
-1 25
-2 28
-4 30
-5 35
-6 38
diary voltagedata1.txt % to save data in .txt format
% Current and voltage data
clear all
clc
V= -17.3:0.9; % Voltage range as given in question
I= [2 4 6 8 10 12 14 16 18 20 22 24 26 28 30 32 34 36 38]; % current value at different voltage
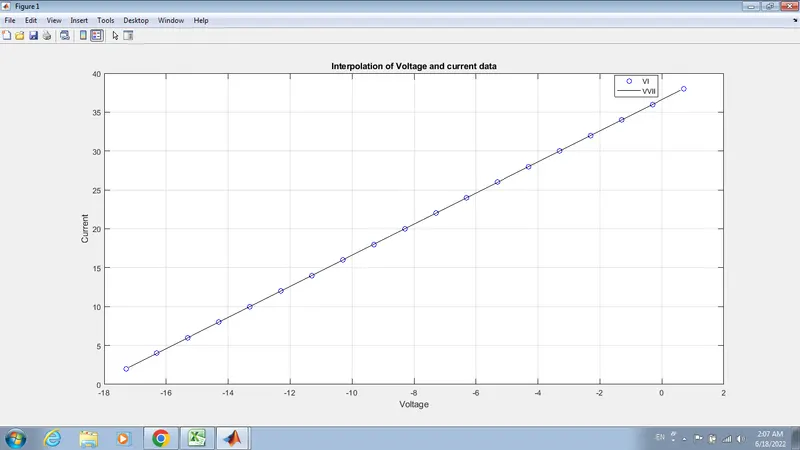
plot(V,I,'bo'); % plotting graph b/w Voltage and current
hold on;
% interpolation of Data
VV=[-17.2 -17.1,-13.8,-13.5,-13.0,-12.5,-11,-9,-5.76,-6,-1,0.11,0.25,0.5,0.61];
% Above VV is the voltages at which we need to find the value of current
II=spline(V,I, VV); % interpolation command using spline
plot(VV,II,'-k') % polting the VV and II with black colour
xlabel('Voltage')
ylabel('Current')
title('Interpolation of Voltage and current data')
grid
legend('VI','VVII')
ans.
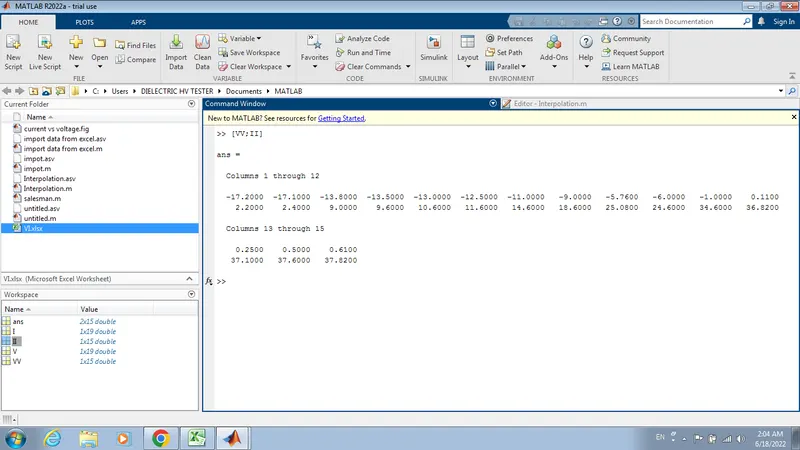
>> [VV;II]
ans =
Columns 1 through 12
-17.2000 -17.1000 -13.8000 -13.5000 -13.0000 -12.5000 -11.0000 -9.0000 -5.7600 -6.0000 -1.0000 0.1100
2.2000 2.4000 9.0000 9.6000 10.6000 11.6000 14.6000 18.6000 25.0800 24.6000 34.6000 36.8200
Columns 13 through 15
0.2500 0.5000 0.6100
37.1000 37.6000 37.8200