Project - Data Handling and Interpolation
1,
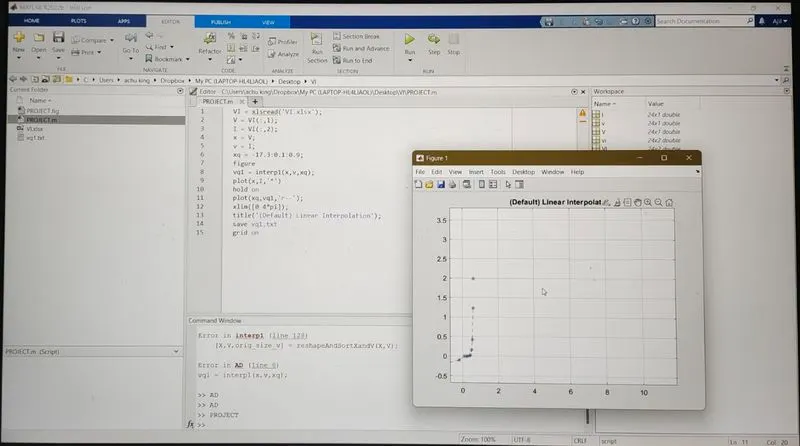
VI = xlsread('VI.xlsx');
V = VI(:,1);
I = VI(:,2);
x = V;
v = I;
xq = -17.3:0.1:0.9;
figure
vq1 = interp1(x,v,xq);
plot(x,I,'*')
hold on
plot(xq,vq1,'r--');
xlim([0 4*pi]);
title('(Default) Linear Interpolation');
save vq1.txt
grid on