Project - Data Handling and Interpolation
Project
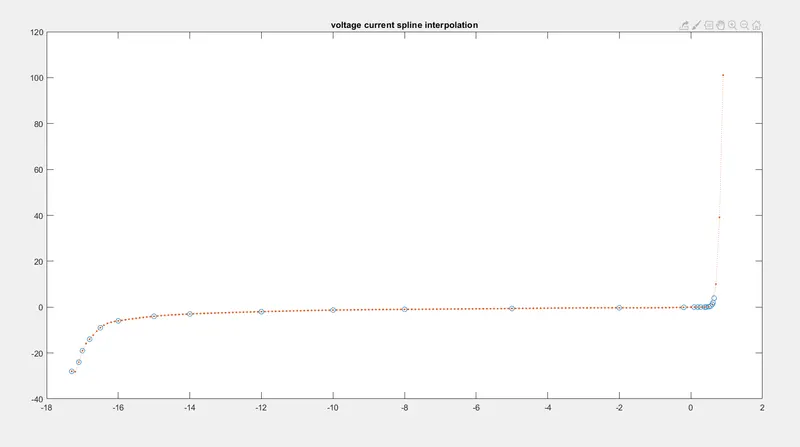
In a laboratory experiment, data of voltage and current has been recorded and the same is attached in an excel file ( Click on this link VI.xlsx ). Read the excel file in the Matlab program and perform the interpolation in the range of -17.3:0.1:0.9. Generate the interactive plot for the interpolated data and store them in a text file.
Ans. MATLAB Code:
 d = xlsread('VI.xlsx'); %reading the excxel flie in matlab
 v = d(:,1); %saving the voltage data in a variable v
 i = d(:,2); %saving the currend data in a variable i
 xq = -17.3:0.1:0.9; % enetring the range
 vq = interp1(v,i,xq,'spline') %spline interpolation is done
 plot(v,i,'o',xq,vq,':.') %plotting the interpolated graph
 title('voltage current spline interpolation'); %adding title to the plot
fid = fopen('vq.txt','w'); % open text file vq.txt and 'w' to write
fprintf(fid,'%f \n',vq); % %f specifies the data type and,'\n' enters the data in a newline
fclose(fid); %closing the file
Result: