Project - Data Handling and Interpolation
First we create an excel filevi.xlsx with voltage and current values.
Then import that data to matlab.
Then read that excel sheet (T=xlsread('vi.xlsx')
Then interpolation done by using interpn.
Perform the interpolation in the range of -17.3:0.1:0.9.
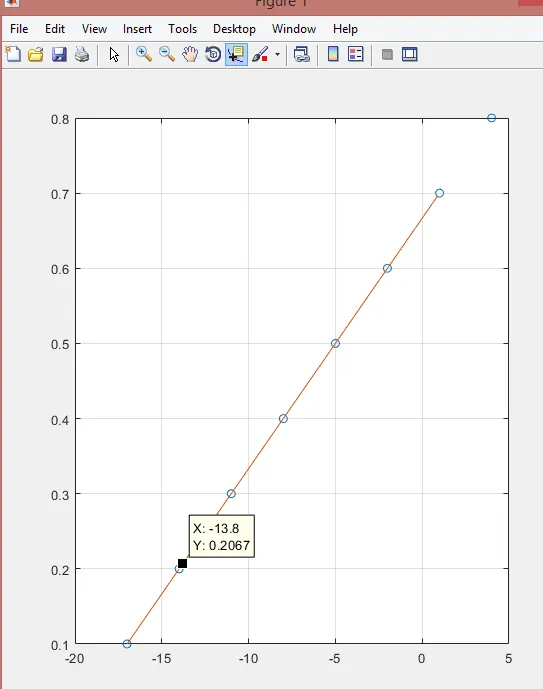
The blue circle represents the samples and the line represents the cubic interpolation.
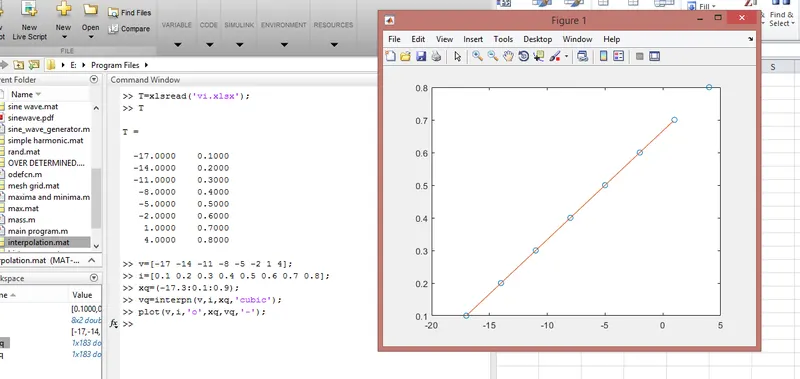
Here v is the voltage values and i is the current values.
Where xq is the interpolation range.
Interpolation is a technique for adding new data points within a range of a set of known data points.
By using the data cursor we can find out the corresponding current values of given voltages.