Project - Data Handling and Interpolation
PROJECT :
close all;
clear all;
clc;
z=xlsread('VI.xlsx');
V=z(:,1);
I=z(:,2);
xq=[-17.3:0.1:0.9];
yq=interp1(V,I,xq,'spline');
plot(V,I,'O',xq,yq,'r--');
xlabel('voltage v');ylabel('current I');
legend('original one','interpolated one');title('spline interpolation');
save project_29.LxL V I
fid=fopen('project_29.txt','w')
fprintf(fid,'%d\n',yq)
fclose(fid)
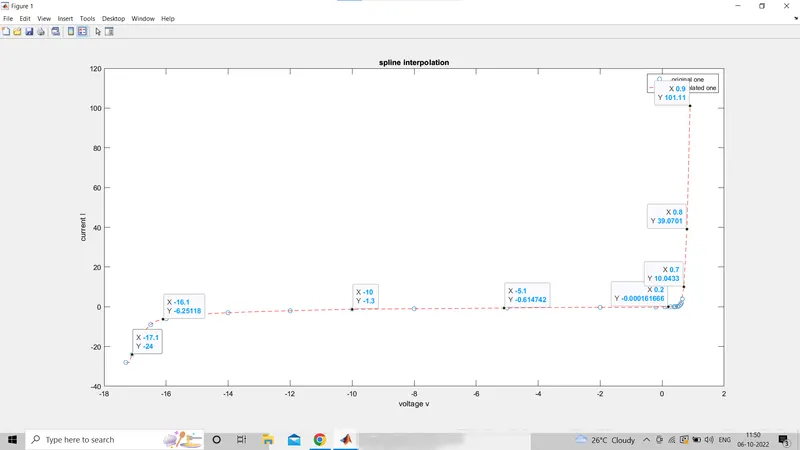
DESCRIPTION:
We have given the data of voltage and current taken into the file name is VI.xlsx. After i took the file voltage it is the first column and current(I) is second column. By the given interval data i.e.(xq)=[-17.3:0.1:0.9].I took the interpolation values of voltage ,current using for the spline. I took the two labels x and y.xlabel is taken voltage(V) and ylabel is taken current(I).Also i took the legend and title of the graph. legend is taken original one ,interpolated one and title is the spline interpolation.From using above values ploted the graph by using the different colours ,different lines and symbol of circle.After the plotted the graphit is saved in the name as project_29.txt. V I. After saving project file is opened ,printed the project file and close the project file .Sloved the problem.