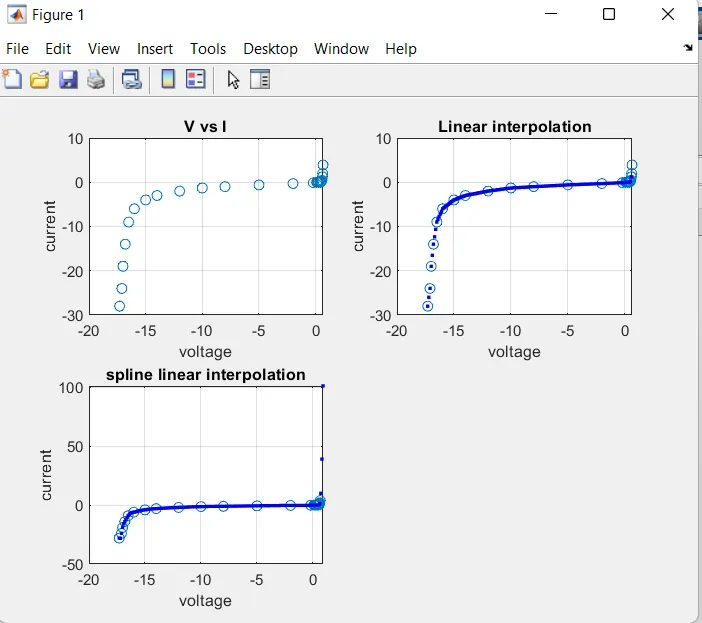
Project - Data Handling and Interpolation
AIM:
Generate the interactive plot for the interpolated data and store them in a text file.
Code:
x=xlsread('VI.xlsx')
V=x(:,1);I=x(:,2);
vq=(-17.3:0.1:0.9);
subplot(2,2,1);
plot(V,I,'o');
grid on;
xlabel('voltage');
ylabel('current');
title('V vs I');
yq1=interp1(V,I,vq);
subplot(2,2,2);
plot(V,I,'o',vq,yq1,'b.');
grid on;
title('Linear interpolation');
xlabel('voltage');
ylabel('current');
yq2=interp1(V,I,vq,'spline');
subplot(2,2,3);
plot(V,I,'o',vq,yq2,'b.');
grid on;
title('spline linear interpolation');
xlabel('voltage');
ylabel('current');
f=fopen('vi.text','w');
fprintf(f,'%6s %12s\n','[yq1;yq2]');
fclose(f);