Project - Data Handling and Interpolation
Project :
Demand. In a laboratory experiment, data of voltage and current has been recorded and the same is attached in an excel file read the excel file in the Matlab program and perform the interpolation in the range of -17.3:0.1:0.9. Generate the interactive plot for the interpolated data and store them in a text file.
Solution:
1. Given Laboratory Experiment data excel sheet 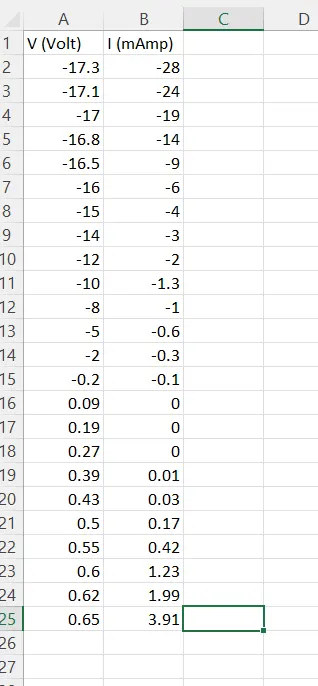
2. Script used in Expirement 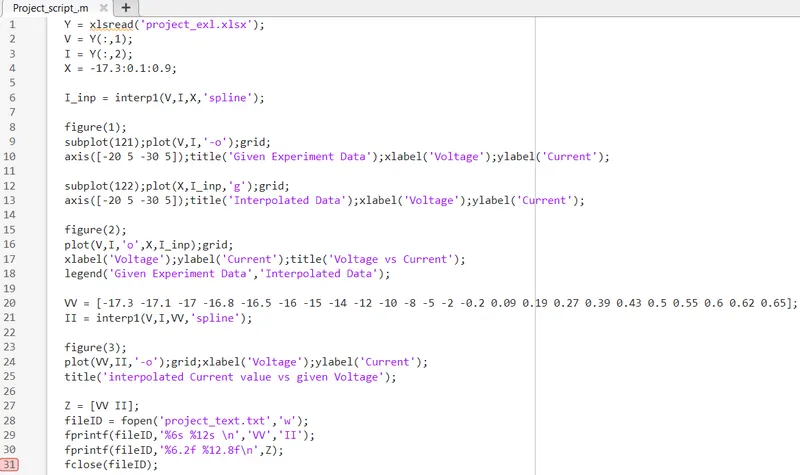
****Explaination for the used script****
Y = xlsread('project_exl.xlsx');
% Used for reading the laboratory experiment .xlsx file
V = Y(:,1);
% Storing first column voltage value of 'Y' in 'V'
I = Y(:,2);
% Storing second column current value of 'Y' in 'I'
X = -17.3:0.1:0.9;
% Applying given range of data mentioned in laboratory expirement
I_inp = interp1(V,I,X,'spline');
% Using 'interp1' function for calculating current value for given range 'X'
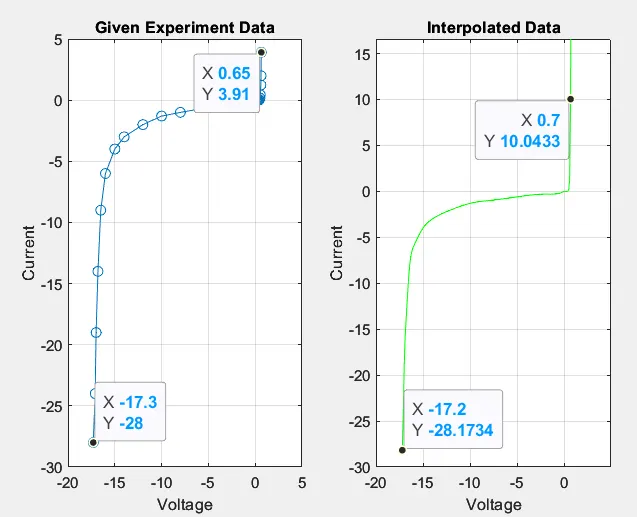
figure(1);
subplot(121);plot(V,I,'-o');grid;
% Plotting trig_function with time
axis([-20 5 -30 5]);
% Defined axis timit to plot
title('Given Experiment Data');
% Giving title to the plot
xlabel('Voltage');ylabel('Current');
% Giving Labels to both the axis's
subplot(122);plot(X,I_inp,'g');grid;
% Plotting trig_function with time for subplot 2
axis([-20 5 -30 5]);
% Defined axis timit to plot
title('Interpolated Data');
% Giving title to subplot 2
xlabel('Voltage');ylabel('Current');
% Giving Labels to both the axis's for subplot 2
figure(2);
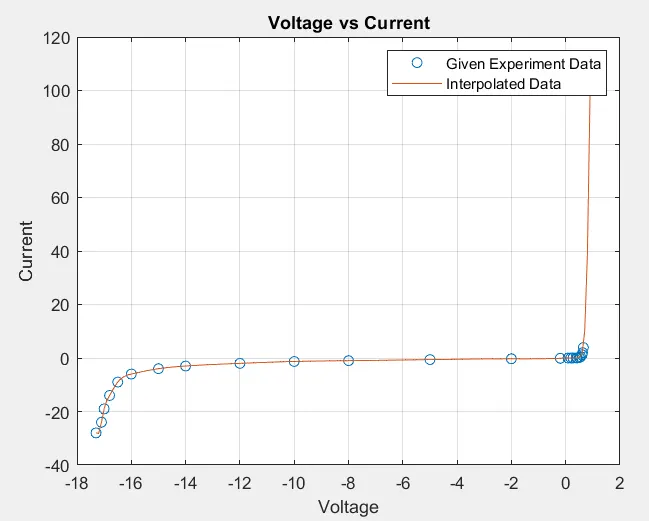
plot(V,I,'o',X,I_inp);grid;
% Plotting the values
xlabel('Voltage');ylabel('Current');
% Giving Labels to both the axis's
title('Voltage vs Current');
% Giving title to the plot
legend('Given Experiment Data','Interpolated Data');
% Showing legends for expresed data set
VV = [-17.3 -17.1 -17 -16.8 -16.5 -16 -15 -14 -12 -10 -8 -5 -2 -0.2 0.09 0.19 0.27 0.39 0.43 0.5 0.55 0.6 0.62 0.65];
% Given voltage data in laboratory experiment
II = interp1(V,I,VV,'spline');
% again using 'interp1' function for calculating current value for given voltage
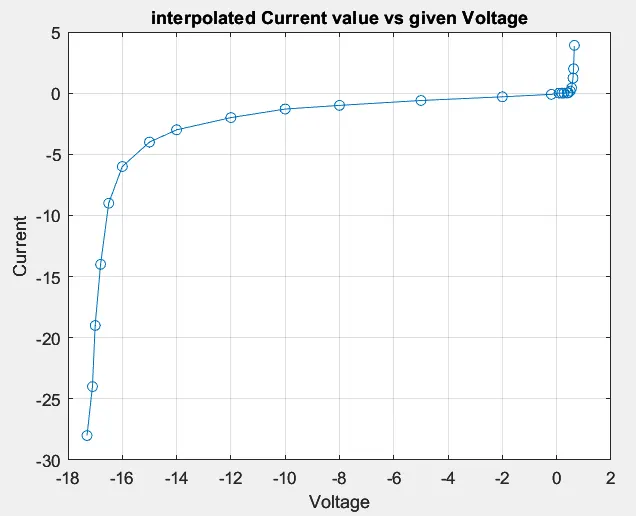
figure(3);
plot(VV,II,'-o');grid;
% Plotting the values
xlabel('Voltage');ylabel('Current');
title('interpolated Current value vs given Voltage');
Z = [VV II];
% Putting interpolated values of 'VV' and 'II' into a matrix 'Z'
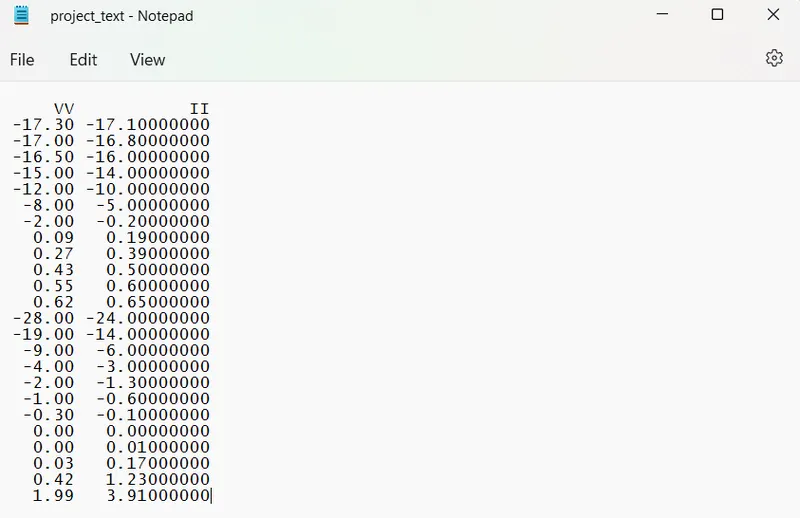
fileID = fopen('project_text.txt','w');
% Opening output text file
fprintf(fileID,'%6s %12s \n','VV','II');
% Storing values of variables in the text file
fprintf(fileID,'%6.2f %12.8f\n',Z);
% Storing values of variable 'Z' in the text file
fclose(fileID);
% Closing Output file
Text file is shown below -
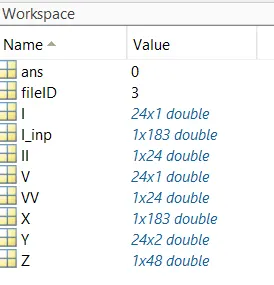
% Workspace output after all calculations