Project - Data Handling and Interpolation
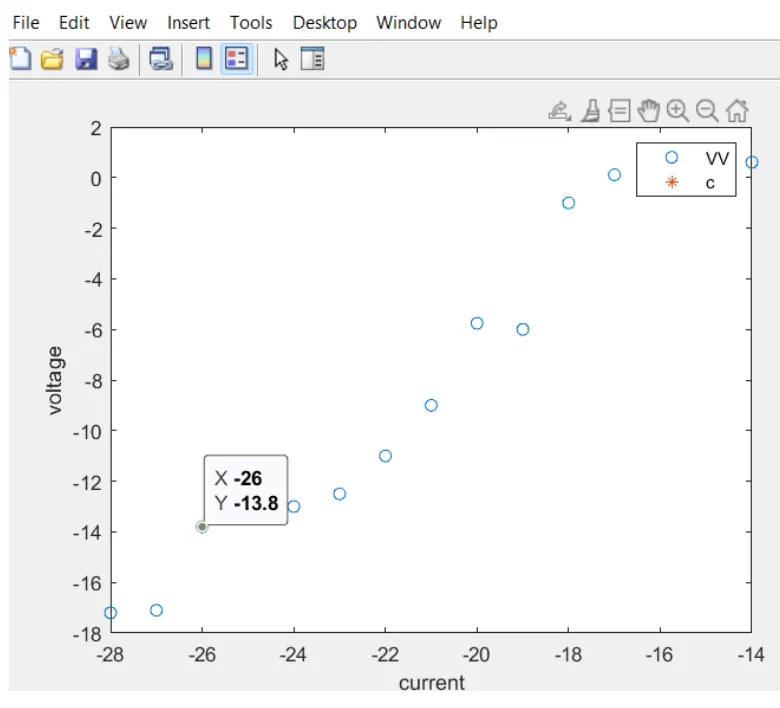
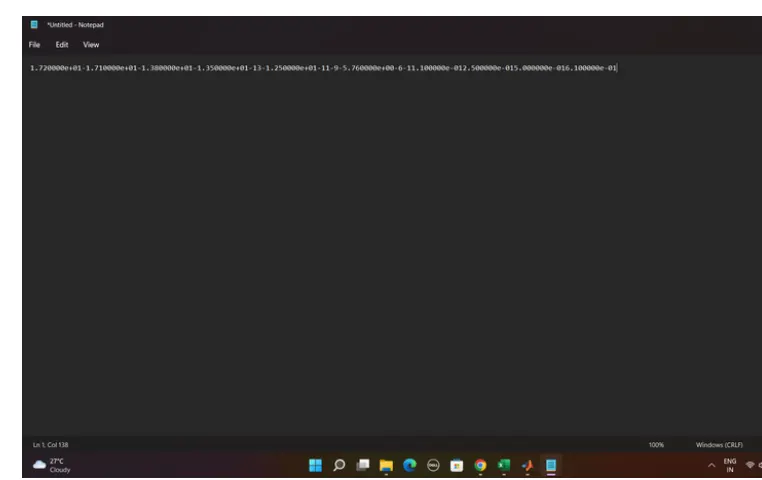
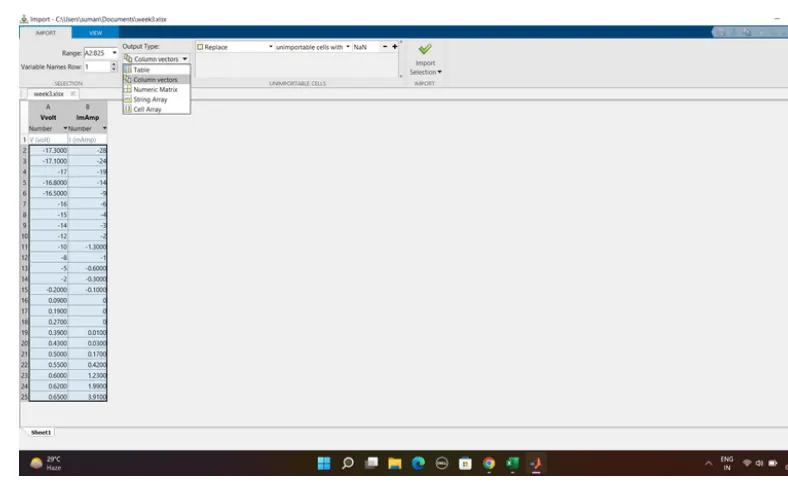
In a laboratory experiment, data of voltage and current has been recorded and the same is attached in an excel file ( Click on this link VI.xlsx ). Read the excel file in the Matlab program and perform the interpolation in the range of CC Generate the interactive plot for the interpolated data and store them in a text file.
Answer:
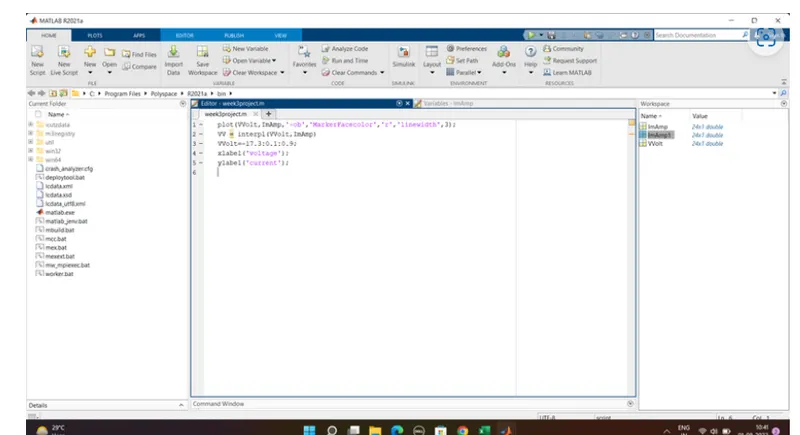
Plot((vvolt,ImAmp, '-ob' ,'MarkerFacecolor' 'r' ,'linewidth' ,3);
vv=interpl(vvolt,ImAmp)
vvolt=-17.3:0.1:0.9;
xlabel('voltage');
ylabel('current');
plot(vvolt,ImAmp,'-ob','MarkerFacecolor','r','linewidth',3);
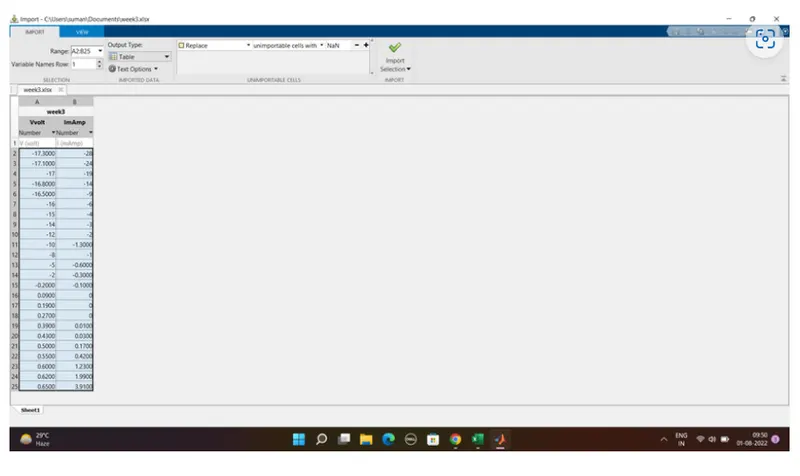
fileid1=fopen('c : \users\suman\Documents\weeks3 .x1sx' , 'r')
fileid=fopen('c:\users\suman\Documents\matlab basics\project.txt' , 'w')
W =[-17.2 -17.1 -13.5 -13.0 -12.5 -11 -9 -5.76 -6 -1 0.11 0.25 0.5 0.61];
vvolt=-17.3:0.1:0.9;
c=interpl(vv,vvolt);
fprintf(fileid,'%d',vv)
figure
plot((-28:-14),vv,'o',vvolt,c,'*');
ylabel('voltage');
xlabel('current');
legend('vv','c');
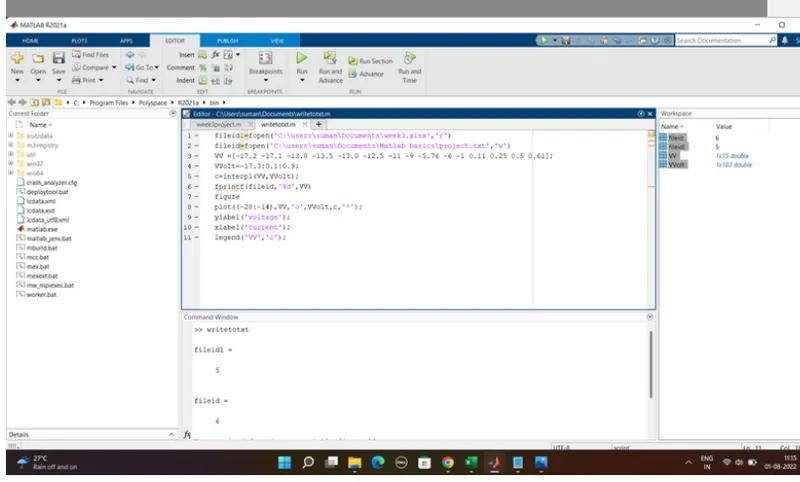
fileidl=fopen('C:\users\suman\Documents\week3.xlsx','r')
fileid=fopen('C:\users\suman\Documents\Matlab basics\project.txt','w')
VV =[-17.2 -17.1 -13.8 -13.5 -13.0 -12.5 -11 -9 -5.76 -6 -1 0.11 0.25 0.5 0.61];
VVolt=-17.3:0.1:0.9;
c=interpl(VV,VVolt);
fprintf(fileid,'%d',VV)
figure
plot((-28:-14),VV,'o',VVolt,c,'*');
ylabel('voltage');
xlabel('current');
legend('VV','c');