Data Handling and Interpolation in MATLAB
Project :
In a laboratory experiment, data of voltage and current has been recorded and the same is attached in an excel file ( VI.xlsx ). Read the excel file in the Matlab program and perform the interpolation in the range of -17.3:0.1:0.9. Generate the interactive plot for the interpolated data. Additionally, compute the current values for given voltages below and store them in a text file.
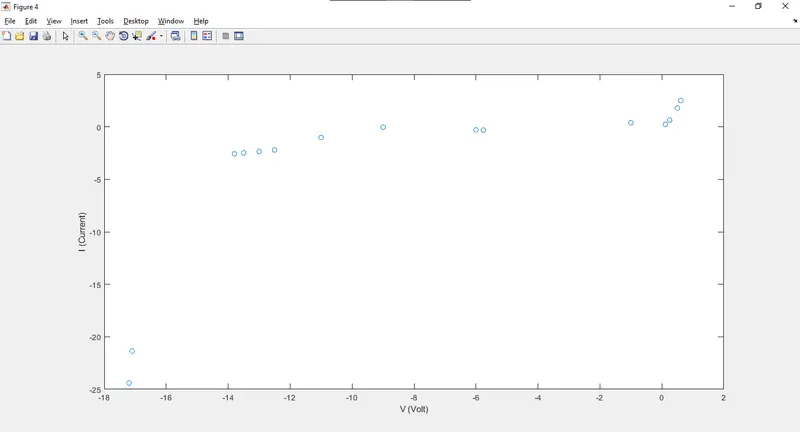
VV =[-17.2 -17.1 -13.8 -13.5 -13.0 -12.5 -11 -9 -5.76 -6 -1 0.11 0.25 0.5 0.61]’
Sol :
1 -> Given file named 'VI.xlsx' was called with the function. Then, both columns are defined as V and I as a matrix form.
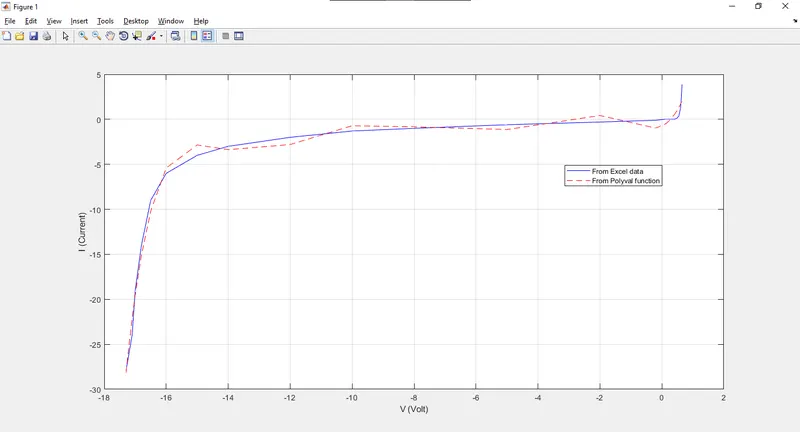
2 -> Data was plotted as it was to see behaviour/relation between both variable.
3 -> Now, to check the best fit of the data of variable2 (current) on independent variable1 (volt), 'polyfit' function is used. From this function, co-efficients of polynomial and it's order can be known. Here, the result shows in MatLab that the data can be best fit in the polynomial with 7th order and determined co-efficient.
4 -> Then, data is validated through 'polyval' function to generate o/p data (Current) for each i/p data (Volt).
5 -> Validated data was plotted with the '--' line type. These 2 graphes are plotted in figure(1) and it also defined.
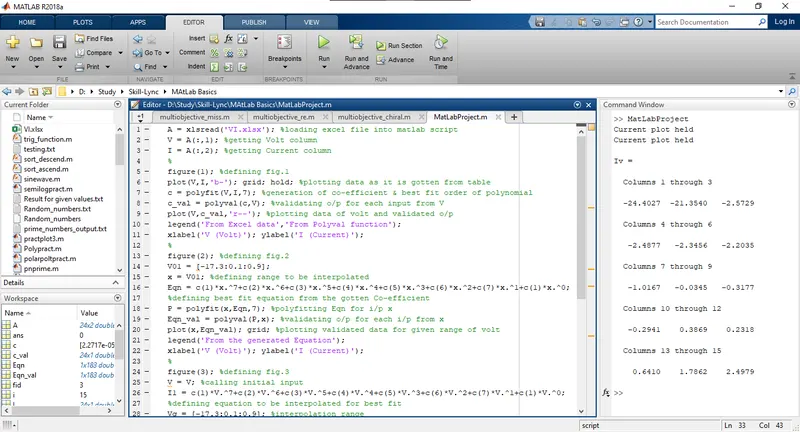
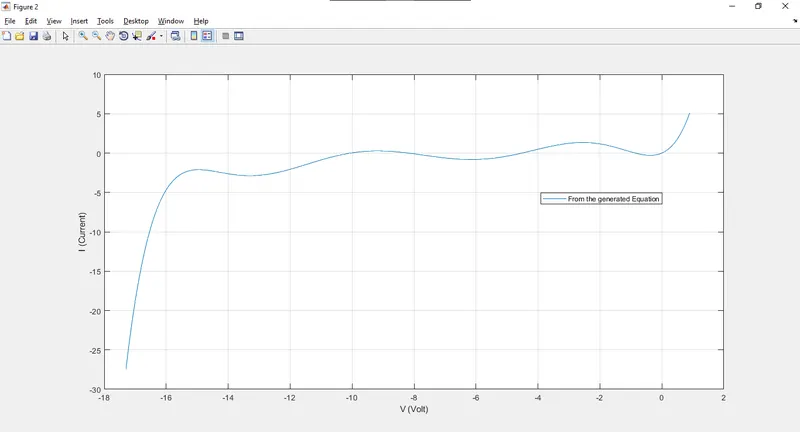
6 -> In figure(2), data is taken from the range to be interpolated in form of 'x' vector'.
7 -> Now, we know that the polynomial is of 7th order and co-efficients also can be called from the polyfit function. Thus, the best fit equation can defined, polyfitted by 'polyfit' function, validated by 'polyval' function and plotted this validated values are plotted in figure(2). Thus, the functionability of the generated function can be varified thoroughly.
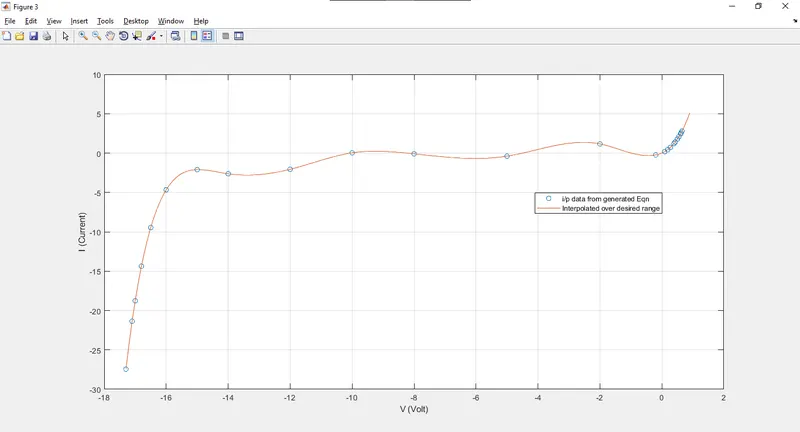
8 -> INTERPOLATION [figure(3)]
- For interpolation, we have created and verified the function. So, an input from independent variable (volt) as a vector and output created function (current) as a vector are defined.
- Then, the range is defined in which intepolation has to be done.
- Finally, the intepolation is done with the 'interp1' function, as here we are having only one independent variable, taking inputs as an available data and an estimated equation over the range defined.
- Plotting of available data and interpolated data is done with different line types. in figure(3).
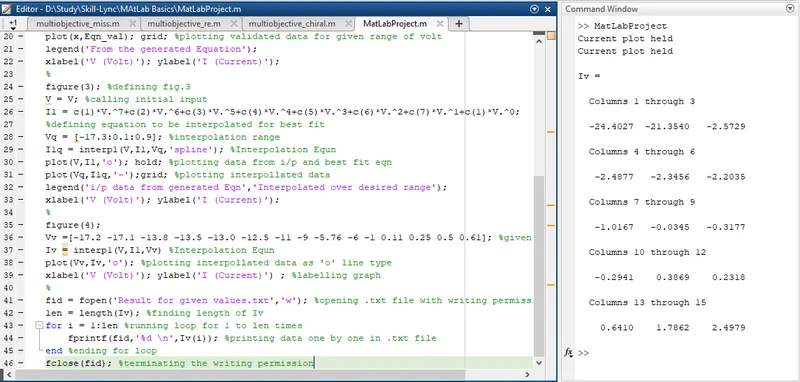
9 -> FIGURE (4) To compute the current values for given data, given data is loaded as Vv matrix and interpollated with 'interp1' for same input as above over the given data and the statement was not terminated with ';' to get an output vector in command window (can be seen in both figures). It is also plotted as only dots to get clerification about the calculated data.
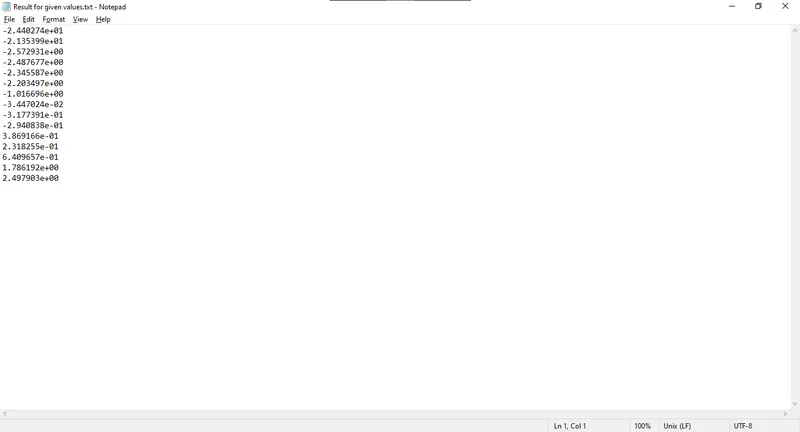
10 -> To get output vector saved in '.txt' file, first 'fopen' function is used with 'w' (writing) permission. Then, length of the output vector is calculated with 'length'. 'for' loop was run for 1 to len times to print each value of Iv vector in '.txt' file. Lastly, to terminate the given permission and close the file, 'fclose' function is used. File is saved as 'Results for given values.txt'.